Two-phase equilibrium and molecular hydrogen formation in damped Lyman-alpha systems
Molecular hydrogen is quite underabundant in damped Lyman- systems at high redshift, when compared to the interstellar medium near the Sun. This has been interpreted as implying that the gas in damped Lyman- systems is warm. like the nearby neutral intercloud medium, rather than cool, as in the clouds which give rise to most H I absorption in the Milky Way. Other lines of evidence suggest that the gas in damped Lyman- systems – in whole or part – is actually cool; spectroscopy of neutral and ionized carbon, discussed here, shows that the damped Lyman- systems observed at lower redshift z 2.3 are largely cool, while those seen at z 2.8 are warm (though not devoid of ). To interpret the observations of carbon and hydrogen we constructed detailed numerical models of formation under the conditions of two-phase thermal equilibrium, like those which account for conditions near the Sun, but with varying metallicity, dust-gas ratio, . We find that the low metallicity of damped Lyman- systems is enough to suppress formation by many orders of magnitude even in cool diffuse clouds, as long as the ambient optical/uv radiation field is not too small. For very low metallicity and under the most diffuse conditions, formation will be dominated by slow gas-phase processes not involving grains, and a minimum molecular fraction in the range is expected.
Key Words.:
quasars: absorption lines; ISM: molecules1 Introduction.
Perhaps it is something of a paradox, but large ground-based optical telescopes like Keck and VLT routinely do absorption-line spectroscopy of the gas in high-redshift objects which surpasses what can be done for the interstellar medium (ISM) of our own Galaxy near the Sun. Viewing neutral gas at high redshift makes the dominant ion stages (C II, Fe II, etc.) accessible, to say nothing of Lyman series in H I and D I and the Lyman and Werner bands of . The high spectral resolution and large collecting areas of modern ground-based instrumentation cannot easily be matched in space-based instruments, and certainly not for the same cost.
Thus we may have exquisitely detailed and sensitive spectra of systems which cannot be imaged, whose nature is therefore left to be inferred from their patterns of gas kinematics (Prochaska & Wolfe, 1997, 1998; Haehnelt et al., 1998; Ledoux et al., 1998; McDonald & Miralda-Escudé, 1999) and ionization (Wolfe & Prochaska, 2000a, b). So it is with most damped Lyman- systems, defined as those absorption-line systems having N(H I) when seen against the emission of background QSO’s. Although well-formed galaxian systems can and do harbor some of them at low redshift, damped Lyman- systems are for the most part believed to be protogalactic objects, perhaps in disk systems (Prochaska & Wolfe) or perhaps in the ongoing merger of protogalactic clumps (Haehnelt et al., 1998). The numbers are such that damped Lyman- systems seem to contain at least as many baryons as can be found in the local Universe now, and it is of great interest to understand how these baryons become recognizable nearby objects within a relatively short redshift interval.
The absorption-line gas in damped Lyman- systems is easily discussed in the same terms, using the same physical processes, that are employed locally. Evidence that the rest-frame optical/uv radiation field is comparable to that near the Sun (Levshakov et al., 2002; Molaro et al., 2002; Petitjean et al., 2000) and the presence of metals at a low but non-negligible level 0.1 - 0.01 Solar, makes it possible (or, perhaps, merely hopeful?) to talk about the “interstellar medium” in these systems. The low metallicity and general underabundance of dust (which is not directly observed in any one object but can be inferred statistically (Fall & Pei, 1993; Pei et al., 1991) or from patterns of gaseous abundances (Boisse et al., 1998)) may render the gaseous medium in damped Lyman- systems only more extreme versions of those in local dwarf systems like the LMC and SMC 111Boisse et al. (1998) show that there there is a bias against finding high metallicity damped Lyman- systems at high N(H I), because the background sources are extinguished. . But it has also been argued that the apparent recognizability of patterns in the absorption spectra has been over-interpreted (Izotov et al., 2001), and that the similarity of intermediate and low ion kinematics (Al III and C II or Fe II; C IV and C II behave differently) could mean that substantial ionization corrections to the metallicity are needed (however, see Vladilo et al. (2001) for a contrary opinion).
At the present time there seem to be several lines of evidence suggesting that, unlike the local ISM (where low-altitude neutral gas is perhaps 2/3 cool and 1/3 warm and the overall ratio including high-altitude material is 1/2 and 1/2) the gas in damped Lyman- systems is more predominantly warm. Examples include the high H I spin temperatures inferred from comparison of cm and Lyman- absorption (Wolfe & Davis, 1979; Carilli et al., 1996a, c; Chengalur & Kanekar, 2000; Kanekar & Chengalur, 2001) (but see Lane et al. (2000)), the similarity of low and intermediate ion kinematics mentioned in the preceding paragraph, and the very low column densities of discussed here. Along lines of sight with reddening EB-V 0.05 mag (N(H) ) in local spectra, it is always the case that a few percent or more of the neutral hydrogen is molecular. By contrast, the molecular hydrogen fraction in damped Lyman- systems is 2-4 orders of magnitude lower (, which can be interpreted as meaning that the gas temperature must be above 3000 K (Petitjean et al., 2000) Lanzetta et al. (1989) used N()/N(H) to constrain the dust/gas ratio toward Q1337+113, similar to the approach taken in this work.
Here we consider the formation of molecular hydrogen in a gas which is in two-phase thermal equilibrium at low metallicity. Perhaps because has been observable so rarely in the local ISM there is not a big literature on this subject, but the extant 1970’s-era observations are well-explained in this way (Liszt & Lucas, 2000) using modern shielding factors for radiative dissociation (Lee et al., 1996). The only surprise (if there indeed is one) is the low densities that are required to start formation locally, and the fact that even a “standard” H I cloud (Spitzer, 1978) should have a molecular fraction of 10-30% deep inside. Local diffuse clouds also have surprisingly high abundances of complex polyatomic species which follow immediately upon the presence of (Liszt & Lucas, 1996; Lucas & Liszt, 1996), a phenomenon which is not well understood but which can be used to account for the observed abundancess of simpler species such as CO (Liszt & Lucas, 2000).
In the course of this work, we consider the ionization and fine-structure excitation of carbon, and the inferences which may be drawn from observations of carbon in the damped Lyman- systems. While the importance of carbon to the physical state of the gas and the conditions for forming cannot be stressed too highly, the extended discussion here in fact arose because of something of a coincidence. Searching the literature, it quickly became evident that there is a high degree of overlap between the two relatively scant datasets for carbon (chiefly, C I, C II, and C II*) and .
The plan of the current discussion is as follows. In Sect. 2 we lay out the basics of a calculation of two-phase equilibrium essentially following Wolfire et al. (1995a). We examine the sensitivity of two-phase equilibrium to variations in abundance, depletion, incident radiation and the like, in order to extract from the calculations those aspects which can be related to existing absorption line data on damped Lyman- systems. In Sect. 3 we compare the results of these calculations with observed hydrogen and carbon column densities: we show that the observations are consistent with an origin in largely cool gas for the damped Lyman- systems at lower z (z 2.3) and in warm gas at higher redshift. In Sect. 4 we describe calculations of the abundance in both warm and cool diffuse gas, under conditions of varying metallicty, , employing (slow) gas-phase processes to explore the minimum expected amounts of molecular gas, and the more usual grain-catalysis (as in Liszt & Lucas (2000)) for cooler regions of higher molecular fraction. We also compute the variation of the molecular hydrogen fraction in small gas clots of constant density. From this, it follows that the low metallicities of damped Lyman- systems are by themselves sufficient to cause decreases in the molecular fraction by many orders of magnitude, even if cool neutral clouds are present.
2 Two-phase equilibrium of the ISM
2.1 Particulars and parameter sensitivities
The ISM is so complicated that any model of it is bound to be heavily idealized and stylized, especially the assumption of a strict equilibrium. But some aspects, especially the presence of phases – discrete regimes of density and ionization – seem robust to variations in the underlying parameters. The existence of multiphase gas seems to be quite general, highly conserved across space and time.
The basis of the present work is a calculation of two-phase equilibrium following work on the local ISM by Wolfire et al. (1995a). Notable constraints on the model locally are the thermal pressure range P/k = K observed ( C I and C I*) in neutral gas locally by Jenkins et al. (1983), and the electron density in warm gas at the Solar radius n (Taylor & Cordes, 1993). As noted by Wolfire et al. (1995a), strict two-phase equilibrium is an idealized goal toward which the ISM may tend, but true equilibrium is hard to attain, especially in warm gas where the cooling timescales are long.
.
Basically, this ”standard” model of the local diffuse ISM is driven by the heating due (in increasing order of importance in warm gas) to cosmic-rays, soft X-rays, and – the dominant mechanism in both warm and cool gas – the photoelectric effect on small grains (Bakes & Tielens, 1994). The charge state of the small grains, their heating rates and the recombination of ions on them (which dominates over gas-phase processes at moderate densities in diffuse gas) are all very sensitive to the electron density, so local thermal and ionization equilbria are tightly coupled. Given that carbon is the main source of cooling in cooler gas (O I to a lesser extent) and an important source of free electrons, it follows that the equilibrium conditions and the condition of carbon in the gas are very tightly coupled.
We recently used this code (Liszt, 2001) to discuss the behaviour of the H I spin temperature in local warm gas (the H I there is not generally thermalized by collisions in multiphase equilbrium) and to calculate the abundances of and CO in denser diffuse gas (Liszt & Lucas, 2000). The latter reference describes the model in more detail than will be given here, especially the various collisional processes which drive fine-structure cooling in the gas (they are, of course also discussed in the original reference by Wolfire et al. (1995a)).
Our basic calculation differs from that of Wolfire et al. (1995a) in two minor ways which are subsumed by the extent of our parameter variations. The earlier authors took the locally-determined soft X-ray flux from Garmire et al. (1992) and decomposed it into three components, each of which they represented by a (physically-motivated) plasma emissivity which was then separately attenuated (or not) by an assumed column of warm gas; the three contributions were then summed to provide the assumed incident X-ray spectrum at a typical location. Their final spectrum is characterized by a quantity they called Nw, the overall column of warm gas attenuating part of the incident spectrum 222The soft X-ray flux is so fragile that any cool gas interposed would absorb all of it, given that cool gas does not appear in small increments whose standard value they took to be Nw H atoms We used a simpler representation of the soft X-ray flux, whereby the observed spectrum is attenuated by a column of neutral gas Nw directly. Our standard value of Nw H atoms produces a pressure-density curve which differs little from that of Wolfire et al. (1995a).
We also used a somewhat different set of reference (Solar) atomic abundances whereby log(C/H) = -3.44, log(O/C) = 0.32, namely those which accompanied the distribution of the soft X-ray absorption cross- sections from (Balucinska-Church & McCammon, 1992), which both we and Wolfire et al. (1995a) used (in their most recently updated version). In both calculations the reference model has (following Wolfire et al. (1995a)) little or no depletion of the gas phase oxygen and carbon onto grains, which might be acceptable for warm gas (where carbon does not bear the brunt of the cooling or contribute many of the electrons, see below) but is unlikely to be reasonable in local cool gas; if there are grains, they have to be made of something! The gas phase depletion is considered an adjustable parameter here, independent of the metallicity.
The net effect of these two differences is slight. With the exception of one system, the observations show that carbon is present in the gas in the same proportion as other species which are typically undepleted locally, there is low metallicity, but little global carbon depletion.
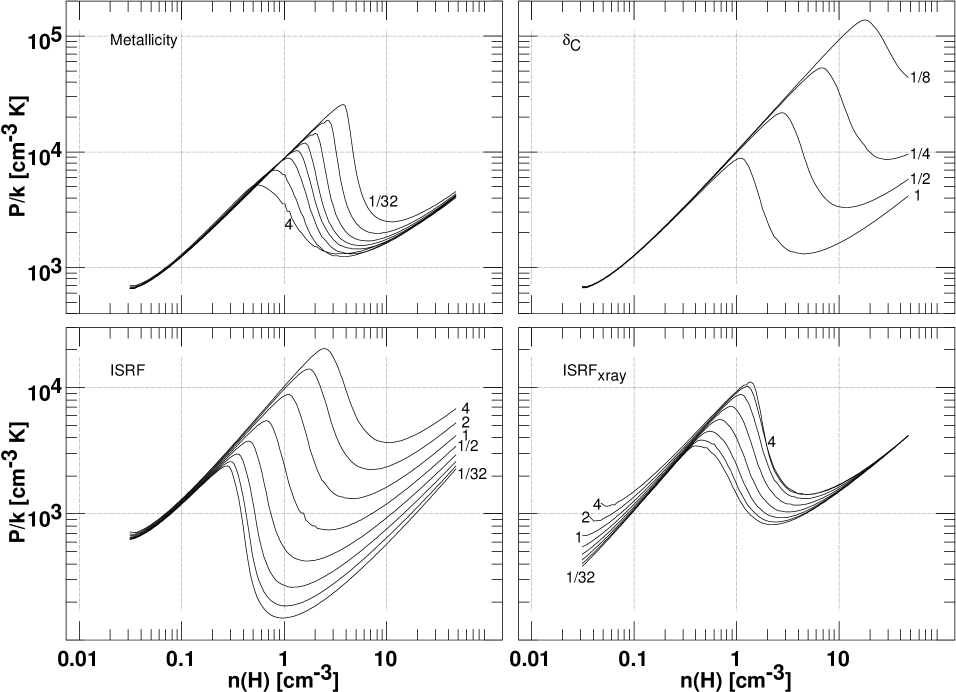
In Fig. 1 we show the basics of two-phase equilibrium and its sensitivity to some assumed parameter variations. In these curves of pressure density (one assumes a density, calculates the ionization and thermal equilibrium, sums the particle densities and multiplies by the derived temperature), the regions where dP/dn are held to be unstable and unlikely to occur in nature. Those pressures for which there are two densities n′ having dP/dn are those for which “two-phase” equilibrium is possible. Two-phase heating and cooling calculations by themselves furnish only the possibility of multi-phase equilibrium; Hennebelle (2000) and Kritsuk & Norman (2002) elaborate on some processes by which phase transitions and multi-phase equilibrium are actually brought about.
The curve labelled “1” in all panels is the same (reference) model; perhaps most clearly at upper right it is apparent that the reference model provides for two-phase equilibrium over precisely the pressure range which is observed in local gas (Jenkins et al., 1983). Typically (but see below and the lower-left panel), only warm (7000 K - 10000 K) neutral gas appears if the density and pressure are below the two-phase regime and only cold (below 1000 K) neutral gas appears if the pressure and density are larger. If conditions are such that the warm gas may persist up to higher density and pressure, or when the cold medium cannot exist except at higher density and pressure, the medium is more likely to be warm.
At the top left, the metallicity is varied by factors of 4 to 1/32 relative to the reference value ; these may be compared with the calculations of Wolfire et al. (1995b) . Many properties of the model actually vary in concert including; the elemental and gas-phase C and O abundances (there is no depletion); the columns of all other species heavier than Helium providing soft X-ray absorption; and the number of grains both large and small (the latter scales the heating rate of photoelectric ejection). Vladilo (1998) shows that the dust/metal ratio D/Z at higher redshift relative to conditions in the Milky Way (MW) so that D/G = D/Z Z/G changes mostly because of metallicity (Z/G), not D/Z. In fact, such an overall scaling has a surprisingly modest effect compared to some other changes discussed next. The warm phase may persist up to slightly higher pressures and densities in gas of lower overall metallicity but the existence of two-phase equilibrium is not threatened as long as the balance between heating (small grains) and cooling (carbon) is maintained in denser gas (as it is in this case).
At upper right, the gas-phase abundances of C and O are decreased while all other parameters are held fixed and this actually has a much more profound effect than scaling the grain (heating) and gas (cooling) abundances in tandem. Carbon provides some heating of the gas ( its ionization, see Spitzer & Scott (1969)) but is more important as a source of electrons, influencing the grain heating and recombination rates, and as a coolant. Clearly, when the ambient fluxes are maintained while the main coolants (carbon and oxygen) and source of electrons are depleted, it is substantially more difficult to provide enough pressure to maintain gas in the cool phase. This hearkens back to our discussion, slightly earlier, of the lack of inclusion of depletion in the reference model for MW conditions. In order to maintain two-phase stability over the reference range of pressures in the presence of gas-phase depletion, the incident optical/uv ionizing radiation field must be decreased somewhat. In fact this might not be unreasonable locally for cool gas, which does not occur in arbitrarily small increments and therefore exists under conditions of non-trivial extinction (especially at uv wavelengths). At lower metallicity, this sort of compensation is less obvious and (consistent with some aspects of the observations) the pressure may in fact be somewhat higher in cool gas.
At lower left, we scale the ambient optical/uv radiation field which ionizes carbon (directly) and provides heating and electrons the photoelectric effect on small grains. Regions whose ambient radiation field (ISRF) falls even a factor four below the average will be predominantly cool. This is an inversion of the normal order of things in diffuse gas and darker clouds in the nearby ISM occur at higher, not lower, thermal pressure.
Last, at lower right, we scale the soft X-ray flux. Cool regions of higher density will probably never see the full extent of the ambient soft x-ray flux because even a small region of appreciable density accumulates a high degree of X-ray absorption. The heating due to soft X-rays tends to increase on a per-event basis as the X-ray spectrum hardens somewhat after absorption, and tends to decrease as the electrons cause more secondary ionization and less direct heating when the ionization fraction is smaller (in neutral gas).
2.2 Thermodynamics
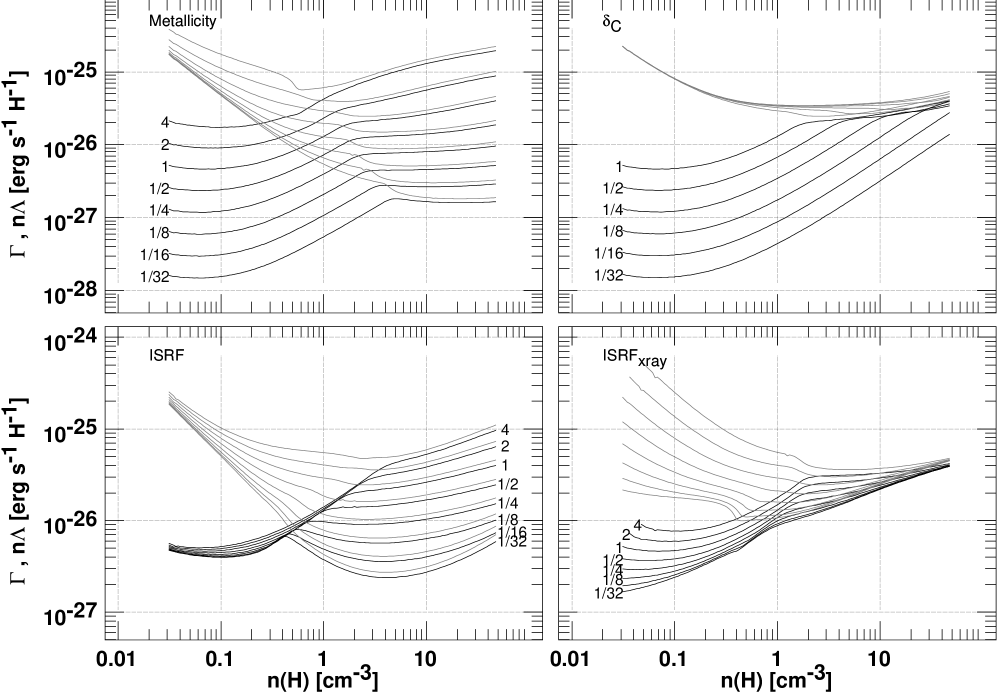
Fig. 2 shows, for the same set of parameter variations, the total gas heating rate and the loss of energy (n) due to cooling in the C II line (discussed below at some length), in units of ergs s-1 H-1. For the reference model, some 90% of the heating is due to the photoelectron effect operating on small grains, see Fig. 3 of Wolfire et al. (1995a). In warm gas, the burden of cooling is taken up by excitation of the Ly- lines under the highly-idealized assumption that all photons escape; in fact, these photons may travel substantial distances but by and large do not always escape a two-phase galactic layer before being absorbed by dust, at Solar metallicity: the situation may actually be very different in three-phase models, see Neufeld (1991) and Liszt (2001). In cool gas, the cooling is due almost entirely to carbon and oxygen fine-structure excitation, in the reference model. The curves of n in Fig. 2 directly show the brightness (normalized; per H) of the C II* cooling transition ; in cool gas the O I∗ transition at makes up most of the cooling not provided by C II.
There is really a quite profound change in the local thermodynamics when the metallicity or ionizing flux varies (Fig. 2, upper and lower left). In particular, while the energy input per H into cool and warm gas is nearly the same for the ”Solar” metallicity and the standard ISRF or higher, it is much smaller in cooler gas when the metallicity is low. In the Milky Way, the carbon cooling rate can be used to infer the heating in both cool and warm gas. In systems of low metallicity such is not the case.
In general, the brightness of the C II line scales with metallicity at all densities (Fig. 2, upper left) and varies nearly linearly in cool phase-stable gas since n(C II*)/n(C II) changes little with metallicity (see Fig 5.). It also scales with the strength of the ISRF in cool gas (Fig. 2, lower left), due to changes in n(C II*)/n(C II) (Fig. 5). The C II brightness varies with depletion at lower densities (Fig. 2 upper right) and slightly, at low density, with variations in the soft X-ray flux. From the results at upper right in Fig. 2 we see that C II may not be the dominant host of cooling in cooler gas, at quite high densities, if the depletion (not the metallicity) is extreme; oxygen becomes the preferred coolant due to the higher energy separation in its ground state fine-structure levels. There is no reason to believe that such conditions occur widely in diffuse gas, either locally or in damped Lyman- systems, although one source in Table 2 (PHL957) seems quite deficient in carbon, given its quoted metallicity.
2.3 Carbon ionization
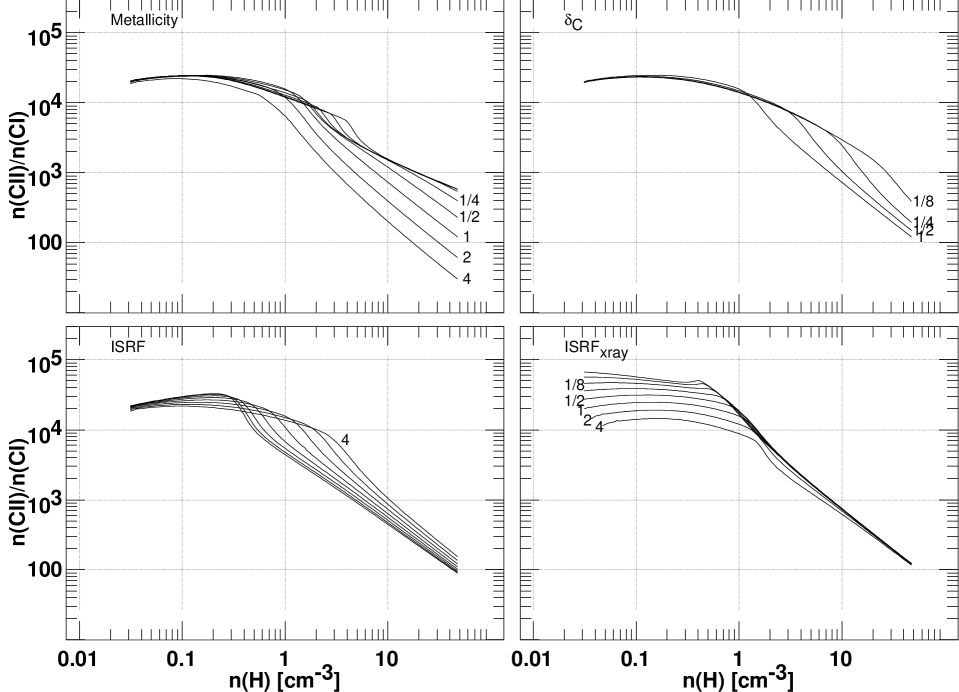
Fig. 3 shows the ratio of the two lowest ionization states of carbon n(C II)/n(C I). It differs by a factor of 40 - 100 between warm and cool neutral gas for the standard model, and is relatively insensitive to parameter changes, redshift, This makes it a sensitive indicator of the thermodynamic state of the gas, as discussed in Sect. 3, but also causes confusion when mixtures of the two phases are observed along the same line of sight (see Sect 2.6). Some aspects of the behaviour shown in Fig. 3 are counter-intuitive; for instance, a stronger ISRF maintains a high C II/C I ratio into denser gas, but the C II/C I ratio is actually in very tenuous gas when the radiation field is higher. This arises in part because the equilibrium pressure increases with the strength of the radiation field and partly due to the level of ionization in the gas (which is not solely determined by carbon).
If the C II lines are saturated or N(C II) is otherwise unknown, but N(C I) and N(H) are available, the thermodynamic state of the gas may also be inferred by computing N(C)/N(H) N(C II)/N(H) N(C II)/N(C I) N(C I)/N(H). Presumably, if the gas is actually cool, the inferred carbon abundance will be much too large (inconsistent with the metallicity) if the high n(C II)/n(C I) ratios typical of warm gas are assumed.
2.4 C I fine-structure excitation
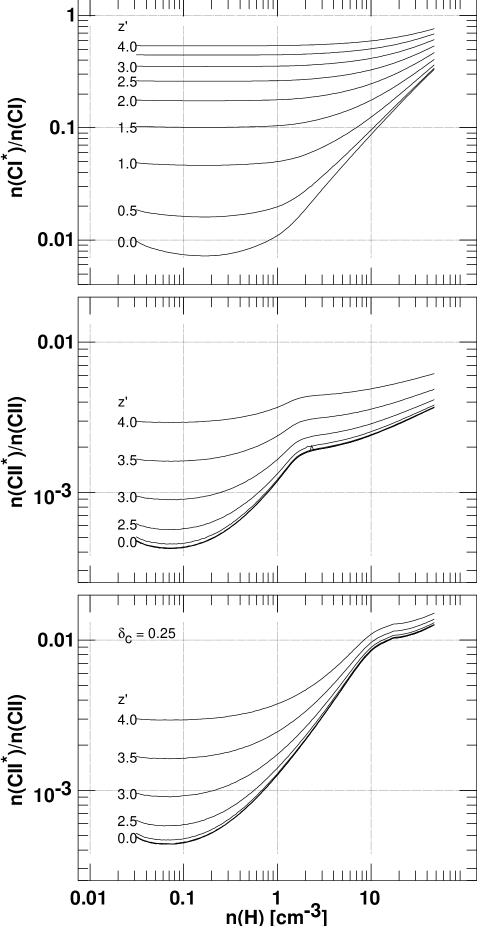
The triplet fine-structure of the C I ground state is also accessible to spectroscopy. It is actually rather insensitive to the parameter variations noted above (with the slight exception that C I*/C I increases modestly with increasing X-ray flux at low density) but responds very strongly to a change in the cosmic background level because the first excited state is only 23.2 K above ground. Fig. 4 (top) shows the ratio of populations in the lowest two levels as a function of . Clearly, this ratio is a sensitive indicator of the ionization state at low redshift (it differs by a factor of about thirty between warm and cool gas) but is rather insensitive for redshifts above 1.5 or so. The C I*/C I ratio measures at high redshift in the context of our models (see Roth & Meyer (1992)). Although perhaps within observational errors, it follows from the results in Fig. 4 that quoted column densities of neutral carbon for high-z systems should include a correction factor for the excited state population.
2.5 Cooling rates and C II fine-structure excitation
The rate of energy loss due to a radiative transition between two levels k and j having statistical weights gk and gj, level populations nk and nj (units of ), energy separation Ekj and spontaneous emission rate Akj (s-1), immersed in an isotropic radiation field characterized by is (Goldreich & Kwan, 1974)
where Fkj(x) 1/(exp(Ekj/kx)-1). kj is the probability of photon escape, typically varying as kj = (1-exp(-ukj))/(ukj) where u is a geometrical factor of order unity and kj is the optical depth of the transition. The escape probabability is taken as unity in these two-phase models, which is acceptable because the various fine-structure transitions do not achieve high optical depth in typical diffuse clouds. In calculation of the local statistical equilibrium, these expresssions allow for a proper evaluation of the fine-structure cooling rates for varying .
The 133.5 and 133.6 nm C II and C II* absorption lines have received more attention because of the obvious possibility that C II is the dominant ionization stage. But discussions of the excitation of the C II* fine-structure levels often fail to recognize the role of carbon in determining the conditions under which it is observed; in many cases (see Fig. 2) C II will be the dominant coolant when it is the dominant ionization stage. This means that the brightness of the C II line and the C II*/C II ratio are determined by thermodynamic equilibrium – the energy input to the gas which occurs at a given density and temperature. So, if the energy input into the gas does not change, neither will the brightness of the line or the strength of the 133.5 nm C II* absorption line. In Fig. 2 at upper right, for a density of n(H) = 20 , it requires a factor 8 drop in the the amount of carbon in the gas to weaken the line by about a factor 2, all other things being equal.
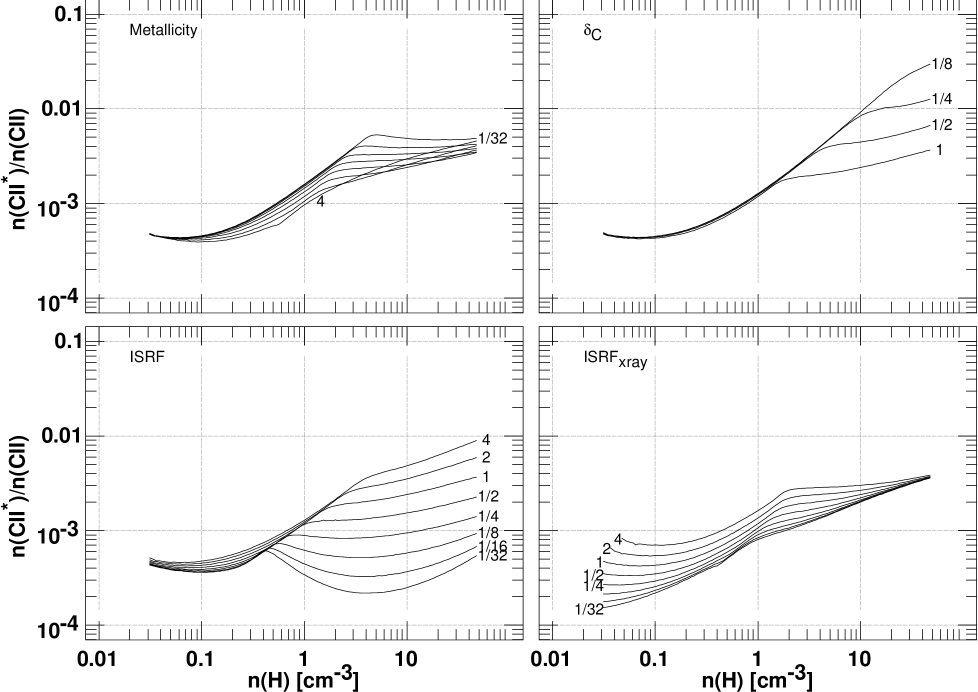
Fig. 5 shows the parameter sensitivities of the C II*/C II ratio. Weak variation in the n(C II*)/n(C II) ratio in cool gas is shown in many ways in the panels of Fig. 5. For the reference model, the ratio varies by only 50% between n(H) = 2 (= 1000 K) and n(H) 40 (= 75 K). The variation with carbon depletion at upper right illustrates the effects of thermodynamic considerations. The ratio n(C II*)/n(C II) increases as carbon is removed from the gas or n(C II) decreases, because the brightness of the line (and n(C II*)) must stay constant in order to carry away a given amount of energy which is being input to the gas (see Fig. 2). The behaviour at lower left, where the C II*/C II ratio is a scaled representation of the cooling rate (also see Fig. 2) shows how the brightness of the line, or the amount of excited-state C II*, must change proportionally as the energy input to the gas changes.
In warm gas where its excitation is weak and C II is not the dominant coolant, the population of the C II* level is susceptible to change with . This is shown in the lower two panels of Fig. 4. The ability of the C II* population to discriminate between phases may be lost at higher redshift.
| Source | 3C286 | 0454+039 | 1756+237 | 1331+170 | 0013-004 | 1232+0815 | PHL957 |
| z | 0.69 | 0.86 | 1.67 | 1.78 | 1.97 | 2.24 | 2.31 |
| Zn/H | -1.22 | -1.1 | -1.27 | -0.80 | -1.20 | -1.38 | |
| N(H I) | 1.8E21 | 4.2E20 | 2.0E20 | 1.5E21 | 5.0E20 | 7.9E20 | 2.8E21 |
| N() | 6.9E19 | 6.3E16 | 5.0E15 | ||||
| N(C I) | 4E13 | 4.4E13 | 1.4E13 | 1.7E13 | 6.3E13 | 4.0E13 | |
| N(C II) | 4.5E16 | 2.7E16 | 7.8E15 | ||||
| N(C II*) | 7.9E13 | 1.4E14 | 1.9E14 | 7.6E13 | |||
| N(C II)mb | 3.8E16 | 1.2E16 | (1.1E16) | 2.9E16 | 2.8E16 | 1.8E16 | 4.1E16 |
| N(C II)/N(C I)c | (952) | (293) | (803) | 2647 | 446 | 445 | 1734 |
| N(C II*)/N(C II) | (0.0072) | 0.0031 | 0.0070 | 0.0097 |
a assumed for illustrative purposes; other (entries) follow
b N(C II)m is the amount of carbon if [C/Zn] is Solar
c values in parentheses use N(C II)m
References:
3C286: Boisse et al. (1998); Roth & Meyer (1992)
0454+039: Boisse et al. (1998); Steidel et al. (1995)
1756+237: Roth & Bauer (1999)
1331+170: Chaffee et al. (1988); Ge et al. (1997)
0013-004: Ge et al. (2001)
1232+0815: Black et al. (1987); Srianand et al. (2000) quote N() = 1.5E17
PHL957: Black et al. (1987)
In this context it is important to note that the E/k = 91 K energy separation of the C II fine-structure levels (to a lesser extent the 232 K separation in O I), is absolutely crucial to the similarity of two-phase equilibrium conditions out to moderate redshift, say z 10. If the gas locally were cooled by softer photons of energy E such that we could observe out to some redshift where E/k, the distant gas would have to have a different coolant. It is apparent from the behaviour of the C I*/C I ratio in Fig 4 that C I*, for example, could not be an important gas coolant at z 3. The same is true of the lower lines of CO (where E/k = 5.5 K, 11.0 K, 16.5 K, ).
2.6 Observing admixtures of the two phases
When a property like the N(C II*)/N(C II) ratio – call it R – takes on values RW and RC in warm and cool gas, respectively, and a transparent superposition of phases is observed to have a global value ROBS, ROBS is related to the proportion of gas in the two phases as
where FC is defined as the fraction of the gas in the cool phase.
In stable two-phase gas (Fig. 3 at upper left) RW= 20000 and (roughly) RC = 700/n(H) in gas of Solar metallicity (RC varies rather less at low metallicity). In this case, measuring a global average of, say, ROBS = 1000 implies only that there is some fraction FC of gas having RC along the line of sight.
This ambiguity cannot generally be resolved with recourse to comparison of profiles, which are largely undifferentiated in the C II line, having been broadened due to some combination of; underlying kinematics in the host system; doppler-broadening of individual gas complexes; and, saturation. In the Milky Way, C II lines are typically fit with much larger b-values (Doppler broadening parameters) even when a single cloud or gas complex dominates the line of sight to a nearby star ( Morton (1975)). Because of this one cannot, for instance, try to compare the C II* with only that fraction of the C II which overlaps it in velocity.
3 Warm or cool gas in damped Lyman- systems? – observations of C I and C II
In Tables 1 and 2 we have gathered information on the neutral and ionized carbon lines available in the literature. For each source we show the observed column densities, and the metallicity derived from zinc, which is believed to be (at most) only lightly depleted (Pettini et al., 1994; Vladilo et al., 2000). From the metallicity we derive a quantity N(C II)m which is meant to represent the maximum amount of carbon available in the gas phase, i.e. it is the column density of carbon assuming that carbon and zinc have the same metallicity and depletion. Comparison with the measured C II column densities shows that carbon is lacking, with the notable exception of PHL957. N(C II)m is used as a surrogate where measured values of N(C II) are unavailable at low redshift in Table 1.
The ratio N(C II)/N(C I) is much larger for the sources at high z in Table 2, above 13,000-30,000, consistent only with an origin in overwhelmingly warm gas: the fraction of cool gas must be of order a few percent at most. At lower redshift, two of the measured ratios, and that inferred for the source 1756+237, are below 1000, consistent with cool neutral gas in the stable region of the two-phase equilibrium, at thermal pressures P/k = 3,000 - 4000 K, and densities n(H) = 10 - 70 . The data for PHL957 are also consistent with stable cool gas at n(H) , p/k K, while 1331+170 is in the marginally unstable region at n(H) = , p/k = K. For the systems at lower redshift, there must be a very large proportion of cool gas, though we cannot say exactly how much.
The N(C II*)/N(C II) ratios are noticeably smaller at high redshift in Table 2, and would presumably be smaller still by a factor 2 or more, were it not for the cosmic background radiation, which has a noticeable effect (only) above z = 2.5 in warm gas (see Fig. 4). The N(C II*)/N(C II) ratios observed at lower redshift, in presumably cool gas, are 50-100% higher than in the models. This could be explained by an enhanced ISRF (Fig. 5, bottom left panel) or by some depletion of carbon for PHL957, where the metallicity of carbon is (uniquely) very low compared to that of Zn, and N(C II*)/N(C II) is rather large.
To summarize, comparison of the tabulated observational results with the calculated properties of carbon in two-phase media shows quite unambiguously that the observed gas has a substantial contribution from cool gas at lower redshift but is very largely warm at z 2.8. Whether this shift from cool to warm gas is systematic or coincidental remains to be explored. Norman & Spaans (1997) predicted that multi-phase equilibrium, cool gas and substantial quantities of would occur in protogalactic disks only when the metallicity had increased to 0.03 - 0.1 Solar, somewhere in the interval 1 z 2.
4 The formation of molecular hydrogen
Levshakov et al. (2002) provide a summary of the molecular fractions observed toward 14 sources (their Table 2) including most of those discussed here. The lowest molecular fraction is seen toward 0000-262 at z = 3.39, the highest toward 0013-004 at z = 1.97 (see Tables 1-2 here). The latter is the only direction for which the molecular fraction exceeds 1/3000, and most are below . In this Section we address the existence of damped Lyman- systems with large hydrogen column densities, substantial amounts of cool gas, but very small fractions of molecular hydrogen. The models of -formation presented here are very similar to those of Liszt & Lucas (2000), who considered the formation of CO in local diffuse gas, given certain other conditions like the presence of HCO+, but there are a few differences which we now remark.
4.1 -formation in the gas phase
The present calculations include X-ray heating and ionization, because they are integral to the question of two-phase equilibrium. X-rays have little effect on the large neutral gas columns which harbor appreciable molecular column densities nearby in the Milky Way but are also included now because we are interested in understanding the minimum molecular fractions which can be expected, and these are presumably set by the slow gas-phase processes (not involving grains) which formed the first stars, and which occur in low-density regions of (unshielded) free space.
| Source | 1337+113 | 0528-250 | 0347-382 | 0000-262 |
|---|---|---|---|---|
| z | 2.80 | 2.81 | 3.03 | 3.39 |
| Zn/H | -1.00 | -0.91 | -1.23 | -2.07 |
| N(H I) | 8.0E20 | 2.2E21 | 2.52E20 | 2.6E21 |
| N() | 5.0E16 | 6.0E16 | 8.2E14 | 1.1E14 |
| N(C I) | 1.6E13 | 5.9E12 | 4.0E11 | |
| N(C II) | 2.0E17 | 1.7E17 | 5.1E15 | |
| N(C II*) | 3.6E14 | 1.9E13 | ||
| N(C II)m | 2.8E17 | 9.6E16 | 3.1E15 | 7.9E15 |
| C II/C I | 12658 | 28862 | 12700 | |
| C II*/C II | 0.00211 | 0.00389 |
Gas phase -formation occurs the exothermic reaction pathways H + e- H- + , H- + H + e- and H+ + H + , + H + H+. Many of the basic reactions are cited by Puy et al. (1993) and most by Haiman et al. (1996) (all can straightforwardly be located in the UMIST reaction database) but the discussion of early-universe conditions must be modified to include relevant values for the photodissociation of H- and and the cosmic-ray ionization of . For the latter we assumed per H and 1.08 per ), and for the photodissociation rate of in free space we followed Lee et al. (1996). In order to formulate a treatment of the variation of the photodissociation of H- with extinction, we integrated the cross-sections of Wishart (1979) over the local ISRF, finding an unshielded rate of s-1, just over half of which arises at wavelengths beyond 800 nm; the photo-dissociation is, therefore, not strongly attenuated under the conditions discussed here and we elected to ignore extinction in this regard (the rate quoted in the UMIST database is s-1 but we used the smaller value).
Current values of the reaction rates for all important processes are given in the UMIST reaction database, whose values we employed unless otherwise noted. Species followed during modelling of the chemistry included H I, He+, H+ and e- – all given by the calculations of two-phase equilibrium –as well as H-, and .
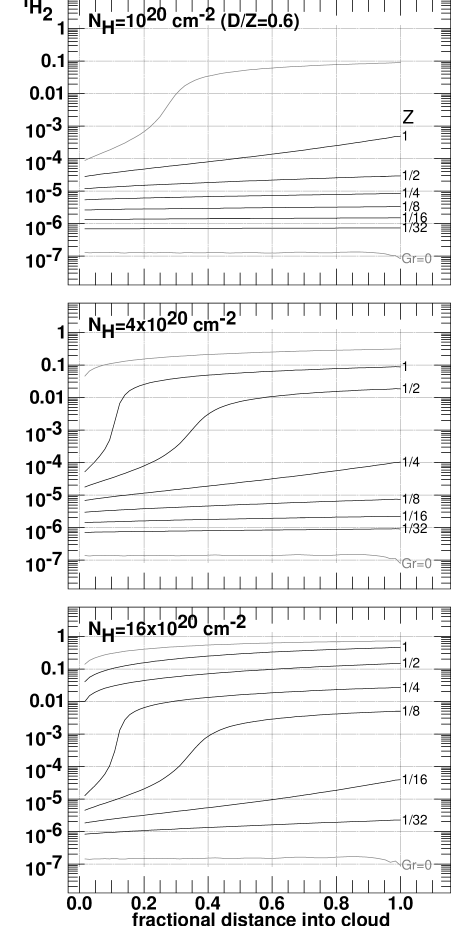
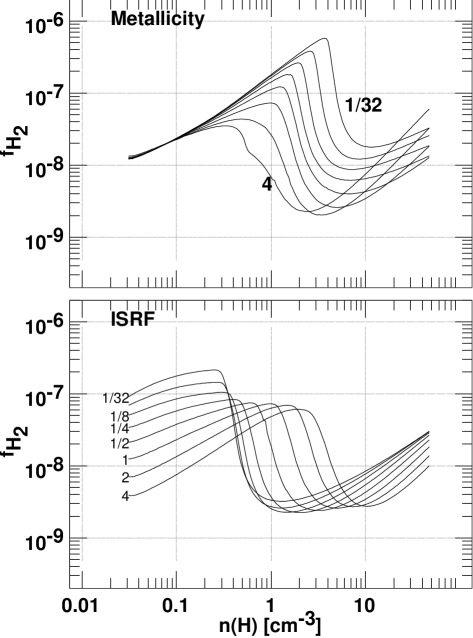
Fig. 6 shows the free-space abundance of arising solely from gas-phase processes in the two-phase models under conditions of varying metallicity and ISRF (the two left-hand panels of Fig. 1). Unlike grain formation scenarios, which take advantage of high N(H) to boost the molecular fraction at high density, free-space gas-phase formation of does not seem to distinguish between warm and cool conditions. The molecular fractions calculated in Fig. 6 correspond well with the smallest values in the local ISM, or, for that matter, in damped Lyman- systems. Unfortunately, this minimum is not diagnostic of the host gas conditions.
4.2 The abundance in cool clouds
formation in cool neutral gas clouds is illustrated in Fig 7, which indeed shows why even damped Lyman- systems with appreciable cool gas still may lack molecular hydrogen. To create this diagram, we considered (following Liszt & Lucas (2000)) a spherical clot of gas of constant density, immersed in isotropic radiation fields (X-ray, cosmic-ray, optical/uv, ). This was computationally divided up into 128 radial zones, in each of which we derived the temperature/ionization structure and abundance. The latter requires iteration, because the maintenance of is a sharply non-linear process dependent on the column and extinction between any point and free-space (Lee et al., 1996). We adopted a fairly straightforward relaxation method which converged with gratifying rapidity.
Calculation of the abundance of molecular hydrogen is typically made feasible by employing a set of shielding factors which account in an average way for the many very complicated effects of line-overlap and radiation transport in the dissociation process. We used the shielding factors of (Lee et al., 1996) which were calculated for local gas. The justification for this is that the dominant effect requiring consideration here is the order of magnitude change in the number of grains at very low metallicity, not the factor of two differences in individual grain properties between local grains and those seen, for instance in the Magellanic clouds. The parametrization of Pei (1992) for the Milky Way, LMC and SMC shows that, for a given amount of B-band extinction, the grain distribution provides successively somewhat more extinction at (say) Ly- as the metallicity declines; the inference is that graphite grains disappear and silicates do not. But this effect is dominated by the overall diminution of the extinction with lowered metallicity.
Figure 7 shows the radial variation of the fraction of H-nuclei in molecular form over spherical gas clots of constant density n(H) for different column densities N(H) through the center of the clot. The mean line of sight averaged over the circular face of such a body intersects it at an impact parameter of 2/3 of the radius (at a value 0.33 along the horizontal axis in Fig. 7), where the column density is 3/4 of that through the center.
In each panel of the Figure there are 8 vertically-separated curves. At top, shaded, is the result which would apply in the Milky Way, where we have taken the dust/metal ratio as observed locally (the reference model of the two-phase calculations) and depleted carbon and oxygen in the gas phase by a factor of 2.4. The bottom curve, also shaded, is the result when the metallicity goes to zero and only the gas-phase formation of is included; a modest amount of self-shielding occurs and the molecular fraction is slightly higher than in free space (Fig. 6). The intermediate curves assume a dust/gas ratio 0.6 relative to the reference model for the Milky Way following Vladilo (1998) (a small effect at higher N(H) but of real importance to the thinnest model) and no depletion of carbon and oxygen. These curves are labelled by their varying metallicity as in the previous diagrams.
The cloud with N(H) = would be a compact (4 pc), cool (130 K) Spitzer (1978) “standard” cloud in the Solar neighborhood. It would also be very substantially molecular if found in the Solar vicinity, but a factor 4 decline in the metallicity suffices to reduce the molecular fraction by some four orders of magnitude. Even the model having a four times higher column density (compare with the entries in Tables 1-2) cannot sustain an appreciable molecular fraction when the metallicity is reduced by a factor 10, which is hardly extreme for one of the damped Lyman- systems.
4.3 The role of geometry
The role of geometry can also be inferred from Fig. 7. At any given metallicity, a cloud with lower N(H) produces much less than one-fourth as much as that illustrated in the next-lower panel. This is another reason why the molecular fraction may vary widely between two lines of sight with similar N(H), N(C II)/N(C I), and/or metallicity (for example). Molecular hydrogen will readily populate a region when the circumstances are propitious, but can easily be prevented from forming by the vagaries of local source structure.
4.4 PKS0528-250
This source (Table 2) has an overall molecular fraction despite the lack of evidence (in carbon) for any appreciable amounts of cool gas; earlier we asserted that (very roughly) no more than a few percent of the gas could be cool. Carilli et al. (1996b) did not detect 21cm H I absorption, placing a upper limit N(H I) . So, the molecule-bearing gas must be cool, occupying roughly 1% of the total gas column for K. In the context of our models the gas must also be fairly dense, n(H) , occurring over only a very small fraction of the path length (1 kpc or more ) occupied by the gas as a whole.
5 Summary
The thermodynamics of the ISM near the Sun are strongly influenced by the disposition of carbon, in grains and in the gas. Spectroscopy of neutral and ionized carbon affords the opportunity to probe the processes which are most basic to the structure of the gaseous medium, nearby and in damped Lyman- systems. For whatever reason, the very distant gas is easily understood in the same terms as that seen nearby. Here, we have shown that one seemingly disparate aspect of high-z systems, their small fractions of molecular gas, can also be easily understood. Even when cool gas is present, which must be the case for the systems discussed here at z 2.3, abundances of are suppressed by many orders of magnitude at lower metallicity as a result of the sharply non-linear nature of the processes required to maintain substantial columns of . No wholesale reorganization of the gaseous medium need be hypothesized to account for low abundances. Conversely, we showed that the slow gas-phase processes which formed in the early Universe provide for a minimum molecular fraction in the range .
Acknowledgements.
The National Radio Astronomy Observatory is operated by AUI, Inc. under a cooperative agreement with the US National Science Foundation. The referee, Mark Wolfire, is thanked for helpful comments.References
- Bakes & Tielens (1994) Bakes, E. L. O. & Tielens, A. G. G. M. 1994, ApJ, 427, 822
- Balucinska-Church & McCammon (1992) Balucinska-Church, M. & McCammon, D. 1992, ApJ, 400, 699
- Bennett et al. (1994) Bennett, C. L., Fixsen, D. J., Hinshaw, G., Mather, J. C., Moseley, S. H., Wright, E. L., Eplee, R. E., J., Gales, J., Hewagama, T., Isaacman, R. B., Shafer, R. A., & Turpie, K. 1994, ApJ, 434, 587
- Black et al. (1987) Black, J. H., Chaffee, F. H., & Foltz, C. B. 1987, ApJ, 317, 442
- Boisse et al. (1998) Boisse, P., Le Brun, V., Bergeron, J., & Deharveng, J. 1998, A&A, 333, 841
- Carilli et al. (1996a) Carilli, C. L., Lane, W., de Bruyn, A. G., Braun, R., & Miley, G. K. 1996a, Astron. J., 111, 1830
- Carilli et al. (1996b) —. 1996b, Astron. J., 111, 1830
- Carilli et al. (1996c) —. 1996c, Astron. J., 112, 1317
- Chaffee et al. (1988) Chaffee, F. H., Foltz, C. B., & Black, J. H. 1988, ApJ, 335, 584
- Chengalur & Kanekar (2000) Chengalur, J. N. & Kanekar, N. 2000, Mon. Not. R. Astron. Soc., 318, 303
- Fall & Pei (1993) Fall, S. M. & Pei, Y. C. 1993, ApJ, 402, 479
- Garmire et al. (1992) Garmire, G. P., Nousek, J. A., Apparao, K. M. V., Burrows, D. N., Fink, R. L., & Kraft, R. P. 1992, ApJ, 399, 694
- Ge et al. (1997) Ge, J., Bechtold, J., & Black, J. H. 1997, ApJ, 474, 67
- Ge et al. (2001) Ge, J., Bechtold, J., & Kulkarni, V. P. 2001, ApJ, 547, L1
- Goldreich & Kwan (1974) Goldreich, P. & Kwan, J. 1974, ApJ, 189, 441
- Haehnelt et al. (1998) Haehnelt, M. G., Steinmetz, M., & Rauch, M. 1998, ApJ, 495, 647
- Haiman et al. (1996) Haiman, Z., Rees, M. J., & Loeb, A. 1996, ApJ, 467, 522
- Hennebelle (2000) Hennebelle, P. 2000, Ph.D. Thesis, Université Paris 7
- Izotov et al. (2001) Izotov, Y. I., Schaerer, D., & Charbonnel, C. 2001, ApJ, 549, 878
- Jenkins et al. (1983) Jenkins, E. B., Jura, M., & Loewenstein, M. 1983, ApJ, 270, 88
- Kanekar & Chengalur (2001) Kanekar, N. & Chengalur, J. N. 2001, A&A, 369, 42
- Kritsuk & Norman (2002) Kritsuk, A. G. & Norman, M. L. 2002, ApJ, 569, L127
- Lane et al. (2000) Lane, W. M., Briggs, F. H., & Smette, A. 2000, ApJ, 532, 146
- Lanzetta et al. (1989) Lanzetta, K. M., Wolfe, A. M., & Turnshek, D. A. 1989, ApJ, 344, 277
- Ledoux et al. (1998) Ledoux, C., Petitjean, P., Bergeron, J., Wampler, E. J., & Srianand, R. 1998, A&A, 337, 51
- Lee et al. (1996) Lee, H. H., Herbst, E., Pineau Des Forets, G., Roueff, E., & Le Bourlot, J. 1996, A&A, 311, 690
- Levshakov et al. (2002) Levshakov, S. A., Dessauges-Zavadsky, M., D’Odorico, S., & Molaro, P. 2002, ApJ, 565, 696
- Levshakov et al. (2000) Levshakov, S. A., Molaro, P., Centurión, M., D’Odorico, S., Bonifacio, P., & Vladilo, G. 2000, A&A, 361, 803
- Liszt (2001) Liszt, H. 2001, A&A, 371, 698
- Liszt & Lucas (1996) Liszt, H. S. & Lucas, R. 1996, A&A, 314, 917
- Liszt & Lucas (2000) —. 2000, A&A, 355, 333
- Lucas & Liszt (1996) Lucas, R. & Liszt, H. S. 1996, A&A, 307, 237
- McDonald & Miralda-Escudé (1999) McDonald, P. & Miralda-Escudé, J. 1999, ApJ, 519, 486
- Molaro et al. (2002) Molaro, P., Levshakov, S. A., Dessauges-Zavadsky, M., & D’Odorico, S. 2002, A&A, 381, L64
- Morton (1975) Morton, D. C. 1975, ApJ, 197, 85
- Neufeld (1991) Neufeld, D. A. 1991, ApJ, 370, L85
- Norman & Spaans (1997) Norman, C. A. & Spaans, M. 1997, ApJ, 480, 145
- Pei (1992) Pei, Y. C. 1992, ApJ, 395, 130
- Pei et al. (1991) Pei, Y. C., Fall, S. M., & Bechtold, J. 1991, ApJ, 378, 6
- Petitjean et al. (2000) Petitjean, P., Srianand, R., & Ledoux, C. 2000, A&A, 364, L26
- Pettini et al. (1994) Pettini, M., Smith, L. J., Hunstead, R. W., & King, D. L. 1994, ApJ, 426, 79
- Prochaska & Wolfe (1997) Prochaska, J. X. & Wolfe, A. M. 1997, ApJ, 487, 73
- Prochaska & Wolfe (1998) —. 1998, ApJ, 507, 113
- Prochaska & Wolfe (1999) —. 1999, Astrophys. J., Suppl. Ser., 121, 369
- Puy et al. (1993) Puy, D., Alecian, G., Le Bourlot, J., Leorat, J., & Pineau Des Forets, G. 1993, A&A, 267, 337
- Roth & Bauer (1999) Roth, K. C. & Bauer, J. M. 1999, ApJ, 515, L57
- Roth & Meyer (1992) Roth, K. C. & Meyer, D. M. 1992, BAAS, 24, 806
- Spitzer (1978) Spitzer, L. 1978, Physical processes in the interstellar medium (New York Wiley-Interscience, 1978. 333 p.)
- Spitzer & Scott (1969) Spitzer, L. J. & Scott, E. H. 1969, Astrophysics, 158, 161
- Srianand & Petitjean (1998) Srianand, R. & Petitjean, P. 1998, A&A, 335, 33
- Srianand et al. (2000) Srianand, R., Petitjean, P., & Ledoux, C. 2000, Nature, 408, 931
- Steidel et al. (1995) Steidel, C. C., Bowen, D. V., Blades, J. C., & Dickenson, M. 1995, ApJ, 440, L45
- Taylor & Cordes (1993) Taylor, J. H. & Cordes, J. M. 1993, ApJ, 411, 674
- Vladilo (1998) Vladilo, G. 1998, ApJ, 493, 583
- Vladilo et al. (2000) Vladilo, G., Bonifacio, P., Centurión, M., & Molaro, P. 2000, ApJ, 543, 24
- Vladilo et al. (2001) Vladilo, G., Centurión, M., Bonifacio, P., & Howk, J. C. 2001, ApJ, 557, 1007
- Wishart (1979) Wishart, A. W. 1979, Mon. Not. R. Astron. Soc., 187, 59P
- Wolfe & Davis (1979) Wolfe, A. M. & Davis, M. M. 1979, Astron. J., 84, 699
- Wolfe & Prochaska (2000a) Wolfe, A. M. & Prochaska, J. X. 2000a, ApJ, 545, 591
- Wolfe & Prochaska (2000b) —. 2000b, ApJ, 545, 603
- Wolfire et al. (1995a) Wolfire, M. G., Hollenbach, D., McKee, C. F., Tielens, A. G. G. M., & Bakes, E. L. O. 1995a, ApJ, 443, 152
- Wolfire et al. (1995b) Wolfire, M. G., McKee, C. F., Hollenbach, D., & Tielens, A. G. G. M. 1995b, ApJ, 453, 673+