Chandra Survey of Radio-quiet, High-redshift Quasars
Abstract
We observed 17 optically-selected, radio-quiet high-redshift quasars with the Chandra Observatory ACIS, and detected 16 of them. The quasars have redshift between 3.70 and 6.28 and include the highest redshift quasars known. When compared to low-redshift quasars observed with ROSAT, these high redshift quasars are significantly more X-ray quiet. We also find that the X-ray spectral index of the high redshift objects is flatter than the average at lower redshift. These trends confirm the predictions of models where the accretion flow is described by a cold, optically-thick accretion disk surrounded by a hot, optically thin corona, provided the viscosity parameter 0.02. The high redshift quasars have supermassive black holes with masses M⊙, and are accreting material at 0.1 the Eddington limit. We detect 10 X-ray photons from the quasar SDS 1030+0524, which may have a Gunn-Peterson trough and be near the redshift of reionization of the intergalactic medium. The X-ray data place an upper limit on the optical depth of the intergalactic medium , compared to the lower limit from the spectrum of Ly and Ly, which implies .
1 Introduction
Rapid growth in the number of quasars discovered with has taken place in the last few years (Warren et al. 1987; Schneider, Schmidt & Gunn 1989; Kennefick et al. 1995ab; Hook, McMahon, Irwin, & Hazard 1996; Storrie-Lombardi, McMahon, Irwin & Hazard 1996; Hook & McMahon 1998; Fan et al. 2000, 2001ab; Becker et al. 2001; Schneider et al. 2002). We are thus now able to probe the quasar phenomenon in a new regime of high luminosity and youth that is important for understanding the structure of quasars and their evolution. At the present time, there are about 130 QSOs identified at (NED 2002), but X-ray data for these sources remain sparse, especially for the radio-quiet majority (Bechtold et al. 1994; Pickering, Impey & Foltz 1994; Henry et al. 1994; Mathur & Elvis 1995; Siebert et al. 1996; Fabian et al. 1997; Zickgraf et al. 1997; Siebert & Brinkman 1998; Schneider et al. 1998; Wu, Bade & Beckmann 1999; Kaspi et al. 2000; Brandt et al. 2001; Vignali et al. 2001). The X-ray continuum in active nuclei is thought to arise in a Comptonized wind or corona associated with the inner accretion disk around a super-massive black hole (Haardt & Maraschi 1993; Czerny & Elvis 1987). Additional components of the X-ray emission are also commonly seen in high signal to noise spectra at low redshift, including X-rays associated with beamed synchrotron plasma; Compton reflected emission; line emission in Fe K; weak absorption from warm ionized material; and strong absorption from cold material (see George et al. 2000, Reeves & Turner 2000 and references therein). Whether or not there is evolution in the structure of quasars with redshift can in principle be learned from X-ray spectroscopy of high redshift quasars.
We report here a survey with the Chandra X-ray Observatory, of optically selected, radio-quiet high redshift quasars. This project is part of our long-term program to characterize the multi-wavelength emission from quasars as a function of redshift (Bechtold et al. 1994 ab, Kuhn et al. 2001). The statistical properties of the ensemble population of quasars evolve strongly with redshift: the break point, L∗, of the luminosity function shifts to higher luminosities by a factor of 50 between z=0 and z=2 (Boyle, Fong, Shanks & Peterson 1987). We hope to understand this evolution in terms of a physical model for the evolution of individual objects: does this evolution reflect slow changes in a few rare objects, or a short-lived phase that most galaxies go through? Are there differences in the spectral evolution of radio-loud and radio-quiet quasars? Can these be used to understand the origin of the radio emission? The X-ray photons, whose production is closely linked to processes in the central engine, should provide direct clues to the physical conditions in the central few parsecs, where most of the quasar energy is produced, and will therefore help answer these questions. With the recent suggestion that reionization of the intergalactic medium happened at (Becker et al. 2001), it is possible that is the epoch when the first quasars were born. Thus, the quasars targeted in our survey are among the first objects formed in the Universe.
High redshift quasars are rare, and require pointed observations at known objects for study; our expectation is that XMM and Chandra serendipitous surveys will not cover sufficient area on the sky to find many of them. The increase in sensitivity provided by Chandra and XMM however make it possible to increase significantly the number of quasars with X-ray data with only a relatively modest investment of telescope time per object.
We chose targets from samples of high redshift quasars, based on their optical luminosity. The quasars were found in optical surveys, including the APM multicolor survey (Williger et al. 1994; Storrie-Lombardi et al. 1994, 1996), the Second Palomar Observatory Sky Survey (Smith et al. 1994; Kennefick et al. 1995ab), and the Sloan Digital Sky Survey (Fan et al. 1999, 2000; Becker et al. 2001). Subsequent observations with FIRST and NVSS confirm that are all but one are radio quiet (Stern et al. 2000; Fan et al. 2001b; NED 2002). Since these quasars are unusually bright, they have been the subject of other studies, including high quality optical spectrosopy to study the emission lines (Constantin et al. 2001) and absorption lines (Storrie-Lombardi et al. 2001; Peroux, Storrie-Lombardi & McMahon 2001).
We calculated observing times required to detect the quasars in X-rays with 100 photons, if the quasar had the average optical to X-ray flux ratio seen at lower redshift, so that we would be assured of a detection (9-10 photons) if the quasar were more X-ray weak. In fact, we detected all but one quasar in the sample. Observations of three quasars were taken from the public archive, to extend our sample to .
2 Observations and Analysis
Seventeen quasars were observed with the Chandra X-ray Observatory and Advanced CCD Imaging Spectrometer (ACIS-S, Garmire et al., in preparation; Weisskopf & O’Dell 1997). All the observations were taken with the quasar on the ACIS-S3 CCD, and reduced with the standard pipe-line reduction software, and CIAO (2002; version 2.2). Initially, we pointed off-axis to mitigate pile-up in anticipation of high count rates, but later moved the quasar position on axis. Pile-up is negligible for all observations in our survey.
The observations are summarized in Table 1. We list the exposure times, observation times and net counts detected. For every object except PSS 1435+3057, we detected a significant X-ray source within 1 arcsec of the optical position, so there is no doubt to the identification.
For PSS 1435+3057, we give a 3 upper limit to the X-ray photons at the optical position. There is a weak source (11 photons) located 3.8 arcsec from the optical position. This source is beyond the range of aspect errors (Aldcroft 2002), but may be associated with an extended structure from the quasar (c.f. Schwartz 2002).
In Table 2, we list X-ray flux rates and other X-ray parameters. Although the number of photons detected is small, we were able to derive meaningful spectral fits. We used Sherpa (CIAO 2002, version 2.2) to fit power law parameters to the counts, including absorption by the Milky Way column density of neutral hydrogen fixed at the value inferred from 21-cm maps (COLDEN 2002, which is based on Dickey & Lockman 1990). We fit a function of the standard form
| (1) |
where is the energy index and fo is the normalization at 1 keV, with units of photons keV-1 cm-2 s-1. We restricted our fits to the range 0.3-6.5 keV, where the calibration is reliable at the present time, and the Chandra background is the lowest. The source extraction region for each quasar was a circle with 10 pixels (4.92 arcsec) radius. There were no background flares during the observations.
The choice of cosmology is important when converting fluxes to luminosities. The absolute B magnitude, , is related to apparent magnitude, , by
| (2) |
where
| (3) |
where c is the speed of light and Ho is the Hubble constant.
In general (Peacock 1999, his equation 3.39), for a flat Universe,
| (4) |
For and =0, we have
| (5) |
which simplifies to
| (6) |
for (see also Carroll, Press & Turner 1992).
The quasar luminosity function is usually reported assuming , Ho= 50 , =0, while observers often adopt and Ho = 70 and =0. The best” fit to cosmic microwave background data, Type Ia SNe light curves, and large scale structure models suggest that = 0.7, =0.3, and Ho= 70 km s-1 Mpc-1. We refer to this choice of cosmological parameters as CDM” in calculations below. Note that the integral of equation (4) must be evaluated numerically. Below we report luminosities for each of these three cosmologies.
3 The Evolution of for Radio-Quiet Quasars
Following Zamorani et al. (1981) we compute a ratio of X-ray to optical flux, , where
| (7) |
and log = 17.6845 for rest-frame 2 keV and log = 15.0791 for rest frame 2500 Å.
In Table 2 we give the results. For all objects, the continuum flux at 1450 Å is available from the literature (see Table 1), usually in the form of apparent AB magnitude at 1450 Å in the rest frame of the quasar, , where
| (8) |
so that has units of . We compute at 2500 Å, which has units of , assuming the optical continuum has a power law spectral energy distribution with frequency spectral index = -0.3. We compute at 2 keV in the rest frame of the quasar from the measured flux at 1 keV in our observed frame, assuming a power law with energy index =2.2.
Figure 1 shows versus redshift, , and Figure 2 shows versus absolute B magnitude, MB. For clarity, we plot the errors on only for the quasars with . For the rest, although the number of X-ray photons detected is small and the uncertainties on correspondingly large, the division by = 2.60 makes the errors only 0.2.
For a low redshift comparison sample, we use the compilation of ROSAT all-sky survey and pointed observations for radio-quiet quasars (Yuan et al. 1998) and radio-loud quasars and blazars (Brinkman et al. 1997), supplemented with observations of other high redshift quasars from the literature (Schneider et al. 1998; Kaspi, Brandt & Schneider 2000; Brandt et al. 2001; Vignali et al. 2001). Since Yuan et al. (1998) and Brinkman et al. (1997) did not list , we computed it from the listed unbsorbed X-ray flux density (0.1-2.4keV), assuming that the spectrum is a power law, with energy index with the best fit listed by Yuan et al. (1998). For objects with no measured, we assume = 2.58 for , = 2.46 for , = 2.35 for and = 2.2 for (Yuan et al. 1998). For the optical flux, we used the absolute B-magnitude for each object listed in Veron-Cetty & Veron (2000) which includes a K-correction. We extrapolated to 2500 Å in the rest frame of the quasar assuming a power law with = -0.3. The data points plotted in Figure 1 and Figure 2 are available in the electronic version of this paper, and on our website.
The radio-quiet quasars are clearly more X-ray quiet than their low-redshift counterparts, even when their extreme luminosity is taken into account. Previous studies (e.g. Avni, Worrall & Morgan 1995; Brandt et al. 2001; and references therein) found that depends mostly on optical luminosity, although the correlation of luminosity and redshift in the observed samples made it difficult to sort out whether depended mostly on optical luminosity or redshift (e.g. Bechtold et al. 1994; Pickering, Impey & Foltz 1994). The Chandra sample also suffers from a strong correlation between redshift and luminosity. In Figure 1 the three Chandra quasars at are strikingly offset from the ROSAT quasars to larger , while in figure 2 they show no offset. This is likely due to the newer surveys from which they are taken which cover larger solid angle than those used to select the ROSAT high z quasars. As a result they find systematically more luminous quasars.
To quantify the result, we computed the generalized Kendall’s tau, including lower limits on for quasars not detected at high redshift (Avni 1976; Avni, Soltan, Tananbaum & Zamorani 1980; Feigelson & Nelson 1985; Avni & Tananbaum 1986; Isobe, Feigelson & Nelson 1986; Akritas & Siebert 1996). We used the IRAF program bhkmethod to search for correlations between (1) redshift and and (2) absolute B magnitude and .
We find that is anticorrelated with redshift, with Kendall’s tau = -0.38, and Z-value =8.4, so that a correlation is present at 8.4 significance. On the other hand, the probability is 0.05 that is not correlated with absolute B-magnitude (Z-value=1.9). Thus, we find that depends primarily on redshift, and weakly on luminosity.
Does this conclusion depend upon our assumptions for the X-ray spectral index, ? In figure 4, we plot versus redshift and versus luminosity, for the Yuan et al. (1998) ROSAT sample and our high redshift sample. The high redshift quasars if anything are flatter (smaller ) than their low redshift counterparts. If we had adopted a mean of 1.5 instead of 2.2, we would have increased by 0.3, making the difference between low- and high- redshift greater. Thus the assumed spectral indices cannot account for the result.
Figures 1 and 2 confirm the result seen previously that radio-loud quasars are more X-ray loud than radio quiet quasars, at all redshifts and luminosities.
Although we have emphasized how X-ray quiet the high redshift quasars are given their optical luminosity, they are still prodigious emitters of X-ray photons. In Table 3, we list the X-ray luminosity (erg s-1), in the 2 - 10 keV band, computed from the fits in Table 2. The quasars have X-ray luminosities of erg s-1.
4 Comparison with Other Studies
After submission of this paper, three papers were submitted to the Astrophysical Journal Letters about the Chandra observations of SDS 0836+0054, SDS 1306+0356 and SDS 1030+0524. These quasars were observed with director’s discretionary time and were placed in the public archive immediately. Brandt et al. (2002) and Mathur, Wilkes & Ghosh (2002) report fluxes for the three quasars and conclude, contrary to the results reported here, that the optical-to-X-ray flux ratios of these three highest redshift quasars are not significantly different from those of low redshift quasars. The different conclusion is a result of the different comparison samples used, which in both papers were smaller than the one presented here. Schwartz (2002) reported not only the core fluxes for the three quasars, but also argued that an X-ray source 23 from SDS 1306+0356 with no optical counterpart on the Palomar Sky Survey is in fact associated with the quasar. He postulates that the X-rays are Compton scattered cosmic microwave background photons from a jet structure, similar to those seen at lower redshift (Tavecchio et al. 2000; Celotti, Ghisellini & Chiaberge 2001; Siemiginowska et al. 2002). Future observations can confirm this intriguing result. In our sample, as discussed above, we see a similar source 3.8 from the optical position of PSS 1435+3057.
For the core X-ray fluxes, we measure slightly different values than those reported in the three other papers. We measure 24, 10 and 19 photons for SDS 0836+0054, SDS 1306+0356 and SDS 1030+0524, respectively. Schwartz (2002) measures 21, 6, 16 photons; Mathur, Wilkes & Ghosh (2002) measure 21, 6, 18 photons; and Brandt et al. (2002) measure 21, 6 and 17 photons. The difference lies in two factors: the energy range used (we use 0.3 - 6.5 keV, whereas the others use 0.5 - 7 keV or 0.5 - 8 keV) and the difference in circle radius used for source extraction (we use 4.9 , whereas they use 1.2 - 2.9 ). We chose the 0.3 - 6.5 keV range because it has the lowest background, and the larger circle extraction to include the point spread function at all energies. The result is a greater number of net photons for all sources, and a more reliable measure of the source properties.
5 Mean X-ray Spectrum
Figure 3 suggests that the X-ray spectral index flattens at high redshifts. This could be caused by two effects. First, as the redshift increases, the observed X-ray band samples greater and greater energies. Thus, the flattening may be caused by intrinsic flattening of the power law at high energies. Second, the quasars in our survey may have flatter intrinsic spectra at all energies, due to their high luminosities, or high redshift.
We applied Kendall’s generalized tau to investigate the dependance of on redshift and optical luminosity. We did not include objects for which a power law index had not been measured. We found that is anti-correlated with redshift (Kendall’s tau=-0.4319, Z-value = 8.46) and positively correlated with luminosity (Kendall’s tau=0.2330, Z-value = 4.57). The data suggests that depends strongly on both redshift and luminosity.
We note that at the redshifts of the quasars in our sample, the usable Chandra energy range, 0.3-6.5 keV, corresponds to relatively hard X-rays, 1.5 keV to 32 keV. Therefore, we expect absorption by intervening damped Ly systems and other intervening absorbers to be neglible, unless the absorbers are at low redshift. Since we chose the sample objects to avoid known broad-absorption line quasars (see Green et al. 2001), intrinsic absorption is also probably negligible. We discuss the special case of SDS 1030+0524 at below.
6 Implications for MBH and
A successful model for explaining the optical/ultraviolet continuum of quasars (the Big Blue Bump) involves accretion onto a supermassive black hole through an optically thick, physically thin disk (Shields 1978; Malkan 1983; Bechtold et al. 1987; Czerny & Elvis 1987; Sun & Malkan 1989). The emitted spectrum is then the integral of Planck spectra of different temperatures, resulting in a flat continuum, through the optical-UV. There is a near exponential falloff blueward of a cutoff energy, Eco, since there is a maximum temperature for the accreting material, nearest the black hole. For the supermassive black holes in quasars accreting near the Eddington limit, the cutoff is Eco 10-100 eV.
The spectral shape and luminosity of the accretion disk can be predicted and depends on five parameters: the black hole mass (MBH); the mass accretion rate ; the total angular momentum; the viscosity in the disk, ; and the inclination at which we observe the disk. If we make the usual assumptions that the black hole is maximally spinning (Kerr black hole; see Elvis, Risalti & Zamorani 2002), that we are observing the disk face-on, and that the viscosity =0.1, then the spectral energy distribution and luminosity depends on two parameters, MBH and .
Malkan (1990) showed that for a Kerr black hole, an analytical expression for the emitted spectrum is
| (9) |
where A and are the normalization and cutoff frequency. The cut-off energy can then be written (Wandel 2000) as
| (10) |
where is the black hole mass, in units of solar masses.
Observationally, is it also possible to relate MBH to the width of the broad emission lines, assuming the BLR gas is in Keplerian motion, and calibrating the size (and hence ionization parameter) of the gas by reverberation mapping of low-redshift AGN (Peterson & Wandel 1999; Wandel, Peterson & Malkan 1999).
Thus, with two observations – the width of H and the continuum luminosity – we can solve for the two free parameters of the model, and (Wandel & Petrosian 1988; Wandel & Boller 1998; Wandel 1999). In Figures 4 and 5 we plot the result. For comparison, we also plot the results for narrow line Seyfert 1’s (Crenshaw 1986; Stirpe 1990; Boller, Brandt & Fink 1996; Brandt, Mathur & Elvis 1997), the PG quasars (Boroson & Green 1992; Miller et al. 1992), and the LBQS quasars (Forster et al. 2001). For high redshift quasars, H is in the near-IR, and only the most luminous quasars have measurements. We use H whenever possible (Hill, Thompson & Elston 1993; Rokaki, Boisson, & Collin-Souffrin 1992; Nishihara et al. 1997; McIntosh et al. 1999). For the rest, we use the FWHM of the CIV emission line, and assume the relation given by Corbin (1991),
| (11) |
We use C IV for intermediate redshift quasars from the LBQS (Forster et al. 2001), and observations of quasars from Constantin et al. (2002). To estimate the luminosity, we used the optical luminosities computed from the magnitudes listed in Table 1, or from the Veron-Cetty & Veron (2000) catalog. For all quasars, we apply a bolometric correction of 10.
For the CDM cosmology (Figure 5) we see that the NLSy1’s have relatively low mass black-holes, PG quasars are more massive, and the high redshift quasars have very massive black holes. The typical black hole mass for the quasars is 1010 M⊙, with most objects accreting between 10 -2 and 0.8 of the Eddington mass accretion rate.
7 Accretion disk and X-ray emitting corona
We now use the X-ray measurements to further investigate the nature of the black hole and accretion in quasars. Janiuk & Czerny (2000) have presented calculations of the X-ray spectrum expected from a hot corona associated with an accretion disk. The model predicts the fraction of energy dissipated in the corona as a function of the disk radius. The coronal dissipation is assumed to be proportional to the gas pressure, and the pressure at the base of the corona is determined by the condition for the disk/corona transition. This requirement is consistent with the evaporation/condensation equilibrium condition (Rozanska & Czerny 2000) and effectively means that bremsstrahlung and Compton cooling at the base of the corona are comparable. The spectrum from the disk and the corona are computed locally, taking into account the Comptonization in the hot coronal plasma.
The observed model spectrum is integrated over the disk surface. The spectrum is parameterized by the black hole mass, accretion rate and coronal viscosity, . Here we used a code which includes tabulated amplification factors for Comptonization in the corona derived from Monte Carlo simulations (Janiuk, Czerny & Zycki 2000), instead of the analytical approach used by Janiuk & Czerny (2000). In contrast to the calculations described in the previous section, we assume a Schwarzschild, not Kerr black hole. We calculate model spectra assuming the disk is face-on. Based on low luminosity accretion models (ADAFs, Kurpiewski & Jaroszynski 2000, 1999) we expect that the X-ray spectra will be harder for the maximally rotating black hole. Kerr geometry should be considered in the future models to quatify the effects.
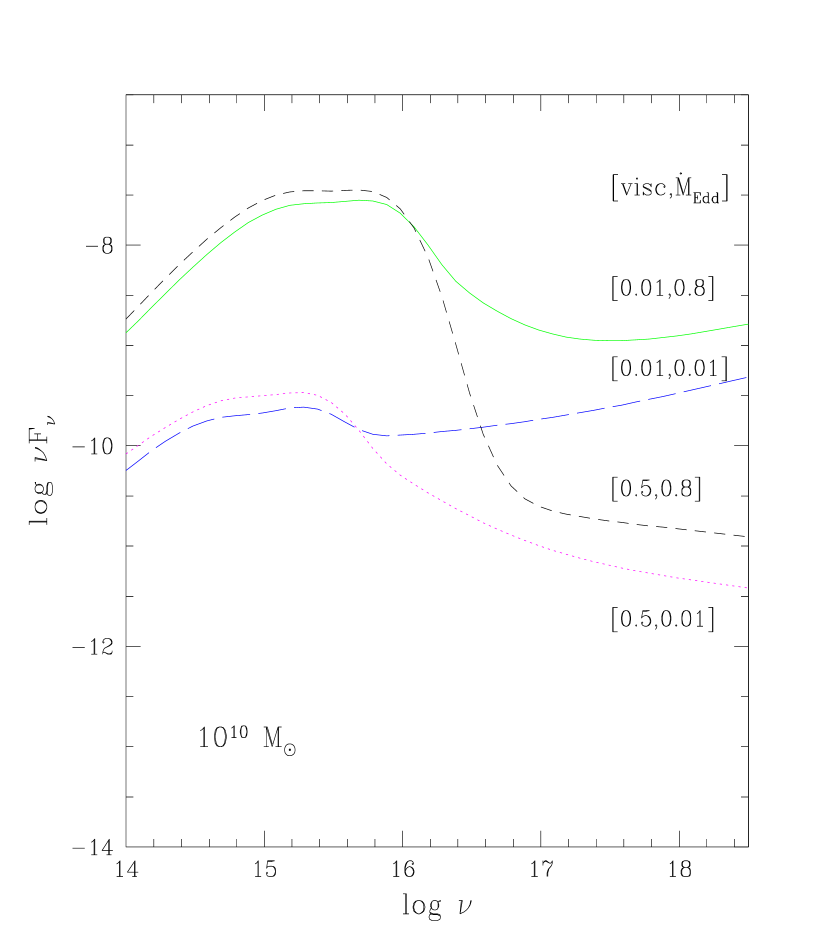
We defer a detailed comparison of the new data with the models to a future paper, and here present only the general trends. In Figure 6 we plot representative spectral energy distributions in order to illustrate the dependence on parameters. We plot models with the black hole mass fixed at and different viscosities and accretion rates. We see that the X-ray spectral index is only a weak function of the parameters, but that the optical/UV luminosity and are strong functions of the viscosity, , and accretion rate. We use the standard viscosity prescription (Shakura & Sunyaev 1973) which describes the efficiency of angular momentum transfer in the disk.
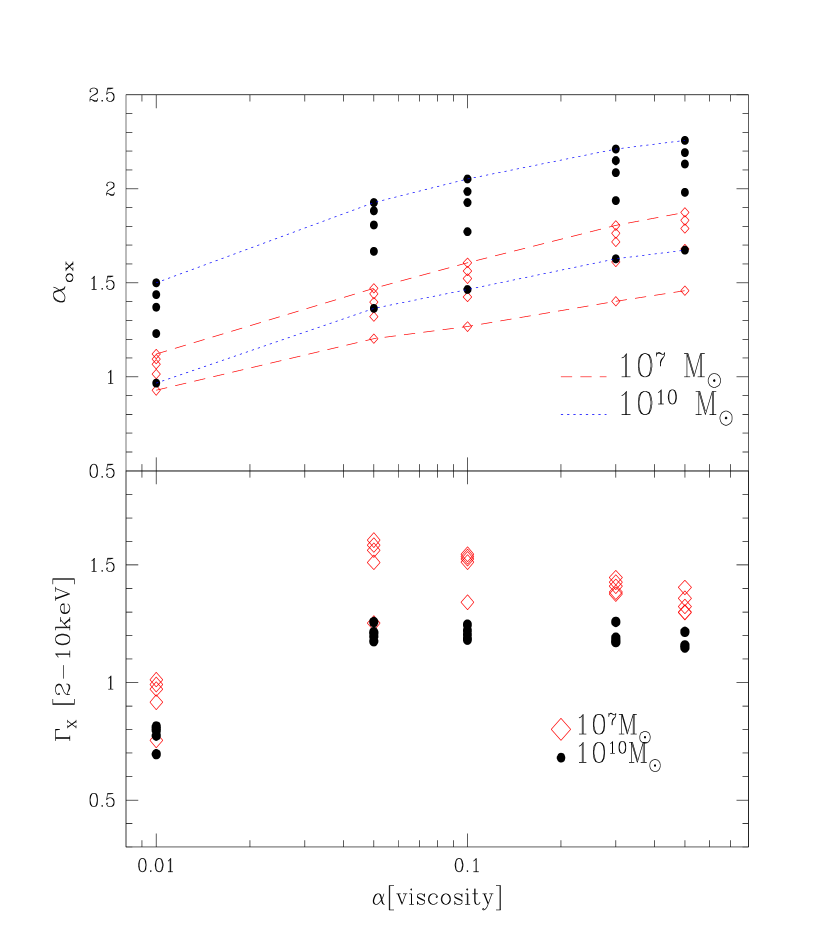
Figure 7 shows how and depend on parameters. We plot the results for models with black hole mass and and accretion rates of 0.01 and 0.8 Eddington, which bracket the values derived for the luminous quasars in Figures 4 and 5.
In Figure 7 we see the following trends:
1. The large observed scatter in is predicted naturally by the models, for a plausible range of accretion rate.
2. If the luminous high redshift quasars have on average more massive black holes than lower redshift quasars, then they are predicted to have larger . That is, the quasars in our sample are predicted to be more X-ray quiet than the PG or LBQS quasars, in agreement with the observations.
3. For the massive black holes in the quasars in our sample, 2 implies that the viscosity parameter .
4. The predicted X-ray spectral index, , is between 1.2 and 1.6, similar to what we measure for the high redshift sample. The low redshift quasars with steeper must have an extra soft component, or more complex spectra than the simple power law fits.
The models predict the spectrum throughout the ionizing ultraviolet and soft X-rays, and therefore can be used to predict emission line properties, particularly the flux and equivalent width of C IV. The implications for the broad line region will be discussed further in a future paper.
8 Detection of SDS 1030+0524 at
SDS 1030+0524 is the highest redshift quasar discovered to date. Becker et al. (2001) present the ultraviolet spectrum which shows very strong absorption just blueward of the Ly emission line. They convincingly argue that the absorption is far stronger than what is predicted from a simple extrapolation of the Ly forest from lower redshift, so that they have detected a Gunn-Peterson trough. They conclude that the intergalactic medium (IGM) was in the process of reionization at . They derive a lower limit on the optical depth of neutral hydrogen in the intergalactic medium, from analysis of Ly and Ly, of .
With Chandra, we detect 10 photons for SDS 1030+0524 in the observed 0.3-6.5 band, which is 2.2-47.0 keV in the quasar’s rest frame. In fact all 10 photons have observed, or keV. The limits on IGM absorption are weak. We used Sherpa to fit the 10 photons with a model which had the Galactic absorption fixed, a power law with fixed , and absorption at . The column of the redshifted absorption and normalization of the flux were free parameters. Significant absorption was not detected, and we can place a 3 upper limit to the absorbing column of 7.61023 atoms cm-2 if the IGM has solar abundance, and 5.31024 atoms cm-2 if the IGM has hydrogen and helium only, at the solar ratio. In either case, the the Chandra data imply that at the Lyman limit, at redshift .
9 Discussion
We have studied the evolution of quasars from to the present day, putting together what is known about the optical continuum luminosities, broad emission line widths, and X-ray flux and spectrum. The data are consistent with a model where the optical-ultraviolet continuum arises in a cold, thin, optically thick accretion disk, and the X-rays are produced at high redshift by a Comptonized corona. At low redshift, extra components are likely making the X-ray spectrum more complex than the simple power law fits available so far for most objects.
The high redshift quasars have systematically more massive central black holes than their low-redshift counterparts, and are accreting at high rates, several tenths of the Eddington limit. Their observed relatively weak X-ray fluxes are a natural outcome of the accretion disk-coronal models, with no cold absorption necessary to suppress the X-ray emission (c.f. Brandt et al. 2001; Mathur 2001).
The Chandra observations require large values of the viscosity parameter, for the high redshift quasars. Numerical simulations show that the turbulent part of the parameter is negligible in comparison to the magnetic term arising from magnetorotational instability and should be within 0.001-0.1 (Balbus & Hawley 1998, Armitage 1998, Armitage et al 2001). Observational constraints based on AGN variability are limited (Siemiginowska & Czerny 1989), but in general they are in agreement with the theoretical predictions, although for high disk luminosities exceeds 0.1 for the PG sample of quasars (Starling et al 2002).
We conclude that even at the highest redshifts probed to date, quasars were producing prodigious ultraviolet and soft-X-ray photons, which no doubt had interesting effects on the intergalactic medium and formation of galaxies at the earliest times.
References
- Akritas & Siebert (1996) Akritas, M. G. & Siebert, J. 1996, MNRAS, 278, 919
- Aldcroft (2002) Aldcroft, T. A. 2002, http://CXC.harvard.edu/cal/ASPECT/celmon/
- Armitage (1998) Armitage, P. J. 1998, ApJ, 501, L189
- Armitage, Reynolds, & Chiang (2001) Armitage, P. J., Reynolds, C. S., & Chiang, J. 2001, ApJ, 548, 868
- Avni (1976) Avni, Y. 1976, ApJ, 210, 642
- Avni, Soltan, Tananbaum, & Zamorani (1980) Avni, Y., Soltan, A., Tananbaum, H., & Zamorani, G. 1980, ApJ, 238, 800
- Avni & Tananbaum (1982) Avni, Y. & Tananbaum, H. 1982, ApJ, 262, L17
- Balbus & Hawley (1998) Balbus, S. A. & Hawley, J. F. 1998, Reviews of Modern Physics, 70, 1
- Bechtold et al. (1987) Bechtold, J., Czerny, B., Elvis, M., Fabbiano, G., & Green, R. F. 1987, ApJ, 314, 699
- Bechtold et al. (1994) Bechtold, J. et al. 1994a, AJ, 108, 374
- Bechtold et al. (1994) Bechtold, J. et al. 1994b, AJ, 108, 759
- Becker et al. (2001) Becker, R. H. et al. 2001, AJ, 122, 2850
- Boller, Brandt, & Fink (1996) Boller, T., Brandt, W. N., & Fink, H. 1996, A&A, 305, 53
- Boroson & Green (1992) Boroson, T. A. & Green, R. F. 1992, ApJS, 80, 109
- Boyle, Fong, Shanks, & Peterson (1987) Boyle, B. J., Fong, R., Shanks, T., & Peterson, B. A. 1987, MNRAS, 227, 717
- Brandt et al. (2001) Brandt, W. N., Guainazzi, M., Kaspi, S., Fan, X., Schneider, D. P., Strauss, M. A., Clavel, J., & Gunn, J. E. 2001, AJ, 121, 591
- Brandt et al. (2002) Brandt, W. N. et al. 2002, ApJ, 569, L5.
- Brinkmann, Yuan, & Siebert (1997) Brinkmann, W., Yuan, W., & Siebert, J. 1997, A&A, 319, 413
- Carroll, Press, & Turner (1992) Carroll, S. M., Press, W. H., & Turner, E. L. 1992, ARA&A, 30, 499.
- (20) Celotti,A., Ghisellini, G. & Chiaberge, M. 2001, MNRAS,321,1
- ciao (2002) CIAO 2002, http://asc.harvard.edu/CIAO/
- colden (2002) COLDEN 2002, http://asc.harvard.edu/toolkit/colden.jsp
- Constantin et al. (2002) Constantin, A., Shields, J. C., Hamann, F., Foltz, C. B., & Chaffee, F. H. 2002, ApJ, 565, 50
- Corbin (1991) Corbin, M. R. 1991, ApJ, 371, L51
- Crenshaw (1986) Crenshaw, D. M. 1986, ApJS, 62, 821
- Czerny & Elvis (1987) Czerny, B. & Elvis, M. 1987, ApJ, 321, 305
- Dickey & Lockman (1990) Dickey, J. M. & Lockman, F. J. 1990, ARA&A, 28, 215.
- (28) Elvis, M., Risaliti, G., Zamorani, G. 2002, astro-ph/0112413.
- Fabian, Brandt, McMahon, & Hook (1997) Fabian, A. C., Brandt, W. N., McMahon, R. G., & Hook, I. M. 1997, MNRAS, 291, L5
- Fan et al. (1999) Fan, X. et al. 1999, ApJ, 526, L57
- (31) Fan, X. et al. 2000 AJ, 119, 1
- fanetal (2) Fan, X. et al. 2001a AJ, 118, 1
- Fan et al. (2001) Fan, X. et al. 2001b, AJ, 122, 2833
- Feigelson & Nelson (1985) Feigelson, E. D. & Nelson, P. I. 1985, ApJ, 293, 192
- Forster et al. (2001) Forster, K., Green, P. J., Aldcroft, T. L., Vestergaard, M., Foltz, C. B., & Hewett, P. C. 2001, ApJS, 134, 35
- George et al. (2000) George, I. M., Turner, T. J., Yaqoob, T., Netzer, H., Laor, A., Mushotzky, R. F., Nandra, K., & Takahashi, T. 2000, ApJ, 531, 52
- Green et al. (2001) Green, P. J., Aldcroft, T. L., Mathur, S., Wilkes, B. J., & Elvis, M. 2001, ApJ, 558, 109
- Haardt & Maraschi (1993) Haardt, F. & Maraschi, L. 1993, ApJ, 413, 507
- Henry et al. (1994) Henry, J. P. et al. 1994, AJ, 107, 1270
- Hewett, Foltz, & Chaffee (1995) Hewett, P. C., Foltz, C. B., & Chaffee, F. H. 1995, AJ, 109, 1498.
- Hill, Thompson, & Elston (1993) Hill, G. J., Thompson, K. L., & Elston, R. 1993, ApJ, 414, L1
- Hook, McMahon, Irwin, & Hazard (1996) Hook, I. M., McMahon, R. G., Irwin, M. J., & Hazard, C. 1996, MNRAS, 282, 1274
- Isobe, Feigelson, & Nelson (1986) Isobe, T., Feigelson, E. D., & Nelson, P. I. 1986, ApJ, 306, 490
- Janiuk & Czerny (2000) Janiuk, A. & Czerny, B. 2000, New Astronomy, 5, 7
- Janiuk, Czerny, & Życki (2000) Janiuk, A., Czerny, B., & Życki, P. T. 2000, MNRAS, 318, 180
- Kaspi, Brandt, & Schneider (2000) Kaspi, S., Brandt, W. N., & Schneider, D. P. 2000, AJ, 119, 2031
- Kennefick, J. D. et al. (1995) Kennefick, J. D. et al. 1995a, AJ, 110, 78
- a (4) Kennefick, J. D., Djorgovski, S. G., & de Carvalho, R. R. 1995b, AJ, 110, 2553
- Kuhn, Elvis, Bechtold, & Elston (2001) Kuhn, O., Elvis, M., Bechtold, J., & Elston, R. 2001, ApJS, 136, 225
- Kurpiewski & Jaroszynski (2000) Kurpiewski, A. & Jaroszynski, M. 2000, Acta Astronomica, 50, 79
- Kurpiewski & Jaroszyński (1999) Kurpiewski, A. & Jaroszyński, M. 1999, A&A, 346, 713
- Malkan (1983) Malkan, M. A. 1983, ApJ, 268, 582
- Mathur (2001) Mathur, S. 2001, AJ, 122, 1688
- Mathur & Elvis (1995) Mathur, S. & Elvis, M. 1995, AJ, 110, 1551
- Mathur, Wilkes, & Ghosh (2002) Mathur, S., Wilkes, B. J., & Ghosh, H. 2002, ApJ, 570, L5.
- McIntosh et al. (1999) McIntosh, D. H., Rieke, M. J., Rix, H.-W., Foltz, C. B., & Weymann, R. J. 1999, ApJ, 514, 40
- Miller, Rawlings, Saunders, & Eales (1992) Miller, P., Rawlings, S., Saunders, R., & Eales, S. 1992, MNRAS, 254, 93
- a (8) NED 2002, NASA/IPAC Extragalactic Database, http://nedwww.ipac.caltech.edu.
- Nishihara et al. (1997) Nishihara, E., Yamashita, T., Yoshida , M., Watanabe, E., Okumura, S., Mori, A., & Iye, M. 1997, ApJ, 488, L27
- Peacock (1999) Peacock, J. A. 1999, Cosmological physics, Cambridge, UK: Cambridge University Press
- Péroux et al. (2001) Péroux, C. ;., Storrie-Lombardi, L. J., McMahon, R. G., Irwin, M., & Hook, I. M. 2001, AJ, 121, 1799
- Pickering, Impey, & Foltz (1994) Pickering, T. E., Impey, C. D., & Foltz, C. B. 1994, AJ, 108, 1542
- Reeves & Turner (2000) Reeves, J. N. & Turner, M. J. L. 2000, MNRAS, 316, 234
- Rokaki, Boisson, & Collin-Souffrin (1992) Rokaki, E., Boisson, C., & Collin-Souffrin, S. 1992, A&A, 253, 57
- Sambruna, Eracleous, & Mushotzky (1999) Sambruna, R. M., Eracleous, M., & Mushotzky, R. F. 1999, ApJ, 526, 60
- Schmidt & Green (1983) Schmidt, M. & Green, R. F. 1983, ApJ, 269, 352.
- Schneider, Schmidt, & Gunn (1989) Schneider, D. P., Schmidt, M., & Gunn, J. E. 1989, AJ, 98, 1507
- Schneider et al. (1998) Schneider, D. P., Schmidt, M., Hasinger, G., Lehmann, I., Gunn, J. E., Giacconi, R., Trümper, J., & Zamorani, G. 1998, AJ, 115, 1230
- a (9) Schneider et al., 2002 AJ, in press, astro-ph/0110629.
- schwartz (2002) Schwartz, D. 2002, ApJ, in press, astro-ph/0202190.
- Shields (1978) Shields, G. A. 1978, Nature, 272, 706
- Siebert & Brinkmann (1998) Siebert, J. & Brinkmann, W. 1998, A&A, 333, 63
- Siebert et al. (1996) Siebert, J., Matsuoka, M., Brinkmann, W., Cappi, M., Mihara, T., & Takahashi, T. 1996, A&A, 307, 8
- Siemiginowska & Czerny (1989) Siemiginowska, A. & Czerny, B. 1989, MNRAS, 239, 289
- aneta (2002) Siemiginowska, A., Bechtold, J., Aldcroft, TL, Elvis, M., Harris, D.E., Dobrzycki, A., 2002, ApJ in press.
- a (11) Smith, J. D. et al. 1994, AJ, 108, 1147
- (77) Starling, R., Siemiginowska, A., Uttley, P. 2002, in preparation.
- Stirpe (1990) Stirpe, G. M. 1990, A&AS, 85, 1049
- a (13) Storrie-Lombardi, L. J. et al. 1994 ApJ. 427, L13
- Storrie-Lombardi, McMahon, Irwin, & Hazard (1996) Storrie-Lombardi, L. J., McMahon, R. G., Irwin, M. J., & Hazard, C. 1996, ApJ, 468, 121
- Storrie-Lombardi, Irwin, McMahon, & Hook (2001) Storrie-Lombardi, L. J., Irwin, M. J., McMahon, R. G., & Hook, I. M. 2001, MNRAS, 322, 933
- Sun & Malkan (1989) Sun, W. & Malkan, M. A. 1989, ApJ, 346, 68
- (83) Tavecchio, F., Maraschi, L., Sambruna, R. M., Urry, C. M., 2000, Ap.J., 544, L23
- Veron-Cetty & Veron (2000) Veron-Cetty, M. P. & Veron, P. 2000, VizieR Online Data Catalog, 7215, 0
- Vignali et al. (2001) Vignali, C., Brandt, W. N., Fan, X., Gunn, J. E., Kaspi, S., Schneider, D. P., & Strauss, M. A. 2001, AJ, 122, 2143
- Warren et al. (1987) Warren, S. J., Hewett, P. C., Irwin, M. J., McMahon, R. G., & Bridgeland, M. T. 1987, Nature, 325, 131
- a (15) Weisskopf, M. C. & O’Dell, S. L. 1997 Proc.SPIE Vol. 3113, p. 2-17.
- a (17) Williger, G. M. et al. 1994 ApJ, 428, 574
- Yuan, Brinkmann, Siebert, & Voges (1998) Yuan, W., Brinkmann, W., Siebert, J., & Voges, W. 1998, A&A, 330, 108
- Zamorani et al. (1981) Zamorani, G. et al. 1981, ApJ, 245, 357
- Zickgraf et al. (1997) Zickgraf, F.-J., Voges, W., Krautter, J., Thiering, I., Appenzeller, I., Mujica, R., & Serrano, A. 1997, A&A, 323, L21
| Quasar | ObsID | Exp. | RA,Dec | Net | Refn. | |||
|---|---|---|---|---|---|---|---|---|
| Date | (sec) | J2000 | Countsc | |||||
| PSS 0059+0003 | 4.178 | 19.45 | 2179 | 2682 | 00:59:22.80 | 3.20 | 12 | 1,2 |
| 18Sep2001 | +00:03:01.0 | |||||||
| BRI 0103+0032 | 4.437 | 18.84 | 2180 | 3709 | 01:06:19.20 | 3.10 | 26 | 1,2,3 |
| 18Sep2001 | +00:48:22.0 | |||||||
| SDS 0150+0041 | 3.67 | 18.35 | 2181 | 3238 | 01:50:48.80 | 2.79 | 7 | 8 |
| 31Aug2001 | +00:41:26.0 | |||||||
| BRI 0241-0146 | 4.053 | 18.45 | 875 | 7365 | 02:44:01.90 | 3.73 | 17 | 4 |
| 11Mar2000 | -01:34:03.0 | |||||||
| PSS 0248+1802 | 4.43 | 18.24 | 876 | 1731 | 02:48:54.30 | 9.72 | 19 | 1,2 |
| 27Dec1999 | +18:02:50.0 | |||||||
| BRI 0401-1711 | 4.236 | 18.84 | 2182 | 3841 | 04:03:56.60 | 2.34 | 15 | 4 |
| 3Aug2001 | -17:03:24.0 | |||||||
| SDS 0836+0054d | 5.82 | 18.8 | 3359 | 5687 | 08:36:43.85 | 4.15 | 24 | 9 |
| 29Jan2002 | +00:54:53.3 | |||||||
| SDS 1030+0524 | 6.28 | 19.7 | 3357 | 7955 | 10:30:27.10 | 3.09 | 10 | 9 |
| 29Jan2002 | +05:24:55.1 | |||||||
| BRI 1033-0327 | 4.509 | 18.84 | 877 | 3447 | 10:36:23.70 | 4.85 | 16 | 5,6 |
| 26Jan2000 | -03:43:20.0 | |||||||
| PSS 1057+4555 | 4.10 | 17.53 | 878 | 2808 | 10:57:56.40 | 1.17 | 34 | 2 |
| 14Jun2000 | +45:55:52.0 | |||||||
| SDS 1204-0021 | 5.10 | 19.05 | 2183 | 1570 | 12:04:41.70 | 2.14 | 26 | 7 |
| 2Dec2000 | -00:21:49.0 | |||||||
| SDS 1306+0356 | 5.99 | 19.6 | 3358 | 8156 | 13:06:08.26 | 2.08 | 19 | 9 |
| 29Jan2002 | +03:56:26.3 | |||||||
| PSS 1317+3531 | 4.36 | 19.55 | 879 | 2788 | 13:17:43.20 | 0.99 | 9 | 2 |
| 14Jun2000 | +35:31:31.0 | |||||||
| PSS 1435+3057 | 4.35 | 19.12 | 880 | 2811 | 14:35:23.50 | 1.21 | 1,2 | |
| 21May2000 | +30:57:23.0 | |||||||
| PSS 1443+2724 | 4.42 | 19.23 | 881 | 2170 | 14:43:31.20 | 2.33 | 10 | 1,2 |
| 12Jun2000 | +30:57:23.0 | |||||||
| SDS 1621-0042 | 3.70 | 17.41 | 2184 | 1570 | 16:21:16.90 | 7.29 | 26 | 7 |
| 5Sep2001 | -00:42:51.1 | |||||||
| BRI 2212-1626 | 3.99 | 18.65 | 2185 | 3222 | 22:15:27.20 | 2.64 | 15 | 4 |
| 16Dec2001 | -16:11:33.0 |
References. — (1) Kennefick, J. D. et al. (1995); (2)Kennefick, J. D. et al. (1995); (3)Smith,J. D., et al. (1994); (4)Storrie-Lombardi,L. J., et al. (1996); (5)Storrie-Lombardi,L. J., et al. (1994); (6)Williger, G. M., et al. (1994); (7)Fan, X., et al. (2000); (8)Fan, X., et al. (1999); (9) Becker et al. (2001).
| QSO | |||||||
|---|---|---|---|---|---|---|---|
| PSS0059+0003 | 4.178 | 0.750.41 | 3.381.25 | -31.150 | -27.137 | 1.540 | -13.17 |
| BRI0103+0032 | 4.437 | 1.780.30 | 7.231.43 | -30.803 | -26.893 | 1.501 | -13.58 |
| SDS0150+0041 | 3.67 | 0.330.47 | 1.170.44 | -31.668 | -26.697 | 1.911 | -13.26 |
| BRI0241-0146 | 4.053 | 1.330.36 | 2.560.59 | -31.287 | -26.737 | 1.749 | -13.78 |
| PSS0248+1802 | 4.43 | 1.930.37 | 14.783.48 | -30.488 | -26.653 | 1.475 | -13.38 |
| BRI0401-1711 | 4.236 | 1.280.37 | 3.601.00 | -31.121 | -26.893 | 1.625 | -13.54 |
| SDS0836+0054 | 5.82 | 1.440.30 | 4.300.93 | -30.906 | -26.877 | 1.549 | -13.57 |
| SDS1030+0524 | 6.28 | 1.360.46 | 1.210.58 | -31.422 | -27.237 | 1.609 | -13.07 |
| BRI1033-0327 | 4.509 | 2.390.42 | 5.011.29 | -30.951 | -26.964 | 1.560 | -14.14 |
| PSS1057+4555 | 4.10 | 1.800.26 | 11.471.97 | -30.631 | -26.369 | 1.638 | -13.39 |
| SDS1204-0021 | 5.10 | 1.500.38 | 2.300.61 | -31.236 | -26.977 | 1.637 | -13.89 |
| SDS1306+0356 | 5.99 | 1.320.33 | 2.150.52 | -31.194 | -27.197 | 1.537 | -13.79 |
| PSS1317+3531 | 4.36 | 2.360.57 | 2.831.01 | -31.213 | -27.177 | 1.552 | -14.36 |
| PSS1435+3057 | 4.35 | 3.0g | -31.189 | -27.005 | 1.60 | ||
| PSS1443+2724 | 4.42 | 1.500.47 | 4.471.46 | -31.009 | -27.049 | 1.522 | -13.60 |
| SDS1621-0042 | 3.70 | 1.390.30 | 18.344.02 | -30.469 | -26.321 | 1.595 | -12.91 |
| BRI2212-1626 | 3.99 | 1.270.37 | 4.321.21 | -30.724 | -26.817 | 1.634 | -13.45 |
| Quasar | a | a | a | |
|---|---|---|---|---|
| b | c | d | ||
| PSS 0059+0003 | 4.178 | 46.39 | 45.70 | 46.06 |
| BRI 0103+0032 | 4.437 | 46.07 | 45.35 | 45.71 |
| SDS 0150+0041 | 3.67 | 46.11 | 45.48 | 45.83 |
| BRI 0241-0146 | 4.053 | 45.74 | 45.06 | 45.42 |
| PSS 0248+1802 | 4.43 | 46.27 | 45.54 | 45.91 |
| BRI 0401-1711 | 4.236 | 46.04 | 45.34 | 45.70 |
| SDS 0836+0054 | 5.82 | 46.48 | 45.62 | 46.00 |
| SDS 1030+0524 | 6.28 | 47.10 | 46.19 | 46.58 |
| BRI 1033-0327 | 4.509 | 45.53 | 44.80 | 45.17 |
| PSS 1057+4555 | 4.10 | 46.14 | 45.46 | 45.82 |
| SDS 1204-0021 | 5.10 | 45.97 | 45.17 | 45.54 |
| SDS 1306+0356 | 5.99 | 46.30 | 45.43 | 45.81 |
| PSS 1317+3531 | 4.36 | 45.26 | 44.55 | 44.91 |
| PSS 1443+2724 | 4.42 | 46.04 | 45.32 | 45.69 |
| SDS 1621-0042 | 3.70 | 46.48 | 45.84 | 46.20 |
| BRI 2212-1626 | 3.99 | 46.04 | 45.37 | 45.73 |