An Optical Ultra-High-Resolution Cross-dispersed Echelle
Spectrograph with Adaptive Optics111Observations here were made
at the Starfire Optical Range 1.5 m telescope, operated by the
Directed Energy Directorate, Air Force Research Laboratory
Abstract
A prototype cross-dispersed optical echelle spectrograph of very high resolution has been designed and built at Steward Observatory and tested at the Starfire Optical Range (SOR) 1.5 m telescope. It is the first spectrograph to take advantage of diffraction-limited images provided by adaptive optics in order to achieve a potential resolving power of . The wavelength coverage in a single exposure is about 300 Å, which is approximately 100 times that of conventional spectrographs operating at comparable resolution. This was achieved by recording 60 cross-dispersed orders across the mm2 area of the CCD detector. The total efficiency of the system, including the sky and telescope transmission, spectrograph and CCD detector, is measured to be 1.3% at peak, much higher than that of other ultra-high-resolution spectrographs. Sample stellar spectra with are presented.
1 Introduction
Ever since a coudé spectrograph was built for the Mt. Wilson 100-inch telescope (Adams & Dunham, 1932), it has become clear that the main obstacle to achieving high spectral resolution is the loss of light at the entrance slit. In the traditional seeing-limited domain, the best resolution of a spectrograph is coupled to the telescope diameter (Schroeder 1987). Hence, the larger the aperture, the lower the spectral resolution for a given size of grating. This coupling limited the best spectral resolution of traditional spectrographs to for 4-m class telescopes (Suntzeff 1995). In order to obtain higher resolution, all kind of tricks such as image slicers, pupil slicers, and grating mosaics have been employed, which have resulted in very large and expensive spectrographs at the Nasmyth or Coudé foci of telescopes (e.g. Diego et al. 1995; Vogt et al. 1994; Tull et al. 1994).
Recent applications of adaptive optics (AO) in astronomy have provided promising new tools for high resolution spectroscopy. The AO system corrects the wave-front distortion caused by atmospheric turbulence and delivers diffraction-limited images at the telescope focal plane. In this AO diffraction-limited domain, the spectrograph size is decoupled from the size of the telescope aperture, because the image size decreases in proportion to telescope aperture size. Therefore, AO enables ultra-high-resolution spectroscopy with gratings of conventional size.
Ultra-high-resolution spectroscopy with under seeing-limited conditions has been used in studies of interstellar and circumstellar matter. It has revealed small-scale structures and stratification in the interstellar medium and dynamical evolution of proto-planetary disks (e.g. Lambert et al. 1990; Crawford et al. 1994a,b; 1997; Crawford 1995; Lauroesch, Meyer, & Blades 2000). However, the instruments used in these studies have very low efficiency and small wavelength coverage. For instance, the total efficiencies, including sky transmission, telescope transmission, slit loss, spectrograph efficiency and CCD quantum efficiency, of both the double-pass coudé spectrograph () at the McDonald Observatory 2.7 m telescope and the Ultra-High-Resolution Facility (UHRF) () at the Anglo-Australian Telescope (AAT) are less than 0.5%, estimated from the published data. The wavelength coverage for these ultra-high resolution spectrographs is only a few Å (Lambert et al. 1990; Hobbs & Welty 1991; Diego et al. 1995). The limitations are mainly caused by the special optics used to achieve great resolving power in these instruments, e.g. a very narrow slit and double-path optics in the McDonald coudé spectrograph and a confocal image slicer in the UHRF at the AAT. Therefore, existing ultra-high-resolution spectroscopy with seeing-limited telescopes is generally restricted to the brightest stars, and to small sections of the spectrum even with large detectors. As we will show in this paper, the diffraction-limited images produced by an AO-corrected telescope can overcome these limitations.
The advantage of using an adaptive-optics telescope for diffraction-limited spectroscopy is that high resolution can be achieved without a large loss of light at the entrance slit of the spectrograph. At visible wavelengths, the diffraction limit of the telescope (diameter to 4 m) corresponds to an image size that is typically the seeing-limited image, where is the coherence length of the atmosphere, with a typical value of cm in the V band (Beckers 1993). The very small sizes of diffraction-limited images make the design of an ultra-high-resolution spectrograph simple, without image slicers, pupil slicers, double-pass mirrors, or grating mosaics. High-resolution spectrographs can thereby gain substantially in throughput over conventional spectrographs. In addition, the smaller image widths provided by the AO system allow the cross-dispersed orders to be spaced closer together on two-dimensional photon detectors such as CCDs, allowing more orders to be observed simultaneously. The total wavelength coverage can be an order of magnitude larger than that of a conventional spectrograph.
Spectroscopy at very high resolution, to , has important applications in many areas. Provided that accurate calibration of wavelengths and stable line spread functions can be maintained over long time periods, high-resolution spectroscopy is a powerful technique for detecting the small, periodic variations in Doppler shift of nearby stars that are induced by planetary companions. High resolution (and high S/N) is extremely critical especially for measuring atomic abundances of rare elements in very metal deficienct, old halo stars, isotopic abundances in stellar atmospheres and also abundances of atoms and molecules in interstellar matter, which help to trace Galactic evolution. High resolution spectroscopy provides a radically improved understanding of the physics of stellar atmospheres, including effects of convection, line-broadening, pulsations, and magnetic fields. High resolution spectroscopy also provides an important tool for investigating the small-scale structure and turbulence of the interstellar medium, and the structures of circumstellar disks and winds. In all of these applications, sensitivity (i.e. minimization of light loss) and large wavelength coverage are crucial: these are exactly the points on which AO-spectroscopy offers important advantages. The application of AO to an efficient, ultra-high-resolution spectrograph with large wavelength coverage will extend the frontier of high-resolution astronomical spectroscopy to fainter, more highly reddened sources than have been studied in the past. This paper presents an overview of the optical design of the first ground-based, diffraction-limited, cross-dispersed echelle spectrograph. It discusses the optical performance of the prototype instrument, shows some first-light observations at the Starfire Optical Range (SOR) 1.5 m telescope, and illustrates some special aspects of using AO for spectroscopy.
2 OPTICAL DESIGN DETAILS
2.1 General Considerations
Previous observations of interstellar and circumstellar matter show that significant velocity structures exist at levels corresponding to Doppler shifts or line-widths of the order of 1 km s-1 and that many absorption line components remain unresolved down to 0.5 km s-1 (e.g. Black & van Dishoeck 1988; Welty et al. 1994). A velocity resolution of km s-1 or better is required to obtain high-fidelity stellar spectra for studies of photospheric convection and isotopic abundances, which remain to be fully explored (e.g. Dravins 1987; Sneden 1995, private communication). Hence, a resolving power of 500,000, corresponding to a velocity resolution km s-1, is an essential requirement for the ultra-high resolution spectroscopy.
The adaptive optics system at the SOR 1.5 m provides diffraction-limited images at wavelengths from 0.45 to 1.0 m (Fugate et al. 1991). Therefore, our goals were to design a cross-dispersed echelle spectrograph that takes full advantage of the sharpened images in this wavelength range, by achieving a resolving power of , while squeezing as many echelle orders as possible onto available CCDs.
When a spectrograph is operated with a diffraction-limited telescope, its spectral resolving power depends only on grating blaze angle , collimator beam size and wavelength, and is given by
| (1) |
for a Littrow arrangement. When matched to the image size , the entrance slit contains about 50% of the light from diffraction-limited images. Thus, we chose a commercially available Milton Roy R2 echelle grating with ruled area of mm2, groove number density of 23.2 grooves mm-1, and a blaze angle of to provide the main spectral dispersion. This echelle provides a diffraction-limited resolving power of , which equals 500,000 at I band, 600,000 at R band and 800,000 at V band. At the same time, it provides a large number of relatively short echelle orders at visible wavelengths. For example, spectra from 1.0 m to 0.47 m are covered by 87 high echelle orders numbered , from to .
Cross dispersion of these echelle orders can be made by a grating or prism. In order to have uniform order-to-order separations, and high efficiency for the broad AO corrected wavelengths, and also to make the spectrograph system more compact, a BK7 prism with 8 apex angle was used in a double-pass configuration as the cross-disperser.
A Loral back-illuminated anti-reflection (AR) coated CCD with 15 m square pixels was envisioned for the initial tests at the SOR 1.5 m telescope (cf. Lesser 1994). It was proposed that 3 pixels (physical size of 45 m) should sample the diffraction-limited resolution element at 0.8 m so that a camera of effective focal length m was required. This focal length was derived from the grating dispersive power of and the size of the resolution element, , on the detector:
| (2) |
The resulting focal ratio of the spectrograph is .
The predicted spectral format for the spectrograph is shown in Figure 1. The central box is the physical size of the Loral CCD ( mm2), which can cover about 90 echelle orders, corresponding to a wavelength range from 0.45 to 1 m, with a spectral coverage of 8 Å per order. Separations between neighboring orders are expected to be larger than 240 m (16 pixels) for all the echelle orders. The full width at half maxium (FWHM) of each order cross section is about 2 pixels. The 77th echelle order has the longest free wavelength range of 320 mm at 1 m, which needs 11 continuous settings of the CCD to cover the whole order. The echelle order has the shortest free wavelength range of 140 mm at 0.45 m. The physical extent of the free wavelength range of the grating order on the image plane was derived from
| (3) |
where is the central wavelength of order , is the echelle diffraction angle at the order center, is an out-of-plane tilt and is the grating constant.
2.2 Spectrograph Optical Layout
The main part of the spectrograph layout at the coudé room of the SOR 1.5 m telescope is shown in Figure 2. A 254 mm diameter folding flat was used to reduce the overall length of the spectrograph so that it could be enclosed within the covered coudé optics bench. A 254 mm diameter off-axis paraboloid with a focal length of 6 m was used as the collimator and camera mirrors. The paraboloid center is offset 157 mm from the axis to leave enough room for the entrance slit assembly and the grating-prism box. The R2 echelle grating is illuminated in the quasi-Littrow mode in which an out-of-plane tilt of was introduced so that a folding mirror of mm2 could be easily placed in the output beam to put the object spectra onto the CCD. This out-of-plane tilt makes the central wavelength of different echelle orders slightly shift ( 0.1Å), and it also causes spectrum lines to be curved (Schroeder 1987). The slope of the curved spectrum lines, , and the radius of curvature of the spectrum, m. These effects are so tiny that they can be easily handled in the data reduction. No measurable degradation in spectral resolution has been found due to these effects.
The echelle grating is enclosed in a box for protection and cleanliness. The cross-dispersion double-pass prism also serves as the entrance window. The physical size of the prism is mm2, with 5 mm thickness at the top and 27 mm thickness at the bottom. The echelle grating is supported at three points. The lower two points are supported through a pivot, while the top supporting point is connected to a micrometer which can be precisely dialed to scan along the echelle orders by changing the incidence and diffraction beam angles. A spring connected to the back of the grating provides partial support. The weight of the echelle grating, approximately 1 kg. causes a maximal distortion of about 1 nm in its shape (Roark & Young 1975), corresponding to a 0.02 m image shift on the CCD: this is tiny compared to the pixel size of 15 m. The micrometer can move the incident and diffracted beam off the blaze angle by 1 to allow complete sampling of the free wavelength range.
Figure 3 shows spot diagrams on the image plane within a field-of-view (FOV) of mm2 for this spectrograph at different wavelengths. The RMS spot size from the spectrograph optics is much smaller than the expected resolution element of 45 m on the detector. Therefore the spectrograph resolution is mainly controlled by the diffraction-limited image size at different wavelengths.
At the SOR 1.5 m telescope, two different wavelength bands are available with AO correction: “Blue” leg and “Red” legs. The “Blue” leg covers from 0.45 to 0.7 m and the “Red” leg covers from 0.7 - 1.0 m. When photons from one band are used for scientific observations, photons from the other band are used for wavefront sensing and correction. The transmission of the telescope/AO system at the corrected AO focus for both beams is 20%. The focal ratios for both beams are . Conversion of the input beam to the spectrograph beam was accomplished by using two 2.5 cm diameter mirrors and two anti-reflection-coated achromats: both have diameters of 5 cm and focal lengths of 200 mm and 400 mm, respectively. We originally proposed to place the pupil on the grating to avoid vignetting. However, this is difficult to achieve with the SOR spectrograph setup. Nevertheless, due to the slow input beam, there is no significant vignetting whether or not the pupil is put on the grating.
The spectrograph has 11 reflecting and 10 transmissive surfaces, including the relay optics before the slit. This leads to large photon loss. Anti-reflection coating has been applied to all transmissive optics in the spectrograph. The reflection loss is thereby reduced from its original value of more than 8% to less than 2% per surface over the broad wavelength range between 0.5 to 1.0 m. All reflecting surfaces are silver-coated to improve the total reflectivity to about 98% per reflecting surface. The slit assembly was a customer-made one. Both slit width and slit height can be adjusted. The slit can be dialed to any width between 30 m and 200 m with a precision of 1 m. The slit height is usually set to 100 m to have an optimal throughput and minimal order overlapping of the cross-dispersed orders.
A reimaging optical system was built to view the reflective slit jaws. The guide camera is an Electrim frame-grabbing CCD camera with pixels. Since both the diffraction-limited images and entrance slit are relatively small, any small relative motion between them will cause large photon loss, thus object acquisition and guide system become important parts of the AO spectrograph.
Calibration lamp units were developed for calibrating the AO spectrograph. These include a thorium-argon hollow-cathode lamp and a tungsten-halogen incandescent lamp. The thorium-argon lamp provides a large number of narrow emission lines for the wavelength calibration over the entire working wavelength range, 0.5 to 1.0 m, (Palmer & Engelman 1983). The tungsten lamp provides a uniform source for flat-field correction. A fiber-optics system was carefully built to feed light beams from the calibration lamps to the spectrograph in the same way as the input telescope beam for accurate calibrations.
3 OPTICAL PERFORMANCE
The spectrograph was first tested at the SOR 1.5 m telescope in June 1995, and was later used for initial stellar spectroscopy in November 1995 (Ge et al. 1996a,b). During both runs, most data were recorded on a SOR Kodak thermo-electrically cooled CCD with 9 m square pixels, because the prepared Loral nitrogen-cooled CCD camera did not work. The readout noise of the Kodak CCD is about 12 and peak quantum efficiency (QE) is less than 50%. In addition, it generates many hot pixels in a few minute’s integration. Together, the total intrinsic noise from the CCD itself is typically about 60 for a ten-minute exposure frame, which prevented us from observing faint targets. Nevertheless, these observations demonstrate that an efficient, ultra-high-resolution spectrograph with large wavelength coverage can be built to operate with an AO telescope.
3.1 Wavelength coverage
Typical spectra obtained from the Blue and Red legs with the Kodak CCD are shown in Figures 4a,b. The Blue leg covers about 60 orders from 0.47 to 0.7 m and the Red leg covers about 30 orders from 0.7 to 1.0 m. Figures 5a,b show different orders in the spatial direction from the two legs. Cross-dispersed echelle orders are clearly separated in the Blue leg spectrum, while echelle orders are slightly overlapped in the Red leg spectrum. These order overlappings are mainly caused by the relatively large diffraction-limited image size at longer wavelengths and partially by the scattered light from the uncorrected seeing halo. The measured separations between neighboring echelle orders are about 300 m in the R and I bands and about 360 m in the V band.
Figure 6 shows an example of the reduced Vega spectra from the AO Red leg, obtained in a ten-minute exposure. The two-dimensional CCD images were reduced to one-dimensional spectra using standard IRAF routines. The typical signal-to-noise ratio for the reduced spectra is 200 per pixel. Many telluric absorption lines are well resolved and shown in the spectra. The reduced Red leg spectra cover about 200 Å in one exposure with the relatively small format Kodak CCD ( mm2). The Blue leg spectra cover about 300 Å in one exposure with the same CCD. The reduced spectra are shown in a previous publication (Ge 1998). The wavelength coverage achieved with this AO spectrograph already constitutes an improvement by a factor of 100 compared to the coverage achieved with the traditional ultra-high resolution spectrographs (Hobbs & Welty 1991; Diego et al. 1995).
3.2 Spectral resolution
Spectral resolution was measured by a HeNe laser and telluric absorption lines in stellar spectra. Figure 7 shows a reduced spectrum of a He-Ne laser with longitudinal mode spacing of 1.09 GHz taken in a 1 second exposure during the June run in 1995. Clearly, 4 separate laser modes are well resolved by this spectrograph, indicating a resolving power of about at the wavelength of 0.6328 m. This resolving power is very close to the predicted diffraction-limited value of . However, the stellar observations of Vega (V = 0.0), Bootis (V = 0.0) and Cygni (V = 1.3) in longer integrations (e.g. 10 minutes) give a much lower resolution of 250,000 as shown in Figure 8, owing to the use of a m entrance slit instead of the proposed m slit. The slit was widened to accept the dispersed stellar images that are broadened by the atmospheric differential dispersion during the stellar observations. The wider slit lowers the spectral resolving power since the photons from the uncorrected seeing halos in the AO corrected images filled the slit, unlike the perfect diffraction-limited HeNe beam (Beckers 1993; Ge et al. 1997; 1998).
The atmospheric differential dispersion provides relatively large separation among images from different wavelengths covered by our spectrograph. For example, compared to the reference wavelength of 1 m, the atmospheric dispersion at 45 elevation at SOR was in the I band, in the R band, and in the V band during the run, when the atmospheric pressure was about 610 mm Hg and the temperature was about C and the water vapor pressure was about 8 mm Hg (cf. Filippenko 1982). The atmospheric dispersion direction at the SOR 1.5 m was perpendicular to the entrance slit height direction. The relative atmospheric differential dispersion was about to for both the Blue and Red legs. The SOR 1.5-m telescope had no atmospheric dispersion corrector at the time of these observations. Therefore, it was impossible to apply a slit with a width for either of the two AO bands without dispersion correction. However, a slit is necessary to provide a resolving power of . Therefore, we compromised by opening the slit to accommodate the dispersed stellar images to , which corresponds to 100 m at the detector and which yields .
3.3 Detection efficiency
The total system detection efficiency was measured during both runs in 1995. The total efficiency of the spectrograph in the November run increased by a factor of compared to that in the June run after all transmissive optics surfaces were anti-reflection coated and all mirror surfaces were coated with protective silver. For example, the peak efficiency for most orders increased to about 0.8% from 0.3% in the June run. Figure 9 shows the total efficiency measured at different echelle orders around the peaks of their blaze functions. The overall contour of the total efficiency versus wavelength is similar to that of the SOR telescope/AO transmission*QE curve except near the edges of both wavelength bands. The difference was probably caused by the atmospheric differential dispersion of stellar images, which most severely affected the extreme wavelengths of the Blue and Red AO bands. For comparison, the total efficiency of this spectrograph is about a factor of 3 higher than that of the AAT UHRF (Diego et al. 1995). Furthermore, considering the fact that the QE of the Kodak CCD was only about half that of the proposed Loral CCD, another factor of 2 gain in the total efficiency could be achieved.
We have also measured the blaze function of each order, which shows a similar shape for all echelle orders. Figure 10 is an example of a measured grating blaze function at order . The central peak efficiency, about 62%, is approximately twice the efficiency at either end of the free wavelength range determined by . The unsymmetrical shape of the blaze function was caused by the slightly different cross-section of the echelle grating dialed to different wavelength along the dispersion order.
3.4 Spectrograph stability and scattered light performance
We have also tested the stability of the spectrograph, which is important in studies of the small line shifts in the stellar spectra that are caused by convection, or by gravitational perturbations due to companions, or by stellar activity probed via asteroseismology (e.g. Trimble 1995). This property was tested by performing a cross-correlation analysis between reduced one-dimensional spectra from two sequential observation frames with identical settings and physical conditions. Despite a 6 m focal length of the spectrograph, the shift between neighboring frames is small. For instance, the typical relative shift is about 0.17 pixel over a one-hour period, which corresponds to a characteristic Doppler velocity shift of 37 m s-1. This demonstrates good short-term stability of the spectrograph. We found the heat generated by the thermally cooled CCD and the residual turbulence inside the Coudé bench caused the image drift. Further improvement is possible by keeping the instrument temperature constant and the enclosure isolated from the rest of the Coudé environment.
For an astronomical measurement, scattered light could limit the precision of the results. A direct measure of the scattered light in the echelle spectrograph was obtained from the Per spectrum in the region of the telluric O2 A-band. The interorder background has been subtracted by the IRAF BACKGROUND program. We compare the A-band absorption lines in the Per spectrum to those of the solar-flux atlas of Kurucz et al. (1984). The solar spectrum was smoothed approximately to our resolution via the boxcar technique of IRAF. Figure 11 shows the fit of the smoothed solar telluric A-band spectrum to the Per spectrum. Uncertainties from the continuum fitting are responsible for the difference between the two non-saturated parts of the spectra. The heavily saturated parts from both spectra are indistinguishable, demonstrating that the scattered light was tiny and negligible in our spectrograph.
3.5 Observations of interstellar clouds at
During the November run, some atomic absorption lines from the diffuse clouds toward nearby bright stars were observed with the AO spectrograph, demonstrating the scientific capability of this instrument. The observed targets include Persei (V = 2.8) and Cygni (V = 1.3). The typical exposure times for Persei and Cygni is 10 min and 5 min, repectively. The typical S/N in the reduced spectra is 200 per pixel for Persei and 300 per pixel for Cygni.
Figure 12 shows the observed profiles of interstellar absorption lines of K I at Å toward these stars. Five velocity components from the interstellar clouds toward Cyg were identified at heliocentric velocities of 22.46 km s-1, 13.74 km s-1, 8.91 km s-1, 3.79 km s-1 and 0.51 km s-1, and most of these are well separated. These identifications are in harmony with the components observed by Welty et al. (1994) in the Na I D1 line profiles. For the interstellar clouds toward Per, the K I absorption lines are blended with each other. We therefore applied a profile-fitting program from the IRAF to discern the different individual interstellar clouds that contribute to the absorption line profiles. Six components at heliocentric velocities 10.29 km s-1, 12.00 km s-1, 13.17 km s-1, 14.57km s-1, 16.17 km s-1 and 17.18 km s-1, were found, which provide the best and unique fit to the line profile. These are also consistent with the Na I D1 line profile measurements of Welty et al. (1994).
The high sensitivity of our new instrument allows us to combine the K I measurements with previous results to extend the relationship between the Na I and K I abundances to lower levels of potassium than have been studied before. Figure 13 shows the relationship between Na I and K I abundance in the Milky Way diffuse clouds. At high abundances, the results are from the previous measurements of Hobbs (1976) with a high-resolution PEPSIOS spectrometer at 1 km s-1 resolution. At low abundances, the results are derived from the Na I data of Welty et al. (1994) together with our measurements of K I in the November run. The extended relation is consistent with a constant ratio of column densities ; however, the new measurements at low column densities exhibit much larger scatter than the previous data at high column densities. This scatter cannot be simply explained by a normal photonization model, which predicts the correlation between and (Hobbs 1976 and references therein). The scatter could also be caused by the inhomogeneous distribution of neutral Na and K atoms in the small diffuse clouds, where the neutral fractions of these easily ionized elements are sensitive to the local densities of electrons and of UV starlight. Where small clouds merge together to form stronger absorptions (i.e. larger diffuse clouds), the abundance inhomogeneity is averaged out to show less scatter in the larger diffuse clouds. The new results are based only on the diffuse clouds toward Cygni: future observations toward other directions are needed to confirm this result.
The observations of the narrow and weak interstellar K I lines toward Cygni have also provided another measurement of the spectrograph resolving power. The average FWHM of these absorption lines is 1.31 km s-1, while the average intrinsic Doppler -value of the same clouds observed in Na I is km s-1 (Welty et al. 1994). In the limit that the intrinsic width is due to thermal Doppler broadening, the corresponding intrinsic width expected in potassium is km s-1. The deduced resolution of the instrument is km s-1, or , in harmony with the estimate based on the profiles of telluric absorption lines in the Vega spectrum (Figure 8).
The sensitivity of high-resolution spectra to narrow, weak absorption features is also limited by the signal/noise ratio, , that can be achieved in reasonable integration times and by the shape of the instrumental response function. Despite the large number of transmissive and reflective optical elements in the spectrograph, the profiles of narrow absorption lines appear gaussian down to levels of approximately 3% of the peak absorption. This has been estimated from close examination of the profile shapes of the interstellar K I line and of nearby telluric O2 lines in the spectrum of Per. The demonstrated short-term stability of the spectrograph (§3.4) ensures that the instrumental profile can be measured and the observed spectra de-convolved in cases where the detailed shapes of far-wing profiles might be important.
The interstellar spectra also provide a good test of the sensitivity in terms of minimum measurable equivalent width of absorption features. The spectrum of Per covered the wavelengths of several other potentially interesting interstellar features. In particular, interstellar Rb I ( Å) has been sought by several previous investigators because it is an important probe of stellar nucleosynthesis and mixing. Although Jura & Smith (1981) reported the discovery of interstellar Rb I with a line of equivalent width mÅ toward Oph, subsequent observations of Oph, Per, and o Per revealed no line stronger than mÅ (3) in any of those directions (Federman et al. 1985). Our spectrum of Per at Å shows no significant absorption feature. We find an upper limit to the equivalent width of a narrow interstellar Rb I line of mÅ(3). This corresponds to per resolution element at the wavelength of interest. Our limit is very similar to that published by Federman et al. (1985), who used a larger telescope (2.7 m) at lower resolution. It is clear that the present limit could be easily improved with a more efficient detector and longer integration times.
We also searched for a few lines of the A–X (3,0) band of interstellar C2 in absorption toward Per. Two weak lines of telluric O2 are found at 7720.3 and 7721.5 Å, with equivalent widths of and 1.0 mÅ, respectively. The noise level in this part of the spectrum corresponds to a limiting equivalent width mÅ(3). No interstellar C2 lines are apparent above this level. This is not too surprising given the difficulty of detecting the (3,0) band toward any star (van Dishoeck & Black 1986) and the weakness of the lines of the stronger (2,0) band toward Per (Chaffee et al. 1980). Although no new physical information can be derived from these unsuccessful searches for Rb I and C2, the data clearly show that the first test measurements already achieved a level of sensitivity comparable to that of the best previous observations of Per.
It is also worth noting that the weak telluric O2 lines at 7700–7800 Å can provide alternative wavelength calibration. The wavelengths of carefully measured O2 lines are consistent with the calibration based on Th-Ar lamp spectra within km s-1 in Doppler velocity. In fact, the absolute wavelengths of O2 lines in this wavelength region are still uncertain at this level (Brown & Plymate 2000).
4 SPECIAL ASPECTS OF USING AO FOR SPECTROSCOPY
The benefit of combining AO with spectroscopy is that the diffraction core of the image is small both in the dispersion and spatial direction. This is what allows the entire spectrum to be recorded on a reasonable area of CCD. This benefit, which may be as much as a factor of 100 or more in recorded spectrum, must be weighed against losses, which though small compared to the benefit are nonetheless significant, and affect how an AO spectrograph is used.
The image provided by an AO telescope is not just a diffraction-limited image. There is a diffraction-limited core sitting on a broad pedestal whose size is the seeing width (Beckers 1993; Ge et al. 1997, 1998). The image is characterized by its Strehl Ratio (), the fractional decrease in the central intensity from a perfect diffraction-limited image. Maréchal approximation gives
| (4) |
where
| (5) |
is the aperture diameter of a telescope, and is the zenith distance (Beckers, 1993). A of 50% is typical for the 1.5 m telescope at 0.8 m when observing near zenith. The Strehl Ratio gets poorer as the telescope moves away from the zenith, so that for example at elevation (an airmass of 2), this Strehl Ratio would drop to about 6% at the same wavelength. For this reason the AO system is very rarely used below an elevation angle of 45 where the corresponding Strehl Ratio is 25%.
Because of partial diffraction limit of the AO corrected images, the slit width becomes more critical for the final resolution and throughput. A wide slit width corresponding to 2.44 , the diameter of the first Airy dark ring, will admit about 84% of the energy from the diffraction-limited core into the spectrograph, but it can only provide resolution of about because the broad background of the seeing halo smooths out the higher resolution provided only by diffraction. While a narrow slit width of about does provide about a factor of two higher resolution, , approximately half of the energy from the diffraction-limited core is lost due to slit diffraction and slit loss itself. Thus, the final correct balance will depend on the scientific goal: higher throughput but lower resolution versus higher resolution but lower throughput (see Ge et al. 1997 for a detailed study).
AO has so far been largely used for imaging where the Strehl Ratio has not been very critical, and where it has been possible to work with a relatively feeble core of an image, just as in the early days of the Hubble Space Telescope. Now with AO spectroscopy, the Strehl Ratio becomes very important. And the Strehl Ratio available depends both on the seeing and on the AO design. This will set a practical limit to the wavelength range of the spectrograph. Table 1 shows how the Strehl Ratio at different wavelengths is likely to change with the seeing. It is seen that the efficiency is likely to be quite low at wavelengths m, and so a practical lower limit to the usable wavelength at the AO-corrected telescope is likely to be about 0.5 m. The maximum efficiency (including 20% telescope and AO transmission, 50% slit transmission, 50% spectrograph and 90% QE CCD) of 4% for the existing SOR 1.5 m AO telescope and the AO spetrograph can be potentially reached in the I band with a 2 slit. Future improvement in the telescope and AO transmission can increase the total efficiency further.
Another aspect in which AO spectroscopy differs from traditional spectroscopy is in the effect of atmospheric dispersion. Atmospheric dispersion is independent of image size. For a conventional image, a dispersion of about is noticeable, which is not very important. Instead with AO, the dispersion becomes very important. Thus, for example, at 1 m, the diffraction FWHM at the 1.5 m telescope is . At the altitude of SOR and at elevation, the dispersion from the image position is given in Table 2. It can be seen that the observations at SOR 1.5 m telescope were skating on the edge of being impossible without correction for atmospheric dispersion. An optical device, such as a Risley prism pair, can be built to correct atmospheric dispersion for AO spectroscopy.
In conclusion, the AO spectrograph has some features that need to be factored into its performance and operation that are less than obvious. The range of elevation of sources must be reduced. In particular, the observing program needs to be tightly tailored to when stars are nearest to zenith, and objects at lower elevations should be observed when the seeing is best and the atmospheric motions are slow. Correction for atmospheric dispersion will become a crucial part of observing. Guiding needs to be done on the image at the slit, not at the telescope. Inter-order spacing needs to allow for diffraction at the longer wavelengths. Resolution and throughput of the spectrograph have to be carefully balanced by the entrance slit width.
References
- Adams & Dunham (1932) Adams, W. S., & Dunham, T. H., Jr. 1932, PASP, 44 243
- Beckers (1993) Beckers, J. M. 1993, ARA&A, 31, 13
- Black & van Dishoeck (1988) Black, J. H., & van Dishoeck, E. F. 1988, ApJ, 331, 986
- Brown & Plymate (2000) Brown, L. R., & Plymate, C. 2000, J. Molec. Spectrosc., 199, 166
- Chaffee et al. (1980) Chaffee, F. H., Jr., Lutz, B. L., Black, J. H., Vanden Bout, P. A., & Snell, R. L. 1980, ApJ, 236, 474
- Crawford et al. (1994a) Crawford, I. A., et al. 1994a, MNRAS, 266, L65
- Crawford et al. (1994b) Crawford, I.A., Barlow, M.J., Diego, F., & Spyromilio, J. 1994b, MNRAS, 266, 903
- Crawford (1995) Crawford, I. A. 1995, MNRAS, 277, 458
- Crawford et al. (1997) Crawford, I.A., Craig, N., & Welsh, B.Y. 1997, A&A, 317, 889
- Diego et al. (1995) Diego, F., et al. 1995, MNRAS, 272, 323
- Dravins (1987) Dravins, D. 1987, A&A, 172, 200
- Federman et al. (1985) Federman, S. R., Sneden, C., Schempp, W. V., & Smith, W. H. 1985, ApJ, 290, L55
- Filippenko (1982) Filippenko, A. V., 1982, PASP, 44, 715
- Fugate et al. (1991) Fugate, R. Q., et al. 1991, Nature, 353, 144
- Ge et al. (1996a) Ge, J. et al. 1996a, BAAS, 28, 905
- Ge et al. (1996b) Ge, J. et al. 1996b, in Adaptive Optics, Vol. 13, OSA Technical Digest Series (Optical Society of America, Washington, DC), 122
- Ge et al. (1997) Ge, J. et al. 1997, in Proc. SPIE, 3126, 343
- Ge (1998) Ge, J., 1998, Ph.D. Dissertation, The University of Arizona
- Ge et al. (1998) Ge, J., Angel, J.R.P., & Shelton, J.C. 1998, Proc. SPIE, 3355, 253
- Hobbs (1976) Hobbs, L. M., 1976, ApJ, 203, 143
- Hobbs & Welty (1991) Hobbs, L. M., & Welty, D. E. 1991, ApJ, 368, 426
- Jura & Smith (1981) Jura, M., & Smith, W.H. 1981, ApJ, 251, L43
- Kurucz et al. (1984) Kurucz, R. L., Furenlid, I., Brault, J., & Testerman, L., 1984, Solar Flux Atlas from 296 to 1300 nm, NSO/NOAO
- Lambert et al. (1990) Lambert, D. L., Sheffer, Y., & Crane, P. 1990, ApJ, 359, L19
- Lauroesch et al. (2000) Lauroesch, J. T., Meyer, D. M., & Blades, J. C. 2000, ApJ, 543, L43
- Lesser (1994) Lesser, M. 1994, SPIE, 2198, 782
- Palmer & Engelman (1983) Palmer, B. A., & Engelman, R. Jr. 1983, Atlas of the Thorium Spectrum, Los Alamos National Laboratory Report LA-9615
- Roark & Young (1975) Roark, R.J., & Young, W.C., 1975, in Formulas for Stress and Strain, fifth edition, McGraw-Hill Book Company, p389
- Schroeder (1987) Schroeder, D. J. 1987, Astronomical Optics, (Academic Press)
- Suntzeff (1995) Suntzeff, N. B. 1995, PASP, 107, 990
- Trimble (1995) Trimble, V. 1995, PASP, 107, 1012
- Tull (1994) Tull, R. G., 1994, Proc. SPIE, 2198, 674
- van Dishoeck & Black (1986) van Dishoeck, E. F., & Black, J. H. 1986, ApJ, 307, 332
- Vogt (1994) Vogt, S. 1994, Proc. SPIE, 2198, 362
- Welty et al. (1994) Welty, D. E., Hobbs, L. M., & Kulkarni, V. P. 1994, ApJ, 436, 152

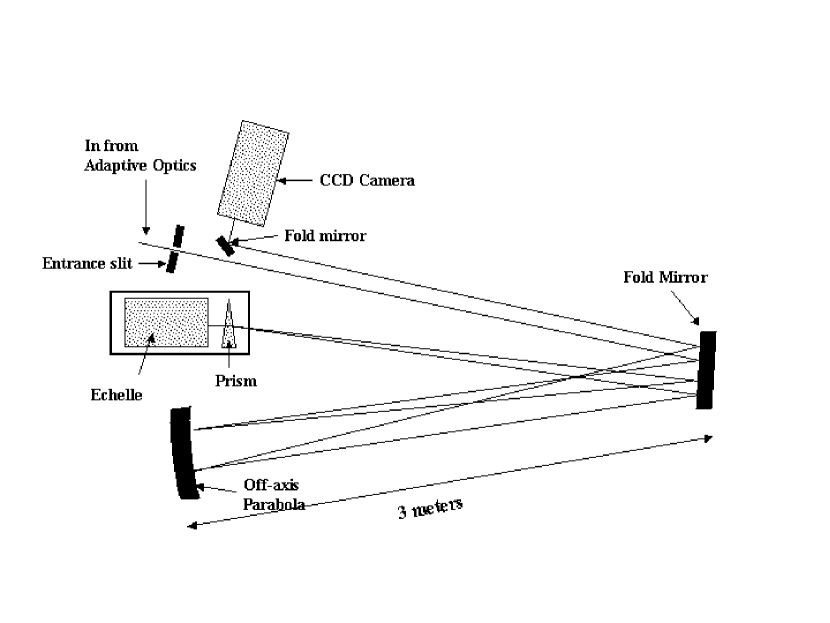
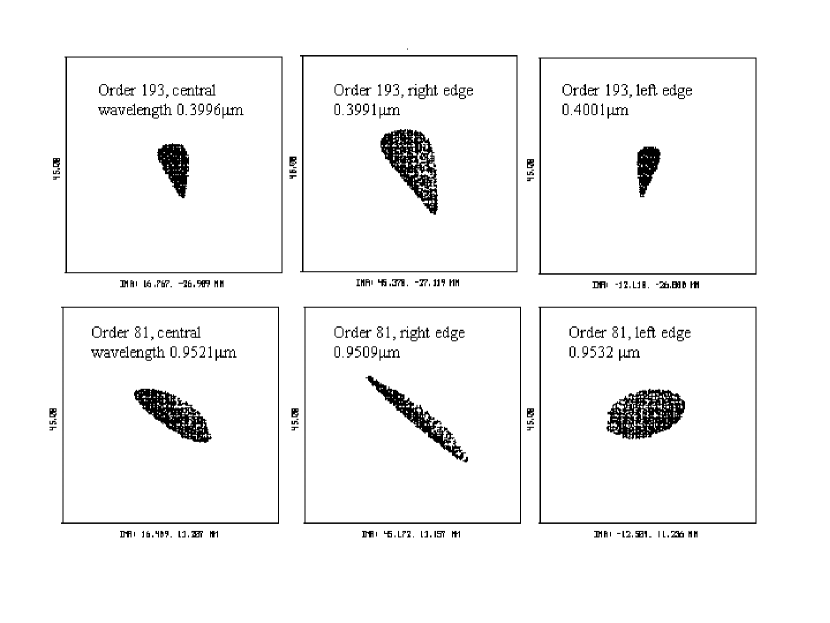
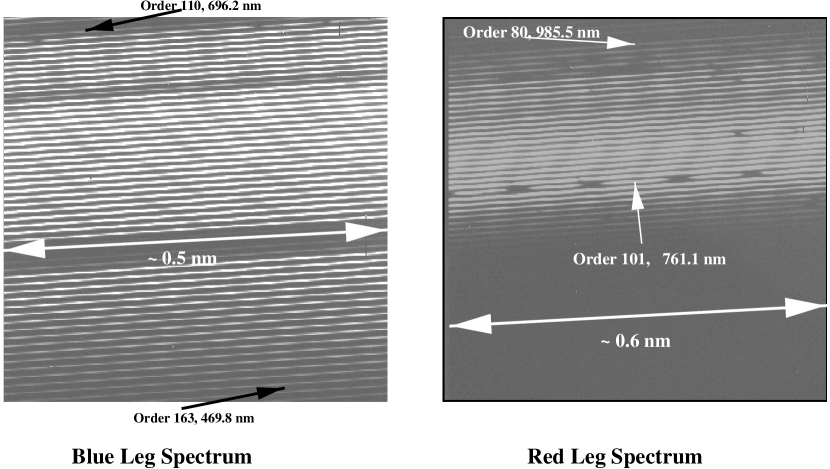


Table 1. Strehl Ratio of the AO Corrected Images vs Wavelength at the SOR 1.5 m Telescope under different atmospheric conditions at SORa
| 1.0 m | 0.84 m | 0.707 m | 0.599 | 0.500 |
|---|---|---|---|---|
| 70% | 61% | 49% | 37% | 24% |
| 61% | 49% | 37% | 24% | 14% |
| 49% | 37% | 24% | 14% | 6% |
| 37% | 24% | 14% | 6% | 2% |
a Typical atmospheric turbulence parameters at 0.55 m are cm and the Greenwood frequency 45 Hz, which corresponds to a coherence time = 3 ms (see Ge 1998 for details).
Table 2. Atmospheric Differential Dispersion at 45∘ elevation at SORa
| 1.0m | 0.90m | 0.80m | 0.75m | 0.70m | 0.65m | 0.60m | 0.55 | 0.50m | 0.45m |
|---|---|---|---|---|---|---|---|---|---|
| 0.0 | 0.06′′ | 0.15′′ | 0.21′′ | 0.27′′ | 0.36′′ | 0.48′′ | 0.62′′ | 0.82′′ | 1.09′′ |
a The calculation was based on P = 610 mm Hg, T = 10 ∘C and water vapor pressure 8 mm Hg (Filippenko 1982).