The luminosity density of red galaxies
Abstract
A complete sample of galaxies with five-band imaging and spectroscopic redshifts from the Sloan Digital Sky Survey is used to determine the fraction of the optical luminosity density of the Local Universe (redshifts ) emitted by red galaxies. The distribution in the space of rest-frame color, central surface brightness, and concentration is shown to be highly clustered and bimodal; galaxies fall primarily into one of two distinct classes. One class is red, concentrated and high in surface brightness; the other is bluer, less concentrated, and lower in central surface brightness. Elliptical and bulge-dominated galaxies preferentially belong to the red class. Even with a very restrictive definition of the red class that includes limits on color, surface brightness and concentration, the class comprises roughly one fifth of the number density of galaxies more luminous than and produces two fifths of the total cosmic galaxy luminosity density at . The natural interpretation is that a large fraction of the stellar mass density of the Local Universe is in very old stellar populations.
to appear in The Astronomical Journal
1 Introduction
The local Universe sparkles with bright blue stellar populations in disk and irregular galaxies. However, both age and dust (circumstellar or interstellar) make a population dimmer and redder, so red populations contain much more stellar mass per unit luminosity. This makes it remarkable that the most luminous (visible and near-infrared) galaxies in the Universe are red galaxies (eg, Blanton et al 2001); their dominance in luminosity represents enormous dominance in stellar mass.
The typical luminous red galaxies of the local Universe are kinematically hot (ie, not rotationally supported), have smooth radial profiles, have a narrow range of stellar mass-to-light ratios, show high -element metallicities, are (relatively) iron-poor, and reside preferentially in the Universe’s most over-dense environments (as reviewed by Kormendy & Djorgovski 1989, and Roberts & Haynes 1994). They are red because their stellar populations are old—comparable in age to the Universe itself—not because they are obscured by dust.
It is now well established that the average cosmic star formation rate per comoving volume has been declining from redshifts near unity to the present day (eg, Pei & Fall 1995, Lilly et al 1996, and many more references cited in Hogg 2001). This observed trend is strong enough that the majority of the stars in the local Universe are expected to be old ( Gyr). This appears consistent with observations of the distribution of stellar ages at the present day (eg, Fukugita et al 1998). What is not currently agreed-upon is the detailed stellar age distribution at old ages. Direct measurements of the cosmic star formation rate at very early times are hindered by selection effects and the strong influence of dust; measurements of age distributions of nearby stellar populations are confused by the asymptotic similarity of spectral energy distributions with increasing age.
In this Article we look at the luminosity density in red galaxies in the local Universe using observations from the Sloan Digital Sky Survey (SDSS). We begin by suggesting a new method for selecting red galaxies designed to avoid contamination by young galaxies reddened by dust. We find that the red galaxies contribute a large fraction of the total galaxy luminosity density of the Universe at , such a large fraction that they make up the majority of the cosmic stellar mass density.
In what follows, a cosmological world model with is adopted. The model has total age , where is the Hubble constant in units of ; makes the total age (eg, Hogg 1999).
2 The sample
2.1 Imaging and photometry
The SDSS is taking , , , and -band drift-scan imaging of the Northern Galactic Cap, and taking spectra of roughly galaxies in that region, most with in the AB system (York et al 2000). The photometric system and imaging hardware are described in detail elsewhere (Fukugita et al 1996; Gunn et al 1998; Smith, Tucker et al 2002). An automated image-processing system detects astronomical sources and measures many photometric properties (Lupton et al 2001; Stoughton et al 2002, Pier et al 2002, Lupton et al in preparation). The photometric parameters of interest for this study are as follows: the Petrosian (1976) radius is the angular radius at which the mean surface brightness of the source in the SDSS -band image inside that radius is five times higher than the mean surface brightness in a narrow annulus centered on that radius. The Petrosian fluxes (with corresponding magnitudes ) are the total fluxes in the five SDSS bandpass images within a circular aperture of radius (twice the Petrosian radius in the -band). The half-light and 90-percent radii and are the angular radii within which 50 and 90 percent of the Petrosian flux is found. All magnitudes are extiction-corrected with IRAS-based dust maps (Schlegel Finkbeiner & Davis 1998).
The median magnitude of a galaxy in our sample is , so it is detected in the imaging data at a signal-to-noise ratio ; the photometric properties of the galaxies in the sample are measured with high precision. The accuracy is limited by systematic errors at the few percent to ten percent level (Stoughton et al 2002).
2.2 Spectroscopy
SDSS “Main Sample” galaxies are chosen as spectroscopic targets on the basis of -band magnitude, angular size (to remove stars), half-light surface brightness (to ensure spectroscopic success), and some positional constraints from the finite size of the fibers in the fiber-fed multi-object spectrographs (Strauss et al 2002, Blanton et al 2002a).
The SDSS spectra are at resolution 2000 with wavelength coverage Å. Typical spectra have signal-to-noise better than 10 per resolution element at the central wavelengths. For the purpose of this study, the spectroscopic data are used only for obtaining galaxy redshifts. The SDSS spectroscopic reduction pipeline (Schlegel et al in preparation) produces a one-dimensional spectrum corresponding to each fiber. The SDSS has an official pipeline which identifies redshifts (SubbaRao et al in preparation). However, the redshifts used in the current analysis are determined independently using a separate pipeline (Schlegel et al in preparation) whose results are nearly identical (at the 99% level) for the main galaxy sample to the official SDSS pipeline (which currently performs better for objects with unusual spectra, such as certain types of stars and QSOs).
2.3 Correction to a fixed redshift frame
Galaxies observed at different redshifts are observed through bandpasses at different wavelengths in the galaxy’s rest frame. The photometric measurements have been -corrected to a fixed wavelength frame using a -correction pipeline (kcorrect version v1_3) described in detail elsewhere (Blanton et al 2002b). The method is, briefly, as follows. A linear combination of four SED templates is fit to the set of broad-band magnitudes for each galaxy. The four templates are chosen to yield good fits to the broad-band magnitudes of the entire set of galaxies in the SDSS spectroscopic sample. The fit provides a correction from the rest-frame band at the redshift of the galaxy to the rest-frame band at . Correction to the (roughly) median redshift minimizes the typical correction magnitude. The resulting fixed-frame magnitude system is denoted “, , , , ”. The effective wavelengths are roughly 3220, 4340, 5660, 6940 and 8300 Å. The zeropoints are as close to AB (Oke & Gunn 1983) as is currently possible with SDSS calibration; a hypothetical source with at all frequencies would be close to in all five bands.
2.4 Sample selection
The sample used here is a subsample (known as “sample8” within the SDSS collaboration) of spectroscopic targets selected from all SDSS imaging targeted before 2001 June 20 and spectroscopically observed before 2001 October 20. A galaxy is included in our analysis for this paper if it is a main sample galaxy (Strauss et al 2002b) satisfying the following cuts: (1) apparent magnitude (the exact faint limit is variable at the 0.2 mag level, depending on the SDSS Main Sample photometric selection in that region of sky, which has varied somewhat as the survey has progressed); (2) mean surface brightness in within the half-light radius (variable at the 0.5 mag level, depending again on SDSS Main Sample selection); (3) redshift ; and (4) fixed-frame absolute magnitude , corresponding to (Blanton et al 2001).
These cuts left a total sample of 77,461 galaxies.
After apparent magnitude, the two most important cuts in our sample are on surface-brightness and absolute magnitude. It has been demonstrated that unless the shapes of the luminosity and surface-brightness functions change dramatically at low surface-brightnesses, the surface-brightness cuts exclude at most 5 percent of the luminosity density (Blanton et al 2001). The Schechter function fit to the SDSS luminosity function (from Blanton et al 2001 but corrected to the -band) has 90 percent of the luminosity density in the range . At least 85 percent of the luminosity density of the Universe is therefore in our sample; it can be used to make reliable estimates of the fraction of the cosmic luminosity density found in galaxies of different types.
2.5 Density contributions
To compute number and luminosity densities, it is necessary to compute the number-density contribution for each galaxy, where is the volume covered by the survey in which this galaxy could have been observed, accounting for the flux, surface brightness, and redshift limits as a function of angle (Schmidt 1968). This volume is calculated as follows:
| (1) |
where is described below and and are defined by:
| (2) | |||||
| (3) |
The flux limits (equal to 14.5 mag across the survey) and (approximately 17.77 mag, but slightly variable as noted above) implicitly set by:
| (5) | |||||
The surface brightness limits (in practice, too high surface-brightness to matter for this sample) and (approximately 24.5 mag but variable in a known way across the survey) implicitly set by:
| (7) | |||||
In practice, the surface brightness limits only rarely affect the determination.
The function is the SDSS sampling fraction of galaxies as a function of position on the sky. The total sampling rate of galaxies is computed separately for each region covered by a unique set of survey tiles. The nomenclature of the 2dF (Percival et al 2001) is adopted; each such region is a “sector” (which corresponds identically an “overlap region” in Blanton et al 2001). That is, in the case of two overlapping tiles, the sampling is calculated separately in three sectors: the sector covered only by the first tile, the sector covered only by the second tile, and the sector covered by both. Each position on the sky is thereby assigned a sampling rate equal to the number of redshifts of galaxy targets obtained in the region divided by the number of galaxy targets in the region. In regions covered by a single tile, typically ; in multiple plate regions, typically . These completenesses average to 0.92.
3 Distribution in “photometric space”
In this Section, the distribution of galaxies in a measurement space made up of colors, surface brightness, and concentration of the radial profile is displayed and discussed. For the purposes of this section, the surface brightness is defined to be ( of) half of the Petrosian flux in the band, divided by , and the concentration is defined to be the ratio .
3.1 Number densities
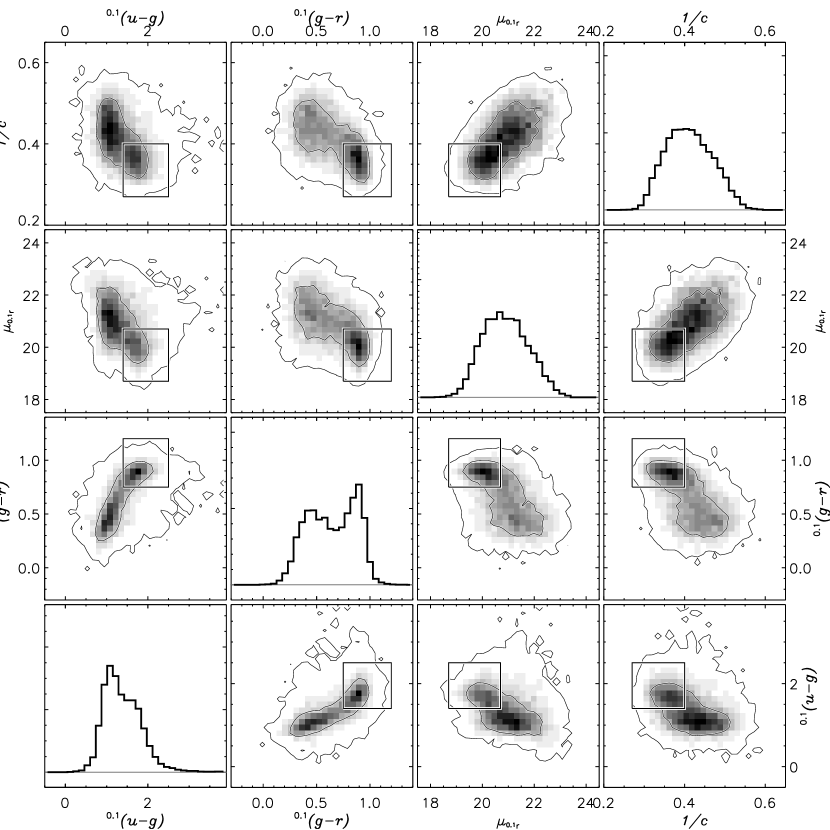
For any particular subset of galaxies chosen to have specific physical properties, the sum of the inverse selection volumes for the members of the subset is a measure of the number density of galaxies with those physical properties. Figure 1 shows projections of the number density as a function of position in the four-dimensional photometric space spanned by fixed-frame color , fixed-frame color , fixed-frame surface brightness and concentration .
There are two separated density maxima apparent in Figure 1, one corresponding to red, concentrated, high surface-brightness galaxies, and one corresponding to bluer, less concentrated, lower surface-brightness galaxies. For clarity, a four-dimensional box containing the redder peak has been superimposed on Figure 1. The box was chosen by hand to be restrictive but still encompass most of the red peak. The box is defined by the limits:
| (8) | |||||
| (9) | |||||
| (10) | |||||
| (11) |
where the colors are measured in mag and the central surface brightness is measured in units of mag in one arcsec2. We refer to the galaxies inside this four-dimensional box, ie, galaxies that simultaneously satisfy all four photometric cuts, as “red-type” galaxies. The separation of red-type and non-red-type galaxies is very similar to that shown previously to be highly correlated with galaxy morphological type (Strateva et al 2001).
The integrated number density (ie, total of values) of red-type galaxies (ie, galaxies in the four-dimensional box) in the sample is 20 percent of the total number density in sample8.
3.2 Luminosity densities
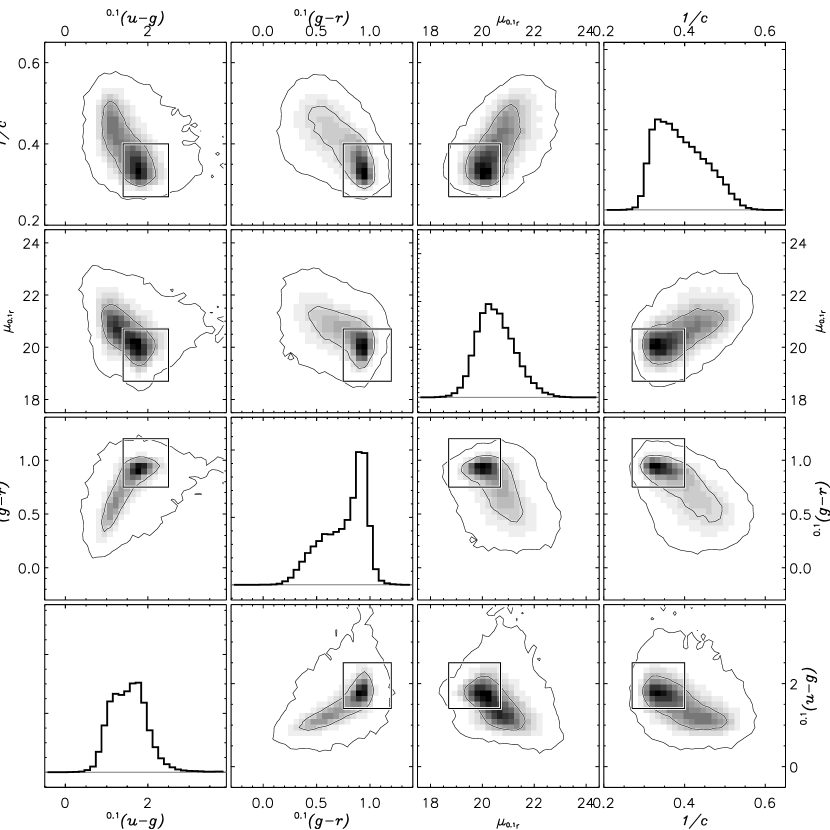
Every galaxy in the sample has a density contribution and an -band luminosity , computed with and the luminosity distance (eg, Hogg 1999), so every galaxy has a luminosity density contribution . Figure 2 shows the total luminosity density of the sample as a function of position in the photometric space.
The integrated luminosity density of red-type galaxies (ie, galaxies in the four-dimensional box) in the sample is 38 percent of the total luminosity density.
4 Discussion
We have identified a class of “red-type” galaxies in the Sloan Digital Sky Survey on the basis of their colors, surface brightnesses, and radial profiles. We have shown that roughly two fifths of the total cosmic galaxy luminosity density in the visual is produced by these red galaxies.
The high central surface brigtnesses and strong radial concentrations of the red galaxies suggest that they are red by dint of age rather than dust extinction. Galaxies outside the red-type box will not enter the box by becoming dustier, because the dust that makes them redder will also further reduce their surface brightnesses.
It is conventional (though unnecessary in the present work) to type galaxies morphologically. A sample of 100 galaxies at was chosen from the red-type sample for morphological classification. The galaxies were chosen randomly, with probability proportional to number density contribution (re-computed in the face of the additional cut). Three authors (MB, DWH, IS) independently classified these 100 galaxies into the coarse morphological sequence E, S0, Sa, Sb/Sc, Sd/Irr. Classification was based on -weighted averages of the and -band images, viewed in black and white with variable stretch on computer screens. For 95 percent of the sample, each pair of classifiers agree to within one morphological class in the crude sample. Across all classifiers, 65 to 77 percent of the number-density weighted sample is in the E and S0 classes. At most 5 percent of the sample is later than Sa in morphological type. Note that none of our conclusions depend on this by-eye morphological classification.
That red galaxies contribute a large fraction of the luminosity density is remarkable because bluer stellar populations produce much more light per unit mass than redder. Typical red-type galaxies in the sample have and ; while typical galaxies outside the red-type region have and (recall that these are not zero-redshift colors). Conventional stellar population models suggest that these two colors differ in stellar mass-to-light ratio by a factor of two or more (Bruzual & Charlot 1993; Kauffmann et al 2002), with the specific value depending on the assumed star formation history in each case. (Patchy or inhomogeneous dust extinction can modify the specific mass-to-light ratios, but dust obeys the same general trend, ie, that redder populations have higher mass-to-light ratios than blue.) The natural interpretation is that more than 50 percent of the stars in the Universe are in red galaxies.
This result is conservative, because we have only considered a very restricted set of red-type galaxies: those that simultaneously satisfy all four of our cuts on color, surface brightness and concentration. There are certainly significant red stellar populations contained in the centers of otherwise blue spiral galaxies, and old stellar populations contribute significantly to the stellar masses of almost all galaxies in the Universe. A very large fraction of all stars are in old stellar populations.
In conventional models of stellar population evolution, and roughly Solar metallicity corresponds to an age greater than about (eg, Bruzual & Charlot 1993), or a formation redshift of (if the Universe is old and the median redshift of the sample is ). Such derived ages depend strongly on metallicity, and red galaxies are known to have abundance ratios different from Solar (they are alpha-enhanced; eg, Worthey et al 1992), so it is dangerous to take absolute measures of stellar population ages seriously. However, taken at face value, it suggests that the cosmic star formation rate was extremely high at early times. Although much is known about star formation history since (see references in Hogg 2001), little is known about . In a minimal model, the comoving volume-averaged star formation rate at can be taken to go as (Hogg 2001) and at can be imagined to be roughly constant and equal to the rate at , then roughly percent of stars would be expected to be older than today. This minimal model is consistent with our results. Given the large numbers of old stars residing in red galaxies in the SDSS, supplemented by the old stars residing in bluer galaxies, it is hard see how comoving star formation rate densities could have been significantly below values for any significant fraction of cosmic time.
References
- (1) Blanton, M. R. et al 2001, AJ, 121, 2358
- (2) Blanton, M. R. et al 2002a, AJ, submitted
- (3) Blanton, M. R. et al 2002b, in preparation
- (4) Bruzual A., G. & Charlot, S. 1993, ApJ, 405, 538
- (5) Connolly, A. J., Szalay, A. S., Dickinson, M., Subbarao, M. U., & Brunner, R. J. 1997, ApJ, 486, L11
- (6) Kormendy, J. & Djorgovski, S. 1989, ARA&A, 27, 235
- (7) Fukugita, M., Hogan, C. J. & Peebles, P. J. E. 1998, ApJ, 503, 518
- (8) Fukugita, M., Ichikawa, T., Gunn, J. E., Doi, M., Shimasaku, K., & Schneider, D. P. 1996, AJ, 111, 1748
- (9) Gunn, J. E. et al 1998, AJ, 116, 3040
- (10) Hogg, D. W. 1999, astro-ph/9905116
- (11) Hogg, D. W. 2001, astro-ph/0105280
- (12) Kauffmann, G. et al 2002, MNRAS, submitted (astro-ph/0204055)
- (13) Lilly, S. J., Le Fevre, O., Hammer, F., & Crampton, D. 1996, ApJ, 460, L1
- (14) Lupton, R. H., Gunn, J. E., Ivezić, Z., Knapp, G. R., Kent, S., & Yasuda, N. 2001, ASP Conf. Ser. 238: Astronomical Data Analysis Software and Systems X, 10, 269
- (15) Oke, J. B. & Gunn, J. E. 1983, ApJ, 266, 713
- (16) Pei, Y. C. & Fall, S. M. 1995, ApJ, 454, 69
- (17) Percival, W. J. et al 2001, MNRAS, 327, 1297
- (18) Petrosian, V. 1976, ApJ, 209, L1
- (19) Pier, J. R., 2002, AJ, submitted
- (20) Roberts, M. S. & Haynes, M. P. 1994, ARA&A, 32, 115
- (21) Schlegel, D. J., Finkbeiner, D. P. & Davis, M. 1998, ApJ, 500, 525
- (22) Schmidt, M., ApJ, 151, 393
- (23) Smith, J. A., Tucker, D. L. et al 2002, AJ, in press
- (24) Strateva, I. et al 2001, AJ, 122, 1861
- (25) Strauss, M. A. et al 2002, AJ, submitted
- (26) Worthey, G., Faber, S. M., & Gonzalez, J. J., 1992, ApJ, 398, 69
- (27) York, D. G. et al 2000, AJ, 120, 1579