An XMM–Newton survey of Extremely Red Objects
Abstract
We present preliminary results of a 25 ks XMM–Newton observation of the largest sample of Extremely Red Objects (EROs) available to date (450 sources), selected in a contiguous area of arcmin2 (Daddi et al. 2000). Five of the 36 hard X–ray selected sources brighter than erg cm-2 s-1 in the 2–10 keV band, are associated with EROs. All of the X–ray detected EROs show rather extreme X–ray–to–optical flux ratios, suggesting the presence of highly obscured AGN activity.
1 Introduction
Extremely Red Objects (EROs, ) were
discovered serendipitously a decade ago (Elston et al. 1988)
from optical and near–infrared selection criteria. Having the
colors expected for high-redshift passive ellipticals, EROs can be used as
tracers of distant and old spheroids as a test for different cosmological models.
Recent wide-area surveys have shown that the surface density of EROs is
consistent with that expected for elliptical galaxies, assuming pure
luminosity evolution (PLE). About 10%
of all objects down to a -band magnitude limit of 19.2 are EROs (Daddi et al. 2000; Daddi, Cimatti
& Renzini, 2000). Furthermore, a large angular clustering signal
associated with EROs
was detected from the –selected sample over the same area,
that is due to the large–scale structure traced by early–type galaxies
at z (Daddi et al. 2002).
On the other hand, the broad–band properties of EROs are also consistent with
those expected for high-redshift dusty starbursts
(e.g., HR–10, Cimatti et al. 1998; Smail et al. 1999) and Active
Galactic Nuclei (AGN) reddened by dust (Pierre et al. 2001).
The relative fraction of old ellipticals,
dusty star–forming systems and obscured AGN among optically selected
ERO samples is a key parameter in the study of the galaxy evolution
and the link between massive elliptical galaxy in formation and
the onset of AGN activity (Almaini et al. 2002; Granato et al. 2001).
A step towards constraining the relative fractions of these different
source types within the ERO population has been recently achieved by
the survey (Cimatti et al. 2002; Daddi et
al. 2002) by means of deep VLT spectroscopy.
The spectroscopic counterparts of about 45
EROs with turned out to be in about equal proportion
old, passive ellipticals (31%) and dusty emission–line galaxies
(33%) at , while a comparable
fraction is still unidentified.
Interestingly, the average spectrum of the emission–line EROs
shows a very red and smooth continuum with
[OII]3727 and a weak [NeV]3426, suggesting
that a fraction of these sources hosts hidden AGN activity.
Given that the Spectral Energy Distribution
(SED) of optically obscured type II AGN is dominated by the host galaxy starlight, they show
colors similar to those of passive ellipticals; therefore,
sensitive hard X–ray observations provide a powerful tool
to uncover AGN activity within the ERO population.
Indeed, a sizeable fraction of the new population of faint hard X–ray
selected sources, recently investigated in Chandra and XMM–Newton medium–deep observations, turned out to be faint
(), obscured objects, with red optical to near–infrared
colours (Mushotzky et al. 2000;
Cowie et al. 2001; Gandhi et al. 2001; Hornschemeier et al. 2001;
Alexander et al. 2002; Mainieri et al. 2002a).
The most extensive study on the X–ray properties of EROs to date was
performed by Alexander et al. (2002) using the 1 Ms Chandra Deep Field
North (CDF-N) observation. Targeting a 70.3 arcmin2 region close
to the CDF-N aim-point, Alexander et al. (2002) detected X–ray emission
from 13 EROs (% of the ERO sample).
The majority (2/3) of the X–ray detected EROs were found to have X–ray
properties consistent with highly obscured AGNs [ (5–35) cm-2 for 1–3].
Moreover, starbursts and normal elliptical galaxies were also
possibly detected at the faintest X–ray fluxes.
Although having deep X–ray and optical
observations, this study is limited in areal coverage, and
therefore is unsuitable for detailed statistical and clustering
analyses of the ERO population.
We have started an extensive program of multiwavelength observations of the largest sample of EROs available to date (450 sources), selected in a contiguous area over a arcmin2 field (the “Daddi field”, Daddi et al. 2000) and complete to a magnitude limit of K19.2. Deep optical (R at the 3 level) photometry is available for the present field (see Daddi et al. 2000 for details in optical and near–infrared data reduction) and VIMOS spectroscopy is planned at VLT. Here we present preliminary results from the first 25 ks XMM–Newton observation of this field (Sec. 2) and compare our results with other recent findings from medium and deep hard X–ray surveys (Sec. 3). Finally, we try to draw some conclusions on the nature of hard X–ray selected EROs (Sec. 4).
2 Data reduction and results
The Daddi field was observed on August 3, 2001 for a nominal exposure
time of ks.
The XMM–Newton data were processed using version 5.2 of the Science Analysis System
(SAS). The event files were cleaned up from hot pixels and soft proton
flares, removing all the time intervals with a count rate higher than 0.15
c/s in the 10–12.4 keV energy range for the two MOS and higher than 0.35
c/s in the 10–13 keV band for the pn unit.
The resulting exposure times are ks in the MOS1 and MOS2
detectors and ks in the pn detector.
The EBOXDETECT task, the standard SAS sliding box cell
detect algorithm, was run on the 2–10 keV cleaned event.
Thirty–six sources were detected above the 3.5
level, corresponding to a flux
limit of erg cm-2 s-1assuming a power–law spectrum
with =1.8 and Galactic absorption (N cm-2).
The X–ray centroids have been corrected for systematic errors with
respect to the optical positions of three bright quasars already known
in the field (from NED database) and then were cross correlated with
the –band catalog.
We searched for
near–infrared counterparts within a radius of
3′′ from the X–ray position in the inner region of the XMM–Newton field–of–view (10 arcmin), while for the objects detected
at larger off–axis angles we adopted a searching radius of
to take into account the broadening of the XMM–Newton PSF at increasing
distance from the aim point.
All but five of the hard X–ray selected
sources have at least one counterpart in the K–band image.
The number of expected spurious sources, computed from
K–band galaxy surface density (Daddi et al. 2000) is about 3.
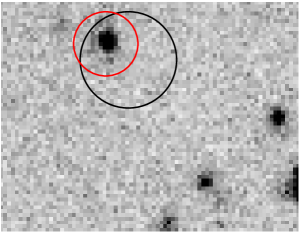
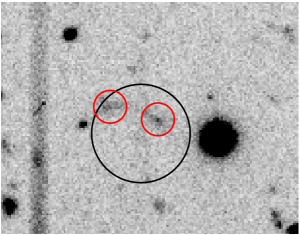
We found a unique candidate for 24 sources
(4 of them with R–K 5), while for the remaining 7 objects
(most of them at large off–axis angles)
we detected two possible counterparts.
In one of these cases the 2 optical counterparts
have similar R band magnitudes and EROs colors (Fig. 1);
for the purposes of the present paper
we consider the nearest ERO as the counterpart of the X–ray
source.
Five of the 31 hard X–ray selected sources with near–infrared counterparts
are thus tentatively associated with EROs.
A more detailed discussion on the XMM–Newton data analysis, the
associations of X–ray sources with optical counterparts and
the analysis of X–ray colors is reported in Brusa et al. (2002).
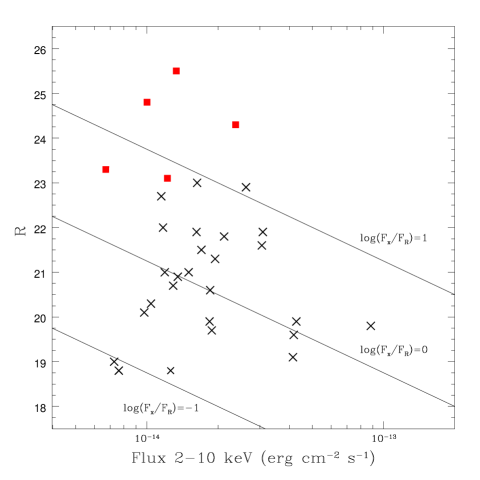
The hard X–ray and optical fluxes of the X–ray sources with a –band counterpart are reported in Fig. 2. All the EROs detected in the XMM–Newton observation show relatively high X–ray–to–optical flux ratios (fX/fO10) compared to those of the other X–ray detected sources.
The XMM–Newton field of view covers an area including EROs: the fraction of X–ray active EROs in this optically selected sample is therefore % (5/350); on the other hand, the fraction of hard X–ray sources with EROs colors is much higher, (5/36), and is in agreement with other XMM–Newton findings (Lehmann et al. 2001).
3 Comparison with literature samples
In order to investigate the nature of hard X–ray selected EROs and the link between faint hard X–ray sources and the ERO population, we have collected all the multiwavelength data available in literature for EROs serendipitously discovered both in XMM–Newton and Chandra medium–deep observations:
-
Thirteen EROs detected in the 2–8 keV band in the Chandra Deep Field North observation (Alexander et al. 2002111These authors adopted different criteria in the EROs definition: , which roughly correspond to ., Hornschemeier et al. 2001);
-
Five hard X-ray selected EROs serendipitously detected in medium–deep Chandra observations in the fields of SSA13 (Mushotzky et al. 2000), A370 (Barger et al. 2001), and A2390 (Cowie et al. 2001, Crawford et al. 2001);
-
Eleven EROs detected in the hard (2–10 keV) band in the XMM–Newton Lockman Hole observation (Mainieri et al. 2002b)
The total sample consists of 34 objects, including the 5 EROs
discussed in the present work.
The R–band magnitudes plotted versus the 2–8 keV fluxes are reported
in Fig. 3 .
The X–ray fluxes have been converted into the
2–8 keV energy range, assuming the spectral models quoted
in the literature, while the R–band magnitudes
have been obtained from published I–band magnitudes
adopting =1.3 (Alexander et al. 2002).
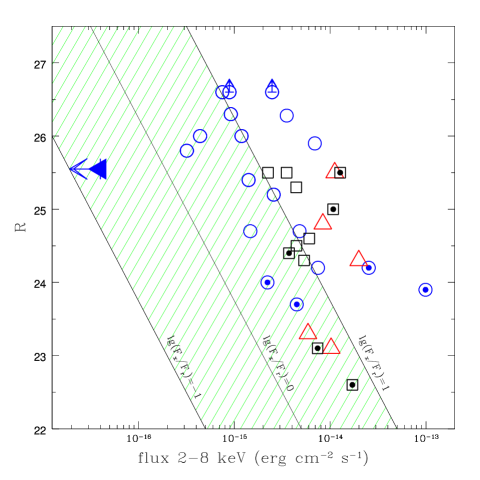
The present EROs sample span a wide range of optical and
X–ray fluxes: all of the objects show a relatively well-defined
correlation between the X–ray fluxes and the optical magnitude
around fX/f 10. This correlation is
shifted by one order
of magnitude from the one found by ROSAT for soft X–ray
selected quasars (Hasinger et al. 1998) and recently extended
by Chandra and XMM–Newton observations also for
hard X–ray selected sources (Alexander et al. 2002; Lehmann et al.
2001).
The most plausible explanation of such a high X–ray–to–optical flux
ratio in these objects is the presence of
high obscuration towards the active nuclear source.
This hypothesis is strongly supported both by X–ray spectral analysis
(Gandhi et al. 2001, 2002; Alexander et al. 2002; Cowie et al. 2001;
Mainieri et al. 2002a,b) and by the optical identifications available for
9 objects of this sample: all but one of the sources
are identified with Type II AGN at , either from optical
spectroscopy (4 objects) or from deep multi–band photometry (4 objects)
(Cowie et al. 2001; Mainieri et al. 2002b; Hornschemeier et al. 2001).
The only source not classified as a type II AGN is the z=1.020
emission–line galaxy in the Hornschemeier et al. sample
(see their Table 10).
4 Discussion and conclusions
All the findings discussed above support the idea that
a significant fraction of the optical counterparts of hard X–ray
selected sources are EROs.
Indeed, the fraction of EROs among the hard X–ray sources in the
Daddi field is 15%; this value rises up to
in the deeper (F erg cm-2 s-1) XMM–Newton survey
of the Lockman Hole, and has to be
considered as a lower limit, as several X–ray sources are not covered
by deep near–infrared observations.
Interestingly enough, if we consider only the sources
with fX/f, the fraction of EROs
is even higher
(more than 50% in the Lockman Hole observation, Mainieri et al. 2002a).
The so far identified EROs have high X–ray luminosity
(LX1044 erg s-1) and they actually are heavily obscured AGN,
as inferred from X–ray spectral analysis
(Cowie et al. 2001; Gandhi et al. 2002; Mainieri et al. 2002a).
Therefore, hard X–ray selected EROs (or at least a fraction of them)
have properties similar to those of Quasars 2, the high–luminosity,
high redshift type II AGNs predicted in X–Ray Background (XRB) synthesis
models (e.g. Comastri et al. 1995).
Deep optical and near–infrared follow–up of complete samples of hard X–ray
selected sources with extreme fX/fO will
definitively assess the fraction of reddened sources among the
XRB constituents.
On the other hand, the fraction of hard X–ray sources within optically
selected ERO samples is much lower. At the optical and
X–ray flux limits of our survey, the fraction is 1.5%
and rises up to % in the deep 1 Ms CDF–N survey
(Alexander et al. 2002). However, it is unlikely that this fraction
is much higher than this value. Indeed, the stacking analysis of
EROs in the HDF–N actually confirms the lack of hard X–ray emission
at fluxes erg cm-2 s-1, with an average fX/fO value which is at least two order of magnitudes lower than the average
ratio of the individually X–ray detected EROs (Fig. 3).
The upper limit on the average fX/fO value is
consistent with that of passive evolving ellipticals or dusty
starburts suggesting the lack of strong AGN activity in the majority
of optically selected EROs.
Deeper X–ray observations of large samples
of –selected EROs would be crucial to compute the fraction of
X–ray active EROs on the widest area possible (to avoid cosmic
variance). A detailed study of the clustering properties of these objects
would shed new light on the link between nuclear activity and galaxy
evolution.
Acknowledgements.
This research has been partially supported by ASI contracts I/R/103/00, I/R/107/00 and I/R/27/00, and by the MURST grant Cofin-00–02–36. CV also thanks the NASA LTSA grant NAG5–8107 for financial support. We gratefully thank D. Alexander, G. Zamorani and F. Fiore for useful discussions and V. Mainieri for providing data prior to publication.References
- [1] Alexander D.M., Vignali C., Bauer F.E., Brandt W.N., Hornschemeier A.E., Garmire G.P., & Schneider D.P., 2002, AJ 123, 1149
- [2] Almaini O., et al., 2002, MNRAS submitted, astro-ph/0108400
- [3] Barger A.J., Cowie L.L., Bautz M.W., Brandt W.N., Garmire G.P., Hornschemeier A.E., Ivison R.J., & Owen F.N., 2001, AJ 122, 2167
- [4] Brusa M., Comastri A., Daddi E., et al., 2002, in preparation
- [5] Cimatti A., Andreani P., Rottgering H., & Tilanus R., 1998, Nature 392, 895
- [6] Cimatti A., et al. 2002, A&A 381, L68
- [7] Comastri A., Setti G., Zamorani G., & Hasinger G., 1995, A&A 296, 1
- [8] Cowie L.L., et al., 2001, ApJ 551, L9
- [9] Crawford C.S., Fabian A.C., Gandhi P., Wilman R.J., & Johnstone R.M., 2001, MNRAS 324, 427
- [10] Daddi E., Cimatti, A., Pozzetti L., Hoekstra H., Röttgering H.J.A., Renzini A., Zamorani G. & Mannucci F., 2000, A&A 361, 535
- [11] Daddi E., Cimatti A., & Renzini A., 2000, A&A 362, L45
- [12] Daddi E., et al. 2002, A&A 384, L1
- [13] Elston R., Rieke G.H., & Rieke M.J., 1988, ApJ 331, L77
- [14] Gandhi P., Crawford C.S., Fabian A.C., Wilman R.J., Johnstone R.M., Barger A.J., & Cowie L.L, 2001, Proc. XXI Moriond Astrophysics Meeting, ”Galaxy Clusters and the High Redshift Universe Observed in X-rays”, eds D. Neumann, F.Durret & J. Tran Thanh Van, astro–ph/0106139,
- [15] Gandhi P., Fabian A.C., & Crawford C.S., 2002, Proc. Symposium ’New Visions of the X–ray Universe in the XMM–Newton and Chandra Era’, ESA SP–488, August 2002 ed. F. Jansen, astro–ph/0201543
- [16] Granato G.L., Silva L., Monaco P., Panuzzo P., Salucci P., De Zotti G., Danese L., 2001, MNRAS 324, 757
- [17] Hasinger G., et al., 1998, A&A 329, 482
- [18] Hornschemeier A.E., et al. 2001, ApJ 554, 742
- [19] Lehmann I., Hasinger G., Murray S.S. & SchmidtLehmann M., 2001, Proceedings for “X-rays at Sharp Focus Chandra Science Symposium”, astro–ph/0109172
- [20] Mainieri V., Bergeron J., Rosati P., Hasinger G., & Lehmann I., 2002a, astro–ph/0202211, Proc. Symposium ’New Visions of the X–ray Universe in the XMM–Newton and Chandra Era’, ESA SP–488, August 2002 eds. F. Jansen
- [21] Mainieri V., et al., 2002b, in preparation
- [22] Mushotzky R.F., Cowie L.L., Barger A.J., & Arnaud K.A., 2000, Nature 404, 459
- [23] Pierre M., et al., 2001, A&A 372, L45
- [24] Smail I., Ivison R.J., Kneib J.P., Cowie, L.L., Blain A.W., Barger A.J., Owen F.N., & Morrison G., 1999, MNRAS 308, 1061