[
Small Angular Scale CMB Anisotropies from CBI and BIMA experiments: Early Universe or Local Structures?
Abstract
The advent of high resolution cosmic microwave background (CMB) experiments now allows studies on the temperature fluctuations at scales corresponding to few arcminutes and below. Though the reported excess power at by CBI and BIMA is roughly consistent with a secondary contribution resulting from the Sunyaev-Zeldovich effect, this requires a higher normalization for the matter power spectrum than measured by other means. In addition to a local red-shift contribution, another strong possibility for anisotropies at very small scales involve non-standard aspects of inflationary models. To distinguish between contributions from early universe and local structures, including a potential point source contribution, and to understand the extent to which structures at low red-shifts contribute to small scale temperature anisotropies, it may be necessary to perform a combined study involving CMB and the large scale structure. We suggest a cross-correlation of the temperature data with a map of the large scale structure, such as the galaxy distribution. For next generation small angular scale CMB experiments, multi-frequency observations may be a necessary aspect to allow an additional possibility to distinguish between these different scenarios.
]
I Introduction
The high resolution, and high signal-to-noise, cosmic microwave background (CMB) experiments like Boomerang [1], DASI [2], MAXIMA [3], and, more recently, VSA [4] have revolutionized the study of temperature anisotropies at arcminute scales. The multiple peaks observed by these experiments in the angular power spectrum of the CMB anisotropies have provided a strong evidence for inflationary models with adiabatic initial conditions for structure formation.
The recent results from the CBI interferometer [5] confirms the presence of multiple peaks in the angular power spectrum with an unambiguous detection of the damping tail as expected. At smaller angular scales beyond the damping tail, however, the CBI experiment in the ’deep field’ configuration [6] and the BIMA array [7] have both reported the presence of an ’excess’ in temperature power at a level of about with a detection confidence at the level of and above.
The presence of this excess is not consistent with the predicted damping of the primordial (primary) anisotropies [6] but can in principle be explained as due to a secondary effect [8, 9]. At angular scales corresponding to projected galaxy clusters extents of order few arcminutes and below, the Sunyave-Zel’dovich effect (SZ; [27]), in fact, produces a now well-known contribution. The SZ effect has now been directly imaged towards massive galaxy clusters [28], where temperature of the scattering medium can reach as high as 10 keV producing temperature changes in the CMB of order 1 mK at Rayleigh-Jeans (RJ) wavelengths and whose presence is a priori known based on optical data. These, and other unresolved, clusters contribute to the dominant anisotropy contribution at arcminute scales.


Even if the detection by the CBI and BIMA experiments marks an important milestone, however, it is still not clear if the excess can be easily explained by the SZ effect. There are several techniques, based on semi-analytic computations and numerical simulations, that can be used to predict the SZ signal from a population of clusters. The most recent numerical simulations (see e.g. [10]), assuming cosmological parameters consistent with the primary anisotropies and other observables, predict, in general, an amplitude for the SZ power spectrum at small angular scales which is roughly an order of magnitude lower than the observed by recent two experiments.
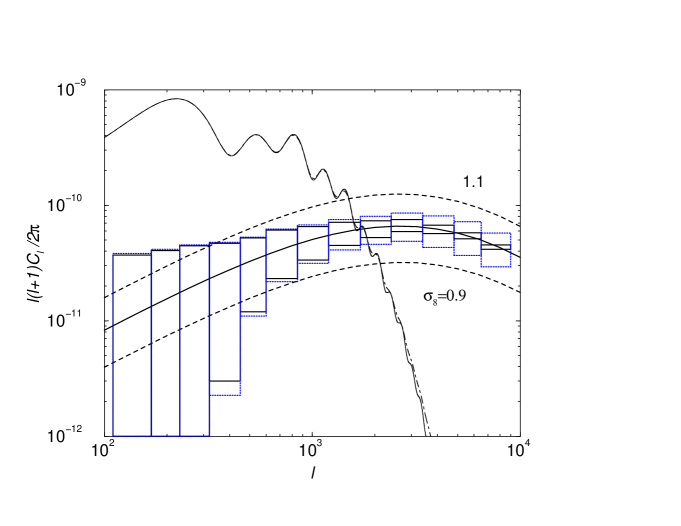
As discussed in the literature [8, 9], the key parameter in fixing the amplitude of the SZ signal is the value of the rms mass fluctuations on spheres of 8 Mpc h-1 (). Due to the highly non linear behaviour, the SZ thermal contribution (see Fig.2 left panel) is strongly dependent on with . As we can see in Figure 2, right panel, the power spectrum associated with the SZ effect (calculated following the techniques described in [29, 30]) is in agreement with the new CBI and BIMA data only for values of . This is consistent with the value of at c.l. recently found by Komatsu and Seljak [9] in a detail analysis and with the numerical results obtained by both Bond et al. [8], White et al. [10] and in Ref. [11] ().
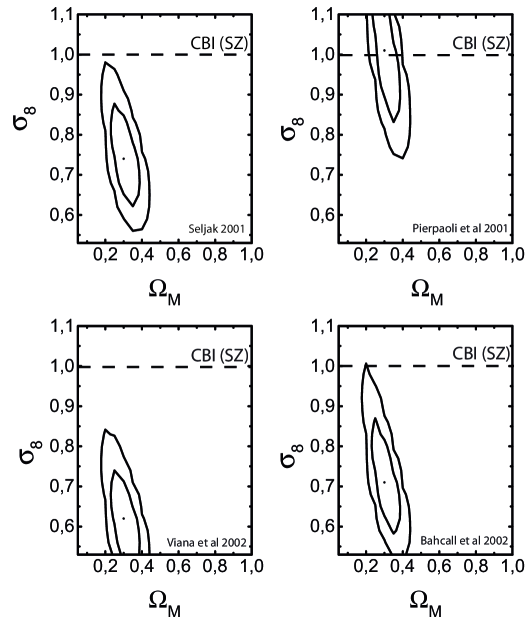
A value of , while in agreement with cosmic shear data (see e.g. [16]) and the ’old’ cluster normalization [12], is in disagreement with new cluster abundances results [23, 17] and the cluster mass function from early SDSS data [20] when combined with the latest CMB+Supernovae type Ia analysis [21] (see Fig.1). Recent joint analysis from the mass function and power spectrum obtained from the REFLEX X-ray survey [13], confirm these values with and .
A value of higher than one is also inconsistent with the results obtained by combined analysis of CMB and galaxy clustering data from the recent 2dF survey [14, 15] A possible way to solve the tension with the CMB value is to advocate an early reionization of the intergalactic medium, such that the optical depth of the universe is [8] or a red-shift of reionization . However, this is not in agreement with the observed evolution of the Ly-alpha transmitted flux in the spectra of four highest redshift quasars discovered by the Sloan survey, which suggests [18] that points to (see e.g. [19]).
Even if is fair to say that most of the above measurements can be strongly affected by systematics, it appears that the cosmological informations obtained from the secondary anisotropies under the assumption of a pure SZ component are in tension with the same informations obtained by the primary anisotropies when combined with other cosmological observables.
A solution to this problem, however, is to postulate an extra contribution to the small scale anisotropies from some mechanism different from SZ. Additional contributions at these small scales like those from kinetic SZ effect, Ostriker-Vishniac effect [31] and from the patchy, or inhomogeneous, reionization [32]. are generally expected much lower than the thermal SZ contribution ***We refer the reader to Ref. [34] and [33] for a detailed discussion of these contributions..
II Beyond SZ: Contributions to Small Scale Power
In addition to such processes, the anisotropies at small angular scales can also be affected by the presence of foregrounds. At frequencies relevant to recent small scale anisotropy results at 30 GHz, a dominant contribution may come from extra-galactic radio point sources. The possible contamination involving radio point sources has been investigated in [6] with the conclusion that the contribution from point sources should not be significant. It has been recently noted [47], however, that if the excess power at small angular scales is to be explained by the SZ effect, then radio point sources at the observing frequencies of CBI and BIMA, 30 GHz, must be a surprisingly weak contaminant.
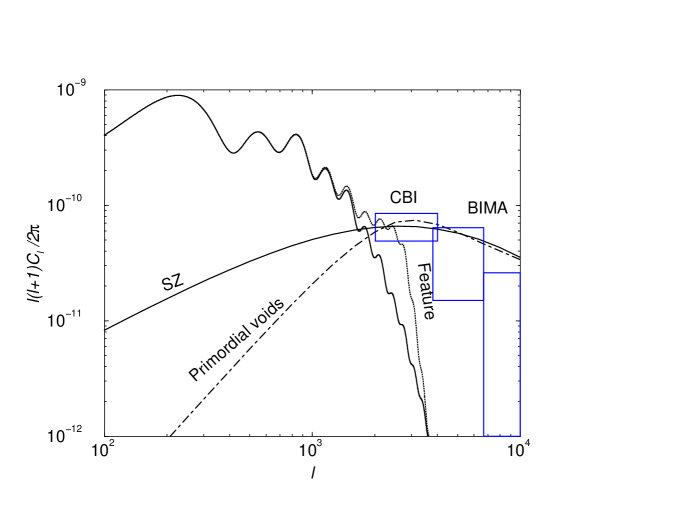
In this paper we want to point out that an extra contribution to temperature anisotropies at small angular scales can arise also in non-standard models of inflation. A strong possibility, for example, is the one that has recently been discussed in detail [37] involving the existence of primordial voids in the early universe†††For the purpose of this discussion, note that we define early universe to be the era around, and before, recombination , while the local universe is the era after reionization . [35, 36, 37]. There is an important contribution from these voids to temperature anisotropies. Similar to the Sachs-Wolfe (SW; [25]) effect associated with the dark matter potential at the last scattering surface, these primordial voids also generate a SW contribution. The angular scale for this latter SW temperature fluctuations are consistent with the projected size of the void at the last scattering surface. Note that voids which are fully embedded in the primordial photon-baryon fluid do not generate a new anisotropy contribution via the SW effect.
Following the discussion presented in Ref. [36] and [37], for illustration purposes, we calculate the SW contribution associated with voids using parameters which are consistent with voids observed via red-shift surveys of the present day and a volume fraction, again, consistent with such observations [38]. Between the last scattering surface and today, these voids also contribute to additional temperature anisotropies through frequency shifts, mainly the Rees-Sciama effect (RS; [39]) and effects such as gravitational lensing. For parameters on voids consistent with current observations, these latter low red-shift contributions are however smaller and can be ignored [36].
Another possibility, recently investigated by various authors (see e.g. [40]) but in different contexts, is the presence of a feature in the primordial spectrum of fluctuations, as expected, for example, in inflationary models with broken scale invariance. In Fig.1 we present the possible contribution to the small scale anisotropies from a feature in the spectrum modeled as gaussian centered at with dispersion and amplitude . While this feature is not fully ruled out by results on the matter power spectrum from recent galaxy red-shift surveys such as the 2dF (see e.g. [41]), its width is still dangerously close to the observed spectral resolution around these scales. Though models involving primordial features only produce excess power over a limited range in multipolar space, in this case, only out to a , the current small scale anisotropy observations are also limited in the coverage of the power spectrum complicating any identification of a feature. However, as we can see from Fig.2, the BIMA result is already strongly constraining this hypothesis.
In addition to all these possible contributions arising from modifications to the standard inflationary scenario, we also note that there may be additional possibilities to generate small scale anisotropies at the last scattering via modifications to recombination [42].
Given distinct possibilities for small scale temperature anisotropies, involving the large scale structure after reionization and the last scattering surface, and giving the difficulties in explaining the CBI effect as solely due to SZ, an important question is how to distinguish between them when interpreting any detection of power at smaller angular scales in current and future experiments.
In the rest of the discussion, we will therefore consider how likely we can distinguish between the two scenarios involving an early universe contribution or a local redshift contribution. For the purpose of this discussion we will assume potential low redshift contributions involving SZ and radio point sources.
III Early Universe or Local Structures?
Note that a fundamental aspect related to the SZ contribution is its distinct frequency dependence. This spectrum can be utilized to separate its contribution from the dominant anisotropies associated with primary fluctuations at large scale and other thermal fluctuations, such as due to the SZ kinetic effects associated with the peculiar motions of clusters, as well as any void or non-standard contribution, at small angular scales [43]. The current anisotropy observations at small scales, unfortunately, are limited at most to a single frequency and this limitation is unlikely to be improved significantly till the advent of next generation of experiments. In the case of CBI and BIMA, observations are limited to 30 GHz at the RJ part of the spectrum. We expect observations, at higher frequencies, such as at 150 GHz by the ACBAR instrument to see a contribution which is lower than at 30 GHz, by a factor of 0.22. Observations at and above the SZ null frequency of 217 GHz are clearly desirable since a contribution from radio point sources is also expected to be decreasing in frequency while an early-universe contribution is frequency independent.
An additional aspect of the SZ effect is its non-Gaussianity. It is now well established that contributions to the SZ effect primarily comes from massive galaxy clusters which are rare. Such a mass dependance makes the SZ effect highly non-linear. As illustrated in figure 2, for example, the SZ effect varies by a factor of 2 when the normalization of the matter power spectrum is changed by 10%. Another aspect of this non linearity is the increase in SZ variance when compared to the expected Gaussian variance contribution. In addition to SZ, point source contribution may also be non-Gaussian, especially, if point sources trace the non-linear large scale structure at low redshifts. Thus, non-Gaussian aspects are potentially common to all low red-shift contributions since they all tend to trace the local universe non-linear structures which are non-Gaussian distributed.
The non-Gaussianity alone, however, may not distinguish the nature of small scale anisotropy power as observed in current experiments as the non-standard modifications to the last scattering involving primordial voids also generate a highly non-Gaussian anisotropy contribution [44]. A reliable approach to distinguish between a local, whether SZ or point sources, and an early contribution, voids and bumps in the primordial power spectrum, is to consider a combined study involving the large scale structure and CMB. Here, we suggest a cross-correlation of the CMB anisotropy data with a map of the large scale structure.
The correlation between CMB, mainly the best COBE DMR map, and large scale structure has already been considered to understand the extent to which the ISW effect contributes at large angular scales [45]. As discussed in [48], this correlation, however, is dominated by the large cosmic variance at low multipoles corresponding to angular scales with tens of degrees on the sky. In the case of small scales anisotropies, the extent to which the correlation can be detected will be determined primarily by the instrumental noise contribution. For the purpose of this discussion, we introduce the correlation coefficient between, say, large scale structure contributions (SZ or point sources) and a tracer of the large scale structure as
| (1) |
where is the cross power spectrum between large scale structure contributions and the tracer field. We write this as , where and are the cross power spectra between SZ and the tracer field, and, point sources (PS) and the tracer field respectively. The cross correlation of SZ and the tracer field is described in Ref. [29] following the so-called halo model approach to large scale structure [46]; we note that a similar approach can be considered for . Given the poor knowledge of the statistical distribution of radio-galaxies, which could represent a different population from those observed in the optical, and the wide range of observed spectral energy distributions due to different synchrotron cut-offs, however, make the problem of predicting radio source clustering properties in a given band, as well as their correlation with other LSS tracers, a difficult, though interesting, task. We note that certain issues related to point sources are discussed in [47] to which we refer the reader for further details.
Note that the associated signal-to-noise for the detection of the cross-correlation is
| (2) |
where , and are the total power spectrum contributions from large scale structure, noise contributions associated with small scale fluctuations and the power spectrum of the tracer field, respectively. Here, is the cross-power spectrum between SZ effect and contaminant point sources; the latter can again be calculated following models of Ref. [34]. If th field is galaxies (which may also contribute to radio background), then we note that . Note that at small scales, .
In figure 3, we show the correlation coefficient of SZ and tracers of the large scale structure involving weak lensing convergence and the galaxy distribution. In the near future, a cross-correlation study of small scale anisotropies and a map of the galaxy distribution, such as from the Sloan survey, looks promising and should be considered. To calculate the expected signal-to-noise ratio for a detection of the correlation signal, we assume a noise contribution to the tracer field involving the shot-noise contribution arising from the finite number of galaxies and assume no point source contribution to small scale anisotropy signal. The latter is a safe assumption given that point source contributions have been found to be subdominant by various monitoring and analysis techniques considered by, at least, the CBI group. For a survey of 10 degrees2 and no noise contributions, we estimate the signal-to-noise ratio of order 100 while this drops to 10 when reasonable noise contributions are considered to both the temperature and galaxy tracer field. For example, the galaxy shot-noise considered in this involve a surface density of sr-1, which is the density of galaxies down to a R band magnitude of 25 [49]. We note that the presence of point sources will likely increase this signal-to-noise estimate considerably since point sources may correlated between with tracers of the large scale structure, such as the galaxy distribution field. This increase clearly motivates attempts for such a combined study.
Thus, the extent to which small scale anisotropies correlate with large scale structure by it self does not determine the nature of the temperature fluctuation. Though it establishes that the local universe is partly responsible, it does not necessarily mean that SZ is the dominant contribution since fluctuations may contain a point source contribution. If one is interested in distinguishing between SZ and point sources, it is necessary to consider aspects beyond simple cross-correlations.
In general, the extent to which SZ thermal effect contributes at small angular scales can be established more reliably based on its spectral dependence relative to thermal CMB than any correlation associated with the large scale structure alone. The SZ frequency spectrum is unique and is unlikely to be mimicked by other sources of contributions. To determine the SZ contribution and to separate it from other thermal fluctuations at small angular scales, the future experiments should be equipped with multifrequency capabilities that expands from low RJ frequencies to 300 GHz; the low frequencies help determine the radio source contribution while high frequencies determine the confusion from mid-infrared/submm point sources. The observations at SZ null of 217 GHz determine the extent to which other thermal fluctuations are significant as a source of small scale anisotropies.
Though to a certain extent current and upcoming detection of small scale power may be important as a first detection, dedicated small angular scale experiments with multifrequency coverage is clearly needed to fully understand the nature of fluctuations at these small scales. Just as anisotropy studies at degree angular scales involving the acoustic peak structure have been successful as a strong probe of cosmology, the small-scale anisotropies open the window to understand both the large scale structure and important subtle effects involving the last scattering surface.
Acknowledgements.
We wish to thank Martin Kunz, Louise Griffiths and Joe Silk for helpful comments. This work was supported at Caltech by the Sherman Fairchild foundation and the DoE grant DE-FG03-92-ER40701. AM is supported by PPARC.REFERENCES
- [1] C. B. Netterfield et al. [Boomerang Collaboration], arXiv:astro-ph/0104460.
- [2] N. W. Halverson et al., arXiv:astro-ph/0104489.
- [3] A. T. Lee et al., Astrophys. J. 561 (2001) L1 [arXiv:astro-ph/0104459].
- [4] P.F. Scott et al, astro-ph/0205380 (2002).
- [5] T.J. Pearson et al., astro-ph/0205388 (2002).
- [6] B. S. Mason et al.,astro-ph/0205384 (2002).
- [7] K. S. Dawson et al., astro-ph/0206012 (2002).
- [8] J. R. Bond et al, astro-ph/0205386 (2002).
- [9] E. Komatsu, U. Seljak, astro-ph/0205468 (2002).
- [10] M. White, L. Hernquist, V. Springel, astro-ph/0205437 (2002).
- [11] Y.T. Lin, J. J. Mohr, astro-ph/0208005 (2002).
- [12] E. Pierpaoli et al., MNRAS 325,77 (2001).
- [13] P. Schuecker et al., in preparation. See also L. Guzzo, astro-ph/0207285.
- [14] O. Lahav, S. Bridle et al., astro-ph/0112162 (2002). MNRAS in press.
- [15] A. Melchiorri and J. Silk, arXiv:astro-ph/0203200.
- [16] A. Refregier et al., astro-ph/0203131 (2002).
- [17] U. Seljak, astro-ph/0111362 (2001).
- [18] N. Gnedin, astro-ph/0110290 (2001).
- [19] M. Bruscoli, A. Ferrara, E. Scannapieco, astro-ph/0201094 (2001).
- [20] N. Bahcall et al., astro-ph/0205490, (2002).
- [21] J. L. Sievers, astro-ph/0205387 (2002).
- [22] S. Borgani, astro-ph/0106428 (2001).
- [23] P. Viana et al., astro-ph/0111394 (2002).
- [24] R. Bean and A. Melchiorri, Phys. Rev. D 65 (2002) 041302 [arXiv:astro-ph/0110472].
- [25] R. K. Sachs and A. M. Wolfe, Astrophys. J., 147, 73 (1967).
- [26] U. Seljak, Astrophys. J., 463, 1 (1996); W. Hu, Phys. Rev. D, 62, 043007 (2000).
- [27] R. A. Sunyaev and Ya. B. Zel’dovich, MNRAS, 190, 413 (1980)
- [28] J. E. Carlstrom, M. Joy and L. Grego, Astrophys. J., 456, L75 (1996); M. Jones, R. Saunders and P. Alexander, et al., Nature, 365, 320 (1993).
- [29] A. Cooray, Phys. Rev. D, 62, 103506 (2000).
- [30] A. Cooray, Phys. Rev. D, 64, 063514 (2001).
- [31] J. P. Ostriker and E. T. Vishniac, Astrophys. J., 306, L51 (1986);
- [32] N. Aghanim, F. X. Desert, J. L. Puget and R. Gispert, A&A, 311, 1 (1996).
- [33] N. Aghanim, P. G. Castro, A. Melchiorri and J. Silk, arXiv:astro-ph/0203112.
- [34] A. Cooray, astro-ph/0203048 (2002)
- [35] L. Amendola, C. Baccigalupi and F. Occhionero, Astrophys. J. Lett., 492, L5 (1998).
- [36] N. Sakai, N. Sugiyama and J. Yokoyama, Astrophys. J., 510, 1 (1999).
- [37] L. M. Griffiths, M. Kunz and J. Silk, astro-ph/0204100 (2002).
- [38] F. Hoyle and M. S. Vogley, Astrophys. J., 566, 641 (2002).
- [39] M. J. Rees and D. N. Sciama, Nature, 519, 611 (1968).
- [40] O. Elgaroy et al.,astro-ph/0111208 (2001); J. Barriga, E. Gaztanaga, M. G. Santos and S. Sarkar, Mon. Not. Roy. Astron. Soc. 324 (2001) 977 [arXiv:astro-ph/0011398]. astro-ph/0010571 (2001).
- [41] M. Tegmark, A. J. S. Hamilton, Y. Xu, astro-ph/0111575 (2001).
- [42] M. White, Astrophys. J., 555, 88 (2001).
- [43] A. Cooray, W. Hu and M. Tegmark, Astrophys. J., 540, 1 (2000).
- [44] A. Cooray et al. in preparation.
- [45] S. Boughn, R. Crittenden and N. Turok, New Astronomy, 3, 275 (1998); A. Cooray, PRD in press, astro-ph/0112408, (2002).
- [46] A. Cooray & R. Sheth, Physics Reports in press (astro-ph/0206508)
- [47] G. P. Holder, Astrophys. J.submitted, astro-ph/0205467
- [48] A. Cooray, Phys. Rev. Din press, astro-ph/0112408 (2002).
- [49] I. Smail, D. Hogg, Y. Lin and J. G. Cohen, Astrophys. J. Lett., 449, 105 (1995).