Future Evolution of Nearby Large-Scale Structure in a Universe Dominated by a Cosmological Constant
Abstract
We simulate the future evolution of the observed inhomogeneities in the local universe assuming that the global expansion rate is dominated by a cosmological constant. We find that within two Hubble times ( billion years) from the present epoch, large-scale structures will freeze in comoving coordinates and the mass distribution of bound objects will stop evolving. The Local Group will get somewhat closer to the Virgo cluster in comoving coordinates, but will be pulled away from the Virgo in physical coordinates due to the accelerated expansion of the Universe. In the distant future there will only be one massive galaxy within our event horizon, namely the merger product of the Andromeda and the Milky Way galaxies. All galaxies that are not gravitationally bound to the Local Group will recede away from us and eventually exit from our event horizon. More generally, we identify the critical interior overdensity above which a shell of matter around an object will remain bound to it at late times.
keywords:
cosmology: theory , cosmology: large-scale structures , galaxies: Local Group , methods: numerical,
1 Introduction
Recent data on the temperature anisotropies of the cosmic microwave background (e.g. Hanany et al., 2000; de Bernardis et al., 2000), the luminosity distance to Type Ia supernovae (Perlmutter et al., 1998; Riess et al., 1998; Garnavich et al, 1998), and the large-scale distribution of galaxies (Peacock et al., 2001; Verde et al., 2002) favors a flat universe with present density parameters of in matter and in a cosmological constant. The energy density of the vacuum (the so-called cosmological constant or “dark energy”) appears to be currently dominating the expansion rate of the Universe.
Given these specific values for the cosmological density parameters, it has now become possible to predict quantitatively the future evolution of the visible Universe. The existence of a cosmological constant has profound consequences in this context (see, e.g. Starobinsky, 2000; Gudmundsson & Björnsson, 2002; Loeb, 2002); in particular: (i) when the Universe will age by a factor of a few, the event horizon will stall at a fixed proper distance of Gpc around us (where is the present Hubble constant in units of ); (ii) all sources with present redshifts larger than 1.8 have already crossed our event horizon and are therefore out of causal contact today; and (iii) even if we continue to monitor the sources with current redshifts of into the infinite future, we will only be able to see these sources acquire intrinsic ages of billion years in their rest frame.
In this paper we use N-body simulations to calculate the future gravitational growth of the observed large-scale structure in the local universe. For simplicity, we assume that the vacuum energy density is constant in time (as for a classical cosmological constant) and adopt the values , and . We simulate the evolution of density inhomogeneities within a sphere of radius around the Milky Way galaxy. Our goal is to determine the time when the accelerated expansion of the Universe will freeze the large-scale structures in distant future, as well as to find the minimum overdensity of matter interior to a shell surrounding an object today that will allow the shell to remain bound to the object at late times despite the repulsive gravitational force of the vacuum. Another issue of particular interest is the question whether the Local Group of galaxies is bound to the nearby Virgo cluster. It has been well-established that the Local Group has a peculiar infall velocity towards the direction of the Virgo cluster, the so-called ‘Virgocentric Infall’ (e.g. Aaronson, et al., 1982; Davis & Peebles, 1983; Lynden-Bell, et al., 1988), but it has not been investigated yet by a direct numerical simulation whether the Local Group will eventually fall into the Virgo cluster in the future given the observed galaxy distribution in the local universe. The possibility remains that the Virgocentric Infall will freeze in comoving coordinates due to the exponential expansion of the universe, and the Local Group will not ultimately merge with the Virgo cluster. We investigate this issue for the first time by running an N-body simulation, starting from initial conditions at z=0 that match the observed galaxy distribution in the nearby universe and ending it in a distant future.
The outline of this paper is as follows. In § 2 we describe the characteristics of our N-body simulations for the evolution of the global structure of the local universe. The results from the simulations are discussed in § 3. We then derive in § 4 the present-day overdensity threshold for a spherical region to collapse in the future, and apply this condition to the Local Group in § 5. Finally, we summarize our main conclusions in § 6.
2 Simulations
The simulations were carried out with the parallel tree N-body/SPH code GADGET111http://www.MPA-Garching.MPG.DE/gadget/ (Springel, Yoshida, & White, 2001). The SPH component of the code was turned off as we are only interested in the dark matter particles which dominate the fluctuating mass density. For the initial conditions, we used the simulation output of Mathis et al. (2002)222http://www.MPA-Garching.MPG.DE/NumCos/CR/ at . This simulation was designed so that at the simulated mass density field would best match the observed galaxy overdensity distribution in the IRAS 1.2 Jy survey of Fisher et al. (1994, 1995). Mathis et al. (2002) constructed mock catalogues of the Mark III Catalogue of Peculiar Velocities (Willick et al., 1995, 1996, 1997) using their simulation result, and have shown that the radial peculiar velocities in mock and real catalogues agree very well. The original data set of Mathis et al. (2002) contains 50.7 million dark matter particles of mass within the comoving radius of around the supergalactic center (inner high-resolution region), and 20.5 million particles within the comoving radius of (outer low-resolution region). The simulation of this spherical region was run with a vacuum boundary condition.
Because we are only interested in the evolution of the structure with mass-scale larger than that of the Local Group, we reduce the original data set by a factor of 100 through random sampling of particles. This reduction of data allows us to run the simulation with a relatively low computational cost while preserving the mass and spatial resolution we need to make predictions for the questions we are interested in, given the observed galaxy distribution in the nearby universe. The resulting mass of each dark matter particle in the high resolution region is (comparable to the mass of an galaxy), and the number of high resolution particles is half a million. We have set the gravitational softening length to the physical scale of , since structures below this scale are not of interest. This mass and spatial resolution is sufficient for following the overall structure of the local universe, but not sufficient for resolving the inner details of galaxy groups such as the Local Group, of which the Milky Way galaxy is the dominant member.
Using the reduced data set, we have simulated the evolution of the local universe from the present time (corresponding to a scale factor value of at ) to the 6 Hubble times into the future (; billion years from today). Because the present Hubble time Gyr (for ) is very close to the present age of the Universe Gyr in the adopted cosmology, the epoch of roughly corresponds to from the Big Bang (). Note that we denote all present-day values with a subscript zero.
In addition to the above constrained realization simulation of the local universe, we have also performed a simulation with a periodic box of containing dark matter particles, in order to make sure that the statistical results presented in this paper are not affected by cosmic variance or by the choice of the vacuum boundary condition for the constrained realization run. Statistically, we find that the results from the two runs agree very well with one another, and so we only show the results from the constrained realization run in § 3.
The simulations were performed on the local Beowulf PC cluster located at Harvard-Smithsonian Center for Astrophysics. It is interesting to note that the numerical code speeds up its calculation at late cosmic times. The accelerated expansion of the Universe freezes the large-scale structures in comoving coordinates, and so at late times the variable time step of the code increases and the tree update for the force computation becomes less frequent.
3 Future Evolution of Large-Scale Structure in the Local Universe
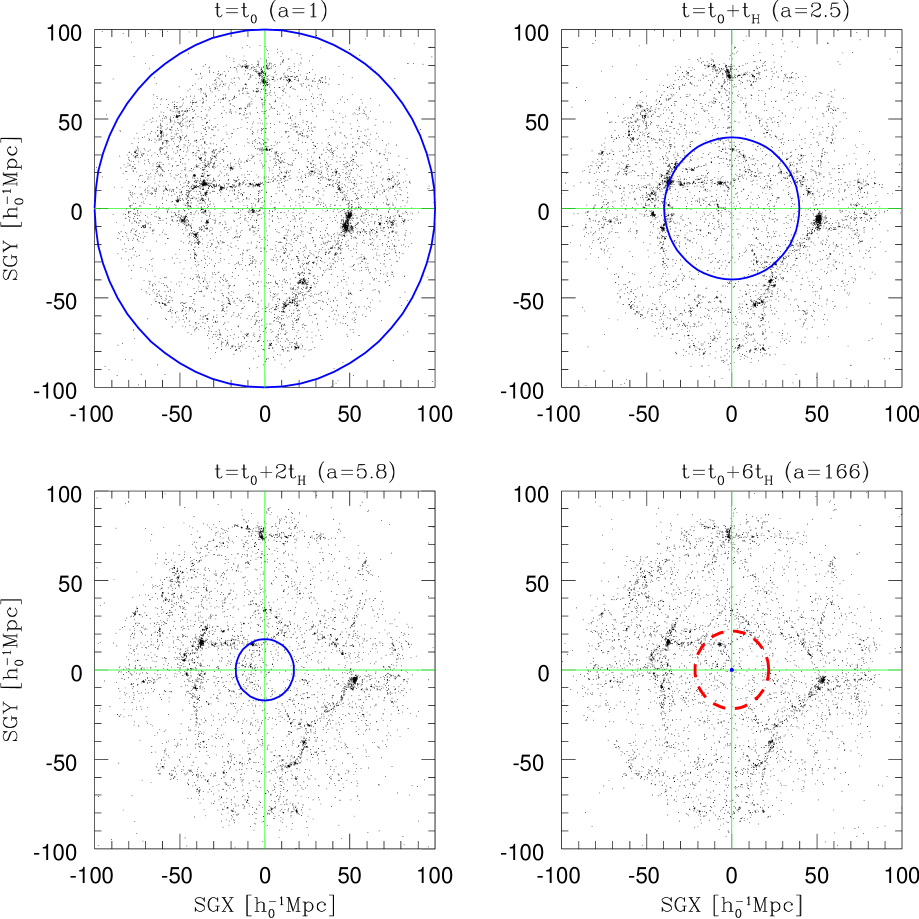
Figure 1 shows the distribution of particles in a slab covering a width (centered at zero) along the supergalactic Z axis of , and projected onto the supergalactic XY plane in comoving coordinates. From top left to bottom right the four panels show snapshots at times , , , and , corresponding to , 2.5, 5.8, and 166, respectively. The solid circle in each panel denotes the physical radius of at each epoch. At , the Universe has expanded so much that this circle is no longer visible. Three major density peaks can be easily identified in all panels: the Coma cluster at the top, the Great Attractor (Centaurus) to the left of the center, and the Perseus-Pisces to the right of the center. The Virgo cluster is also apparent just above the center. Close examination of the structures reveals that most of the evolution takes place between and , and little evolution is seen after . This follows from the fact that after a few Hubble times, the exponential growth of the scale factor, , damps any peculiar velocity which is gravitationally induced by mild density inhomogeneities. The bottom right panel shows our event horizon by the thick dashed circle around the supergalactic center, which is located at a physical radius of Gpc. At , all clusters except Virgo are already outside our event horizon. The Virgo cluster will also exit from the event horizon at (; billion years from today) and its image will fade quickly while remaining frozen on the sky at the time of its exit. Although our calculation does not take general relativistic effects into account, we expect our near-horizon results to be valid, since structures on this scale should at any event be frozen.
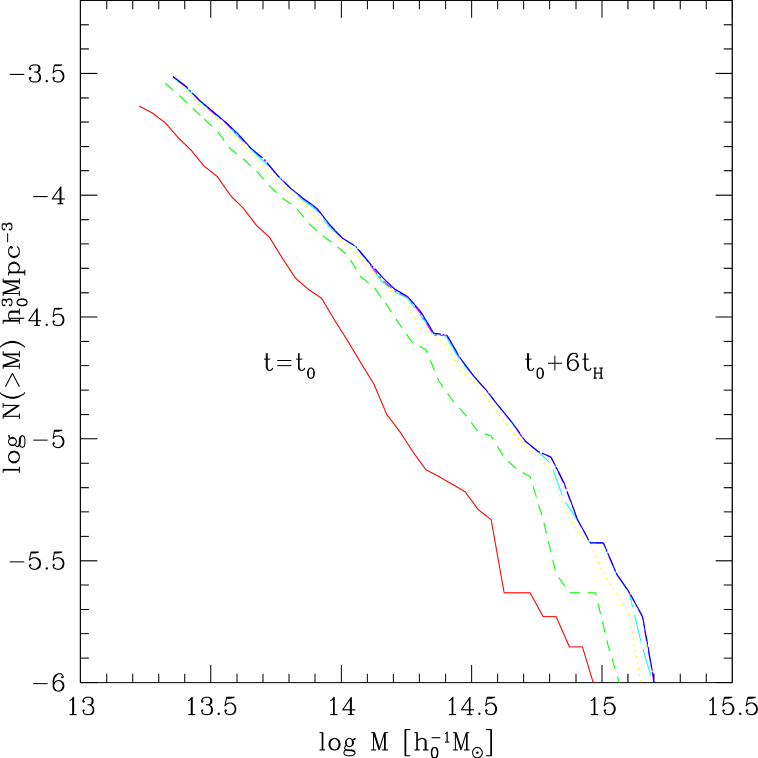
The lack of late evolution is even more apparent in the mass distribution of bound objects. Figure 2 shows the cumulative number of dark matter halos with mass above per comoving volume, N(). The dark matter halos are identified through the HOP grouping algorithm (Eisenstein & Hut, 1998) with the outer overdensity threshold of and the peak overdensity threshold of in comoving coordinates. From left to right, the lines refer to times (solid), (short-dashed), (dotted), (long-dashed), (dot-short dashed), (dot-long dashed), and (short dash - long dash), which correspond to scale factor values of , 2.5, 5.8, 13.5, 31.2, 72.0, and 166, respectively. The last four lines are almost identical within sampling errors, showing that the mass function freezes after two Hubble times from today and that mergers are very rare subsequently.
4 Gravitationally Bound Objects
Next we consider the interior overdensity threshold above which a shell of matter around a spherically symmetric object will remain bound to it at late times. In the absence of a cosmological constant and with no shell crossing, the threshold simply amounts to the kineticpotential energy of the shell being negative (Gunn & Gott, 1972). The existence of a cosmological constant makes the interior gravitating mass of the vacuum grow larger as the shell radius increases; consequently a shell with a negative energy today may still be pulled away from the object by the cosmic acceleration at late times. We would like to find the minimum mean interior overdensity today, , above which the shell will remain bound to the object at arbitrarily late times. Here , where is the mean density of matter in the Universe.
The critical mean overdensity interior to the shell radius, , was derived by Lokas & Hoffman (2002) in their equation (27). Taking the initial time as , this equation yields for the set of cosmological parameters adopted in this paper. We note that Lokas & Hoffman (2002) have ignored the possibility that the mass shell may have a nonzero initial peculiar velocity. For the growing mode of a density perturbation, the inward peculiar velocity will induce collapse at a lower initial overdensity than that found by Lokas & Hoffman (2002).
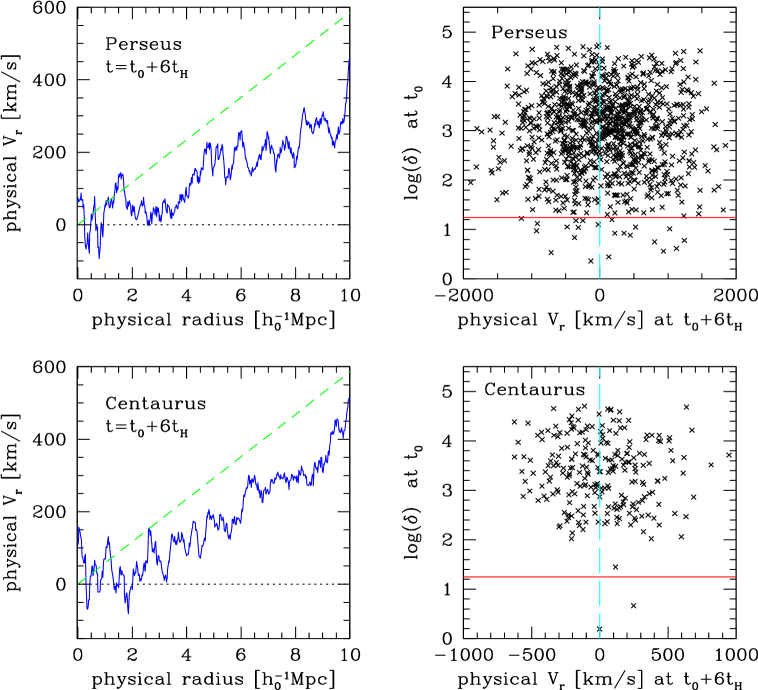
We have attempted to test the validity of the critical overdensity threshold with our N-body simulation. Figure 3 shows the physical radial velocity of particles in and around the two most massive objects in the simulation: Perseus and Centaurus clusters. For the HOP grouping parameter of (see § 3), the total grouped masses of Perseus and Centaurus are and at , and and at , respectively (see § 4 of Mathis et al. (2002) for a detailed comparison between the simulated and observed cluster properties). On the left column of Figure 3 we show the mean physical radial velocity of concentric shells around the density maximum as a function of their physical radius at . The short-dashed line indicates the Hubble law at , and the horizontal dotted line indicates zero velocity. Inside the radius of from the cluster center the velocity fluctuates around zero, implying that the particles have virialized. At larger radii, the velocity field approaches the Hubble flow (denoted by the dashed line). Because the physical radius of at corresponds to comoving , dark matter particles at that radius are still infalling towards the density peak and so the physical radial velocity does not perfectly match the Hubble flow.
On the right column of Figure 3 we have selected out all particles that are within a physical radius of around the density maximum at ; these particles can be regarded as bound and virialized based on the left column plots. We then trace back the overdensity that these particles had at , and plot it against the radial particle velocity at . Zero velocity is indicated by the vertical long-dashed line, and the critical overdensity is indicated by the solid horizontal line. For a small number of particles, the value of is an overestimate, probably due to them having inward initial peculiar velocities. On average, the analytic estimate for the critical overdensity based on the spherical tophat collapse model appears to provide a good approximation to the actual threshold.
5 Future Evolution of the Local Group
5.1 Will the Local Group Fall into Virgo?
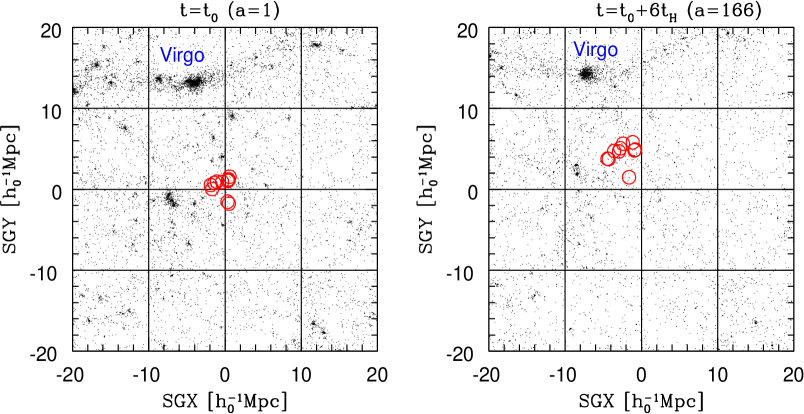
Although our simulation does not resolve the inner structure of the Local Group, we can get an idea about the future trajectory that its center-of-mass will follow by tracing the particles which reside near the supergalactic center at the present time. In Figure 4, we show the projection of a region with onto the supergalactic XY plane in a similar fashion to Figure 1. The density peak near the top of the panel is the Virgo cluster, which is separated by a comoving distance of from the supergalactic center. The observational estimates of the distance to the Virgo cluster from us by the methods of surface-brightness fluctuations, planetary nebula luminosity function, Tully-Fisher relation, and Cepheid variable stars, all agree with (e.g. Jacoby et al., 1992; Graham et al., 1999), in reasonable agreement with the simulated distance within .
We identified all particles enclosed within a sphere of radius around the supergalactic center at the present time as shown in the left panel of Figure 4). We have found 11 such particles (shown as the open circles), corresponding to a total mass of . For comparison, the Local Group has a zero-velocity surface (separating it from the Hubble expansion) of and a total mass of (Courteau & van den Bergh, 1999; van den Bergh, 1999) based on the radial velocity dispersion of its members. Initially, the sampled 11 particles have a mean peculiar velocity of at towards the direction of with respect to the cosmic microwave background (CMB) frame. For comparison, the observed motion of the Local Group relative to the CMB frame is in the direction of (Kogut et al., 1993). The agreement between the simulated and the observed velocity amplitude at is impressive given the crudeness of the initial conditions of the simulation; however, the direction of the velocity vector deviates somewhat from the observed orientation.
More recently, Tonry et al. (2000) used the results from the Surface Brightness Fluctuation Survey to model the local and large-scale flows. Their best-fit model includes two attractors, one of which having a best-fit location coincident with the Virgo cluster and the other having a fit location slightly beyond the Centaurus cluster (which is commonly referred to as the Great Attractor). Assuming an attenuated power-law mass distributions for the two attractors, their best-fit model has enclosed mass (in excess of background density) of for Virgo and for the Great Attractor within spheres centered on the attractors with radii reaching the Local Group. For comparison, the corresponding masses in our simulation are for the Virgo and for the Centaurus, in good agreement with the observational estimate by Tonry et al.
We follow the trajectories of the above 11 particles up to the time . The right panel of Figure 4 indicates that the particles have traversed a comoving distance of towards the direction of the Virgo cluster but have not fallen into it. The physical distance to Virgo (which is proportional to ) would increase exponentially at late times. Neighboring particles show a similar behavior, so this conclusion is not likely to be affected by the random sampling of particles from the original data set described in § 2. By , the peculiar velocity field at moderate overdensities is heavily damped (see § 3). Most of the displacement towards Virgo takes place by . Note that the Virgo cluster itself has also moved by a few comoving in response to the pull of the Great Attractor. We conclude that the Local Group will not be gravitationally bound to the Virgo cluster, given the initial conditions of the simulation that are matched to the observed galaxy distribution.
5.2 The Milky Way and the Andromeda Galaxies
The Local Group is a centrally concentrated system in which half of all members lie within of its center-of-mass. Most of the mass is concentrated in the Andromeda and the Milky Way subgroups. Unfortunately, the mass estimate of each subgroup suffers from large uncertainties. For example, the mass of the Andromeda subgroup ranges from a value of (Courteau & van den Bergh, 1999) to a lower estimate of (Evans et al., 2000). The mass of the Milky Way ranges from (Zaritsky, 1999) to a larger value of (Wilkinson & Evans, 1999). All of the existing estimates are consistent with each other to within the quoted errors. Under most estimates, the total mass of the Local Group is close to (van den Bergh, 1999).
We may evaluate the present-day overdensity of the Local Group, , using its total mass and the distance of (Binney & Merrifield, 1998) between the Milky Way and Andromeda, yielding . The present overdensity of the Local Group clearly exceeds the critical collapse threshold of .
Adopting the measured radial component of the relative velocity between the Andromeda and the Milky Way galaxies (Binney & Tremaine, 1987) and ignoring its tangential component, it can easily be shown that the total energy of the Local Group, , is negative, where is the reduced mass of the Andromeda and the Milky Way subgroups. This result is obtained for either of the latter or the former pair of mass values quoted above for and . The transverse component of the relative velocity is commonly assumed to be much smaller than the radial velocity (Einasto & Lynden-Bell, 1982). Based on the radial separation and the relative velocity between the two galaxies, one finds that they are likely to merge within a Hubble time. A pedagogical discussion on the dynamical evolution of the Local Group based on the least action principle can be found in Peebles (1993). Dynamical evaporation of stars out of the merger product can be neglected on the time-scale of interest here (Binney & Tremaine, 1987).
6 Conclusions & Discussions
We have simulated the future evolution of our cosmic neighborhood in a universe dominated by a cosmological constant using an N-body code and the initial conditions that were reconstructed from the observed galaxy distribution of the IRAS 1.2 Jy survey. We find that the large-scale structure and the mass distribution of bound objects will freeze in billion years from today due to the accelerated expansion of the Universe. The Local Group of galaxies will get somewhat closer to the Virgo cluster of galaxies in comoving coordinates, but will rapidly recede from Virgo in physical coordinates. However, the overdensity inside the Local Group is well above the required threshold () for it to resist the repulsive gravitational force of the cosmological constant. Therefore the Milky Way and the Andromeda galaxies are likely to merge within a Hubble time.
If the Universe is dominated by a cosmological constant, then the Local Group is detached from the rest of the Universe and the physical distance from us to all other systems that are not bound to the Local Group will increase exponentially with time in the distant future. Combining our simulations with the results of Loeb (2002), we predict that when the age of the Universe will be billion years, there will only be one massive galaxy for us to observe, namely the merger product of the Andromeda and the Milky Way galaxies. All other systems that are not gravitationally bound to the Local Group will exit through our event horizon and their images will fade rapidly while remaining frozen on the time of their exit.
The precision of our quantitative results is limited by the accuracy of the initial conditions of the simulation at compared to the true mass density field in the nearby universe. The locations of the simulated clusters of galaxies are shifted by a few megaparsec relative to the recent observational estimates, and in principle the match between the two can be improved in the future by refining the reconstruction method of the initial conditions of the simulation from the observational data. While we believe that the general predictions derived in this paper are independent of the limited mass and spatial resolution of our simulations, it would be appropriate to perform in the future higher-resolution simulations with improved initial conditions that match the observed galaxy distribution. Since the observational uncertainties in the distance measurements are still substantial, the precision of the observed galaxy distribution will also get better with future observations. The combination of both of the above improvements will allow us to make more accurate predictions for the future evolution of the nearby large-scale structure.
Acknowledgments
We are grateful to the authors of Mathis et al. (2002) paper and the GIF
(German-Israel Foundation) collaboration for allowing us to use
their simulation output as the initial condition of our simulation.
In particular, we thank Volker Springel for providing us with the data in a
convenient format for the GADGET code, as well as for clearing out some of
our technical problems and questions at the initial stage of this work.
This work was supported in part by the grants 5-7768 from NASA and
AST-9900877, AST-0071019 from NSF for AL.
References
- Aaronson, et al. (1982) Aaronson, M., et al. 1982, ApJ, 258, 64 (1982ApJ...258...64A)
- Binney & Merrifield (1998) Binney, J. & Merrifield, M. 1998, Galactic Astronomy, Princeton University Press, p. 436 (1998gaas.book.....B)
- Binney & Tremaine (1987) Binney, J. & Tremaine, S. 1987, Galactic Dynamics, Princeton University Press, p. 491, 596 (1987gady.book.....B)
- Capaccioli et al. (1990) Capaccioli, M., Cappellaro, E., della Valle, et al. 1990, ApJ, 350, 110 (1990ApJ...350..110C)
- Courteau & van den Bergh (1999) Courteau, S. & van den Bergh, S. 1999, AJ, 118, 337 (1999AJ....118..337C)
- Davis & Peebles (1983) Davis, M. & Peebles, P. J. E. 1983, ARA&A, 21, 109 (1983ARA&A..21..109D)
- de Bernardis et al. (2000) de Bernardis, P., et al., 2000, Nat, 404, 955 (2000Natur.404..955D)
- Einasto & Lynden-Bell (1982) Einasto, J. & Lynden-Bell, D. 1982, MNRAS, 199, 67 (1982MNRAS.199...67E)
- Eisenstein & Hut (1998) Eisenstein, D. J. & Hut, P. 1998, ApJ, 498, 137 (1998ApJ...498..137E)
- Evans et al. (2000) Evans, N. W., Wilkinson, M. I., Guhathakurta, P., Grebel, E. K., & Vogt, S. S. 2000, ApJl, 540, L9 (2000ApJ...540L...9E)
- Fisher et al. (1995) Fisher, K. B., Huchra, J. P., Strauss, M. A., Davis, M., Yahil, A., & Schlegel, D. 1995, ApJS, 100, 69 (1995ApJS..100...69F)
- Fisher et al. (1994) Fisher, K. B., Davis, M., Strauss, M. A., Yahil, A., Huchra, J. P. 1994, MNRAS, 267, 927 (1994MNRAS.267..927F)
- Garnavich et al (1998) Garnavich, P. M., et al. 1998, ApJ, 509, 74 (1998ApJ...509...74G)
- Graham et al. (1999) Graham, J. A., Ferrarese, L., Freedman, W. et al. 1999, ApJ, 516, 626 (1999ApJ...516..626G)
- Gudmundsson & Björnsson (2002) Gudmundsson, E. H. & Björnsson, G. 2002, ApJ, 565, 1 (2002ApJ...565....1G)
- Gunn & Gott (1972) Gunn, J. E. & Gott III, J. R. 1972, ApJ, 176, 1 (1972ApJ...176....1G)
- Hanany et al. (2000) Hanany, S., et. al, 2000, ApJL, 545, L5 (2000ApJ...545L...5H)
- Jacoby et al. (1992) Jacoby, G. H., et al. 1992, PASP, 104, 599 (1992PASP..104..599J)
- Kogut et al. (1993) Kogut, et al. 1993, ApJ, 419, 1
- Loeb (2002) Loeb, A. 2002, Phys. Rev. D65, 047301 ()
- Lokas & Hoffman (2002) Lokas, E. L. & Hoffman, Y. 2002, submitted to MNRAS (astro-ph/0108283)
- Lynden-Bell, et al. (1988) Lynden-Bell, D., et al. 1988, ApJ, 326, L19 (1988ApJ...326...19L)
- Mathis et al. (2002) Mathis, H., Lemson, G., Springel, V., Kauffmann, G., White, S. D. M., Eldar, A., & Dekel, A. 2002, MNRAS, 333, 739 (2002MNRAS.333..739M)
- Peacock et al. (2001) Peacock, J. A., et al. 2001, Nat, 410, 169 (2001Natur.410..169P)
- Peebles (1993) Peebles, P. J. E. 1993, Principles of Physical Cosmology, Princeton University Press, p. 483–490 (1993ppc..book.....P)
- Perlmutter et al. (1998) Perlmutter, S., et al., 1999, ApJ, 517, 565 (1999ApJ...517..565P)
- Riess et al. (1998) Riess, A. G., et al. 1998, AJ, 116, 1009 (1998AJ....116.1009R)
- Springel, Yoshida, & White (2001) Springel, V., Yoshida, N., & White, S. D. M. 2001, New Astronomy, 6, 79 (2001NewA....6...79S)
- Starobinsky (2000) Starobinsky, S. S. 2000, Grav. Cosmol., 6, 157 ()
- Tonry et al. (2000) Tonry, J. L., Blakeslee, J. P., Ajhar, E. A., & Dressler, A. 2000, ApJ, 530, 625 (2000ApJ...530..625T)
- van den Bergh (1999) van den Bergh, S. 1999, A&ARv, 9, 273 (1999A&ARv...9..273V)
- Verde et al. (2002) Verde, L., et al. 2002, MNRAS, 335, 432 (2002MNRAS.335..432V)
- Wilkinson & Evans (1999) Wilkinson, M. I. & Evans, N. W. 1999, MNRAS, 310, 645 (1999MNRAS.310..645W)
- Willick et al. (1995) Willick, J.A., Courteau, S., Faber, S. M., Burstein, D., & Dekel, A. 1995, ApJ, 446, 12
- Willick et al. (1996) Willick, J.A., Courteau, S., Faber, S. M., Burstein, D., Dekel, A., & Kolatt, T. 1996, ApJ, 457, 460
- Willick et al. (1997) Willick, J.A., Courteau, S., Faber, S. M., Burstein, D., Dekel, A., & Strauss, M. A. 1997, ApJS, 109, 333
- Zaritsky (1999) Zaritsky, D. 1999, The Galactic Halo, eds. Gibson, B.K., Axelrod, T.S., & Putman, M.E. ASP Conference Series Vol.165, p.34 (1999gaha.conf...34Z)