Multiple delays in QSO 0957+561: observational evidence and interpretation
Abstract
Q0957+561A,B is a double-imaged quasar that has been intensively observed during the last 10 years in different optical bands and with several telescopes, and we concentrated on recent public data obtained at the Apache Point Observatory (APO) and the Teide Observatory (TO). When an intrinsic event appears in the light curve of Q0957+561A, its twin event (a similar feature) is seen in the brightness record of Q0957+561B, and thus, one can measure the corresponding time delay. The TO dataset includes two prominent twin events, which were detected with a time separation of 425 4 days. On the other hand, from the APO dataset, we found a clear evidence for two different time delays associated with two pairs of twin events: 417.0 0.6 (APO main twin events) and 432.0 1.9 days (APO secondary twin events), where the APO(main)–APO(secondary) difference delay is of 15 2 days. In agreement with the Yonehara’s idea, if the three pairs of twin events are originated inside a standard hybrid source (accretion disk and circumnuclear stellar region), the three measured time delays indicate that they do not come from a common zone in the source. Therefore, we can consider that the prominent features are caused by flares in a standard hybrid source and discuss on the size and nature of the region of flares. In this paper it is showed that the more plausible interpretation is that two of the three flares are generated at distances (from the central black hole) larger than 90 pc. Some stellar scenarios can explain the two flares far away from the black hole, while phenomena in the accretion disk cannot cause them.
keywords:
gravitational lensing – quasars: general – quasars: individual: QSO 0957+5611 Introduction
The observed optical luminosity of QSOs is probably generated in a source including an accretion disk around a supermassive black hole and a circumnuclear stellar region (e.g., Umemura, Fukue & Mineshige 1997, and references therein). Therefore, some kind of intrinsic variability could be due to local and violent physical phenomena (flares) taking place in the accretion disk (e. g., hot-spots) or in the innermost stellar region (e. g., star bursts). These two standard regions for flares have very different sizes, and thus, if we were able to map several locations of flares within a source QSO, we would measure the size of the RF (region of flares) and determine the environment in which the local and violent variability is originated (Yonehara 1999). A standard accretion disk has a radius of the order of 10-2 pc, whereas the innermost stellar region may be extended as far as 102-103 pc.
In a pioneer work, Yonehara (1999) has suggested a way to map the positions of the intrinsic flares in a gravitationally lensed quasar. For a double-imaged QSO, with optical images A and B, there is a time delay between a given intrinsic event in image A and its twin event (a similar feature) in image B. However, if the optical variability is generated in different points of a source with finite size, it must be not expected a unique time delay for different pairs of twin events. So, the discovery of multiple delays in a double QSO indicates the presence of twin events induced by flares, and the time delay distribution must inform us about the size and nature of the RF. In this paper (Section 2), we searched for multiple delays in the light curves of the lensed quasar Q0957+561A,B. The light curves of both images in this gravitational mirage show variability on very different timescales, but we concentrated on the well-sampled intrinsic events with an amplitude of about 100 mmag and lasting several months ( 100-300 days), which were recently found by Kundić et al. (1995, 1997) and Serra-Ricart et al. (1999).
In Section 3, we interpret the results derived from the careful analysis of the best available optical light curves of Q0957+561A,B. Finally, we summarize our conclusions in Section 4. Scenarios for flares as diverse as accretion disk instabilities, disruption of stars in the gravitational field of a supermassive black hole, stellar collisions or violent stellar evolution are also put in perspective in this last section (see Cid Fernandes, Sodré & da Silva 2000, and references therein).
2 Time delay(s) between the components A and B of QSO 0957+561
2.1 Historical background and description of the data
The two optical components of QSO 0957+561 have been monitored during about 20 years (Lloyd 1981; Keel 1982; Florentin-Nielsen 1984; Schild & Cholfin 1986; Vanderriest et al. 1989; Schild 1990; Schild & Thomson 1995; Kundić et al. 1995; 1997; Serra-Ricart et al. 1999; Oscoz et al. 2001; Slavcheva-Mihova, Oknyanskij & Mihov 2001), and the datasets inferred from the observations have been usually analyzed from standard techniques, which look for a unique time delay between Q0957+561A and Q0957+561B. However, only if all features come from a common zone in the source (or the emitting points are included within a very small region), we can properly speak of a well-defined time delay. The use of a standard procedure, in general, leads to an effective time delay that will correspond to either the time delay associated with the dominant twin features or the average of several time delays associated with several pairs of twin features in the light curves of the system.
The best available optical light curves, in terms of sampling rate, signal-to-noise ratio and intrinsic character, were obtained by Kundić et al. (1995, 1997) and Serra-Ricart et al. (1999), and these trends could shed light on the existence of a well-defined delay (when there are no discrepancies between time delays for different pairs of twin events or the possible discrepancies cannot be resolved) or the opposite case. Thus, we concentrate our attention on the events with a width of 100-300 days and an amplitude of about 100 mmag (sharp features with high signal-to-noise ratio), which are included in the brightness record obtained at the Apache Point Observatory (APO) and the Teide Observatory (TO) for the period 1995-1998. Another large dataset compiled by R. Schild shows clear evidences in favor of extrinsic variability (Schild 1996), and therefore, we avoid this dataset. We remark that Schmidt & Wambsganss (1998) and Gil-Merino et al. (2001) have not found reliable microlensing imprints in the records of brightness by Kundić et al. (1995, 1997) and Serra-Ricart et al. (1999), respectively, although Schmidt & Wambsganss (1998) showed a difference light curve with an anomaly during the central dates which is directly related with the subject of this paper (a group of data is slightly but coherently above the zero-line and the next group of data is coherently below the zero-line).
2.2 First evidence for multiple delays
The observations carried out at TO from 1996 through 1998 (in the band) were used to compare the light curves of images A and B and obtain effective time delays using pairs of seasons (Serra-Ricart et al. 1999). In principle, two comparisons are possible: 1996(A)-97(B) seasons and 1997(A)-98(B) seasons, but the signal-to-noise ratio in the first pair was very small, and only the two twin features seen in the last pair (with an amplitude of 120 mmag and a duration of about 300 days; see Serra-Ricart et al. 1999; Gil-Merino et al. 2001) can be seriously considered to measure an accurate time delay. Using the data included in this last pair of seasons and the -test, Serra-Ricart et al. (1999) derived a reliable delay of 425 4 days (1 ). As they basically compared two twin events, we do not consider their detection as an effective delay but the time delay between the quoted prominent features. So, taking into account the TO events with 2.5 (we define the signal-to-noise ratio as the ratio between the semi-amplitude of the events and the mean photometric error), it is inferred an optimal delay of 425 days. We remark that brightness records with 1 are not suitable for measuring time delays, because the techniques fail in this situation. With regard to this issue, the section 3 of Pijpers (1997) is very instructive. In order to infer reliable delays, it seems reasonable to work with signals characterized by 2.
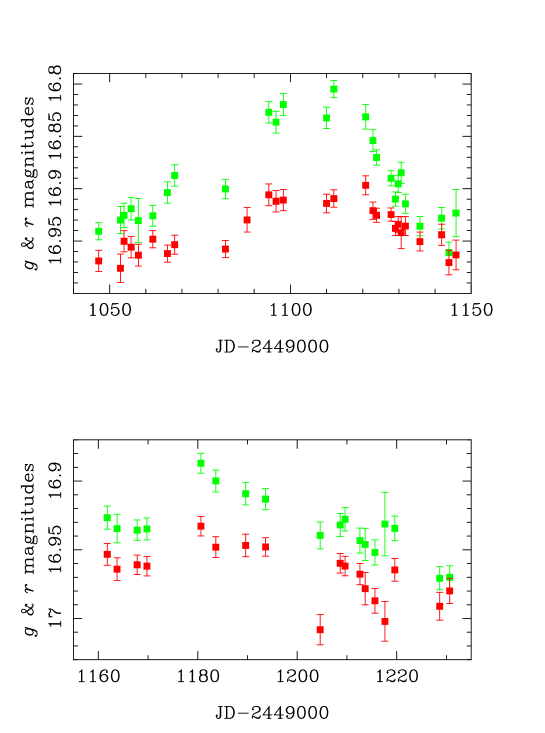
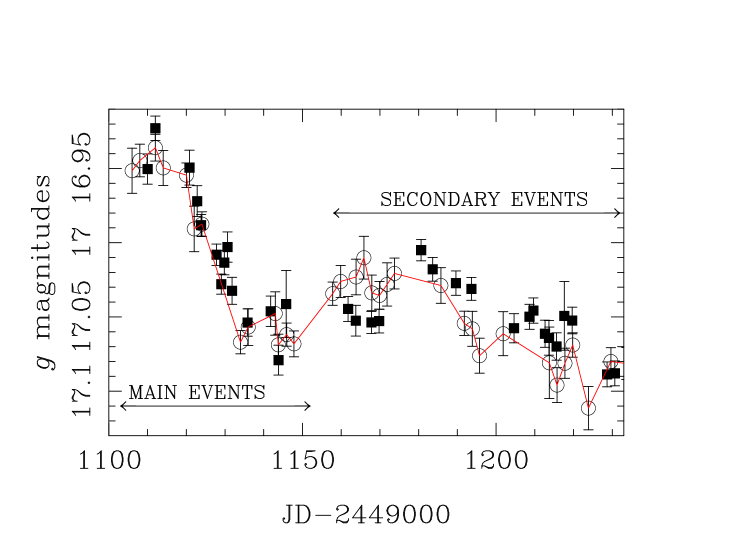


On the other hand, CCD images of Q0957+561A,B were taken with the APO 3.5 m telescope in the and bands, during the 1995 and 1996 seasons (Kundić et al. 1995, 1997). The light curve of the image A in the first season () exhibited a significant variability. In particular, included a sharp drop of about 100 mmag in 1994 December (data in encompass 6 months of observations between 1994 December 2 and 1995 May 31), which represents the second half of a whole event. The twin event of this feature in was observed in the light curve of the image B during the 1996 season (). In the band, the twin event is characterized by an amplitude and a width of 130 mmag and about 100 days, respectively. Just after these two APO main events in and , we can find other two sharp twin features. The APO secondary events have a duration slightly less than the main ones and an amplitude of 50-70 mmag in the band. Fig. 1 shows the main event (top panel) and the secondary event (bottom panel) in . The data in the band (light filled squares) and in the band (dark filled squares) are depicted. We note the high signal-to-noise ratios in the band: 6.5 in the main event and 3 in the secondary one. The value in the secondary events is similar to the value in the main features. The secondary events in the band are very noisy. Using and in the band, and three different techniques to infer the effective time delay (linear interpolation, optimal reconstruction and dispersion spectrum), Kundić et al. (1997) derived a best value of 417 days. Fig. 2 displays together (open circles) and (filled squares) in the band. was shifted by a time delay of 417 days, while was shifted by an optimal magnitude offset of 118 mmag (see Kundić et al. 1997). Only the main overlaping region of and is showed, i.e., that one including the two pairs of twin features, and to guide the eye, a line joins the data for the A component. One sees in Fig. 2 an excellent agreement between the APO main twin features (from day 1100 to day 1150) as well as an with regard the two APO secondary events. The secondary event in the flux of image A is not aligned with the secondary one in the flux of image B, or in other words, the secondary event in the time-shifted (+ 417 days) seems still delayed with respect to its twin event in . As an additional problem, the best solution for the delay from TO data (425 days) is out of the 95 per cent confidence interval claimed by Kundić et al. (1997): 417 3 days. From another point of view, the solution of 417 days is in clear disagreement with the TO photometry (see Fig. 16 in Serra-Ricart et al. 1999).
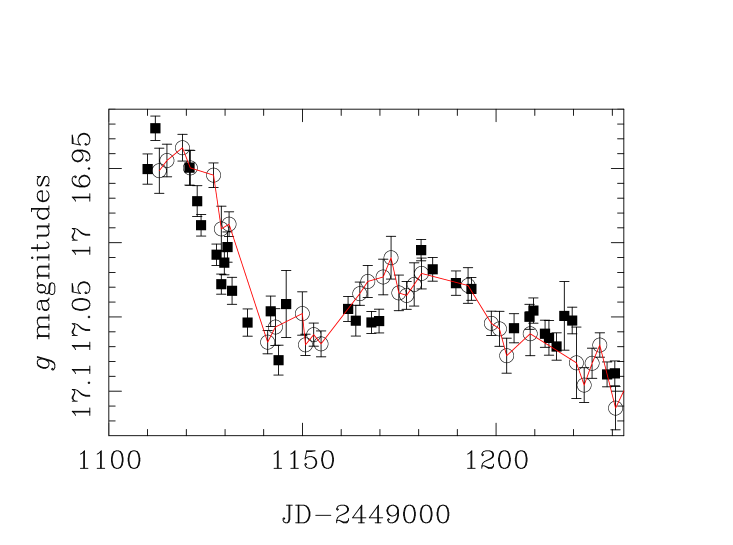
The three methods used by Kundić et al. (1997) to infer an optimal effective time delay of 417 days, seem very sensitive to the two main features. In a manner of speaking, these classical methods forget the rest of data, and we need to find some discrete technique to compare all information in both brightness records. The discrete cross-correlation method has several variants which may be sensitive to the whole light curves, and we choose the -test (e.g., Serra-Ricart et al. 1999), in which the shifted discrete autocorrelation function () is matched to the discrete cross-correlation function (). From the -test we infer optimal effective time delays of 424 days (using bins with size of 5 days) and 422 days (using bins with size of 15 days), both in agreement with the measurement from TO data. We note that the TO data were studied with a relatively poor time resolution (bins with size of 40 days), while we analyzed the APO data with a good time resolution: smoothing size of 5–15 days. In Fig. 3 (top panel) the for the A component shifted by 424 days (open circles) and the (filled circles) are presented. In this vs. comparison we used bins with size of 5 days (results with the best time resolution). Using bins with size of 5 days (solid line) and 15 days (dashed line), possible values of the effective time delay () versus the associated values, normalized by its minimum value , have been also plotted in Fig. 3 (bottom panel). As it was already mentioned, the new optimal values close to 425 days are in good agreement with the measurement made by the IAC group. However, is there a good alignment between twin features?. To answer this question we have redrawn in Fig. 4 the combined photometry of Q0957+561A,B for the 1995-96 seasons in the band, but shifting by a time delay of 424 days. We conclude that an effective delay of 424 days is not able to align neither the APO main events nor the APO secondary events, although this larger value can be considered as the estimate of an average time delay. The 424 days solution leads to some discrepancies whose imprints can be seen in the top panel of Fig. 3 (e.g., there is a clear lag between the ”humps” to the right of the central peaks). Only the existence of two different delays can lead to the alignment of both pairs of twin events.
2.3 Detection of multiple delays
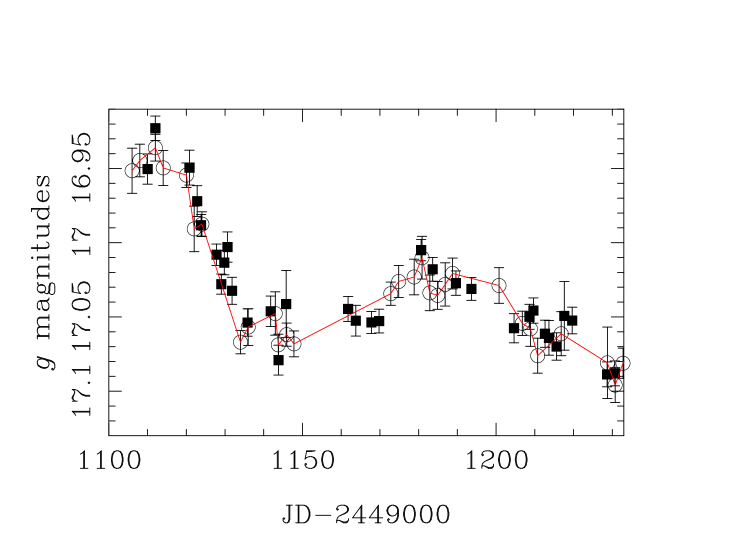
Our last task must be to obtain, in a consistent way, the time delay between the APO main events and the time delay between the APO secondary events. From the data included in the sharp drop of the main events, we make a first function. Moreover, using the data corresponding to the secondary events, we do a second -test. The two new functions together with the function inferred from all data (see bottom panel of Fig. 3) are showed in Fig. 5. When we only take data corresponding to the main events, we obtain a narrow peak in and recover the expected result of a delay of 417 days, whereas if only data in the secondary events are used, then another narrow peak centered on 432 days is derived. In Fig. 6, we draw our best solution for the 1995-96 seasons in the band: the first part of is shifted by + 417 days (main drop) and the second part is shifted by + 432 days (secondary event). Finally, to sum up, a time delay of 425 4 days explains the signal recorded at Teide Observatory in the band (two twin events with a relatively long time-scale of about 300 days), while a unique time delay does not align the two pairs of twin events detected at Apache Point Observatory in the band. From the APO light curves, a double time delay of 417.0 0.6 days (for the main features) and 432.0 1.9 days (for the secondary events) is favored, and thus, three different delays are detected from APO/TO data (the APO/Main-APO/Secondary difference delay is of 15.0 2.0 days, the APO/Main-TO difference delay is of 8.0 4.0 days and the APO/Secondary-TO difference delay is of 7.0 4.4 days; see Table 1).
| Events | Delay (days) | APO-APO difference delay (days) | APO-TO difference delay (days) | |
|---|---|---|---|---|
| Main | 6.5 | 417.0 0.6 | 15.0 2.0 | 8.0 4.0 |
| Secondary | 3.0 | 432.0 1.9 | 15.0 2.0 | 7.0 4.4 |
We computed 1 uncertainties (68.3 per cent confidence limits) for the time delays inferred from the -test. Each 1 confidence interval was derived through intensive simulations: we made possible underlying signals which are consistent with the observed light curve of the image A, and possible underlying brightness trends of the image B (in agreement with the photometric behaviour of this image). From the pairs of possible underlying signals, we can estimate time delays (using the -test), and therefore, the distribution of delays and the standard confidence interval. The whole procedure is similar to the methodology used by Serra-Ricart et al. (1999). By means of intensive simulations, other studies are also interesting and viable. For example, from the APO main twin events, we found that 99.9 per cent of the delays are included in the range 417 2 days. On the other hand, from the APO secondary twin events, the delay distribution is broader. However, a delay 425 days has a probability higher than 99 per cent. So, we unambiguously found two different time delays in the APO light curves.
3 Interpretation of the results
We assume that the observed optical luminosity of QSO 0957+561 is due to a standard hybrid source (accretion disk and circumnuclear stellar region), and consequently, exotic sources are not taken into account in this paper (e.g., two accretion disks around two close supermassive black holes). The total luminosity is the superposition of a dominant non-variable ”background” component and a variable part, where the background luminosity is mainly originated in either the full accretion disk or the full stellar environment, and the QSO variability can be made by flares or another kind of activity. In this scenario, the APO/TO events must be caused by flares in the source QSO.
If the source centre is placed at an angular position , the time delay between its images A (at ) and B (at ) is given by (e.g., Schneider, Ehlers & Falco 1992)
| (1) |
where = / (, and are the angular diameter distances from us to the lens, from us to the source and from the lens to the source, respectively), is the velocity of light in vacuum, is the redshift of the lens and is the deflection potential, which is directly related to the scaled deflection angle : = . However, when a flare occurs, the corresponding signal originated at an angular position will be gravitationally lensed at and . Therefore, from Eq. (1), considering an expansion up to the first order in the angular displacements (, , ) and the lens equation ( = = ), we infer the time delay difference
| (2) |
Using the distance displacement in the source plane = , Eq. (2) can be rewritten as
| (3) |
Eq. (3) has two remarkable aspects. Firstly, the time delay difference does not depend on the lens model (the distribution of mass in the lens). This property is very important to do robust estimates with complex lenses as the galaxy + cluster system in QSO 0957+561. Secondly, the time delay differences are only useful to map the projections of the relative positions of flares on the direction (see also Yonehara 1999).
In a cosmology with = 0 and = 1, the observational parameters = 0.36, = 1.41 (the redshift of the source) and = 6”.1 lead to
| (4) |
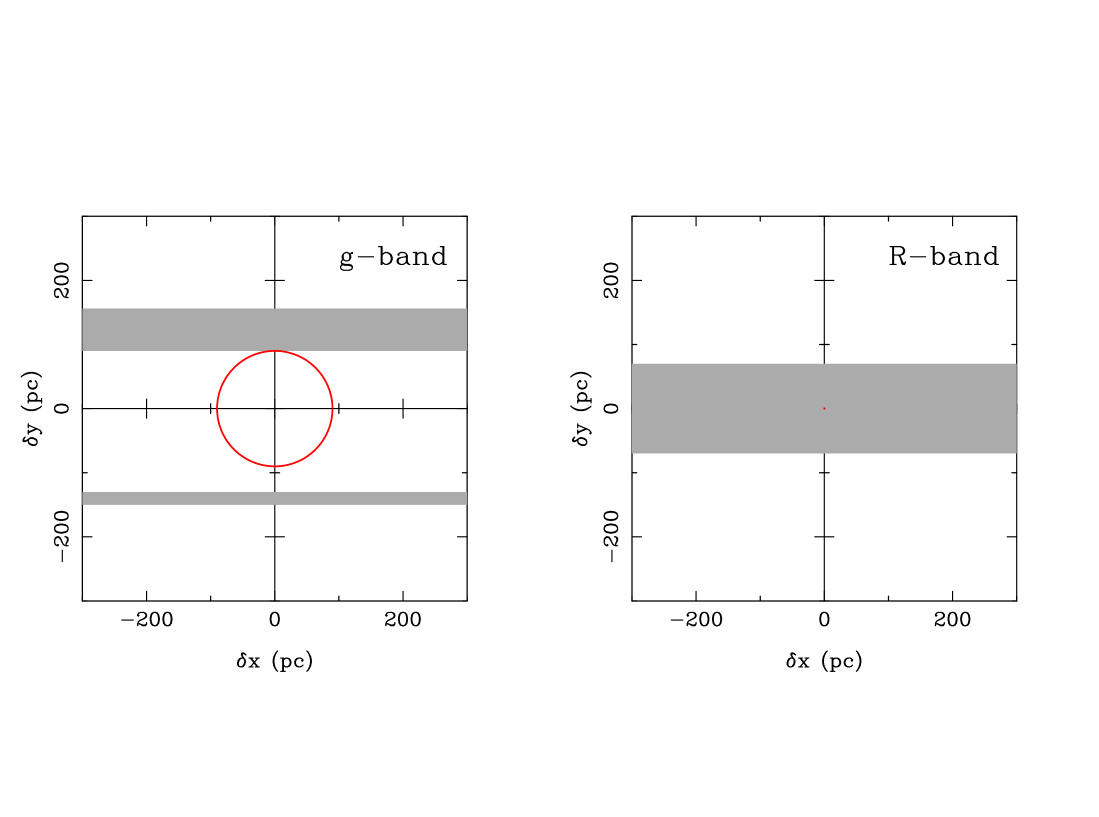
being = /. Here, the -axis is parallel to , while the -axis is perpendicular to this privileged direction of the gravitational mirage. A more realistic cosmology (e.g., Wang et al. 2000) could be suitable to obtain very refined estimates, but in this first approach to the problem, our aim is not so ambitious. We wish to obtain some robust bound on the size of the region associated with the flares inducing the prominent APO/TO events. The three time delays claimed in Section 2 suggest a time delay of 425 days for hypothetical signals emitted from the source centre (the average of all delays), as well as time delay differences of = 8.0 0.6 days (APO main events), = 7.0 1.9 days (APO secondary events) and = 0 4 days (TO events). From Eq. (4), it is easy to derive the projected relative positions (): 140 10, 123 33 and 0 70 pc. We ignore the components corresponding to the three flares, however, the information on the components is sufficient to reach important conclusions. Fig. 7 presents the possible relative positions of the flares (shading rectangles). The rectangles corresponding to the two -band flares are depicted in the left panel, while the rectangle drawn in the right panel is associated with the -band flare. A circle with a radius of 90 pc is also shown in the left panel of Fig. 7. A region of flares with outer radius less than 90 pc is in disagreement with all possible relative positions of the g-band flares, and the two far flares were probably generated at distances of 100-200 pc from the central black hole. This result indicates that at least two flares are related to a stellar environment. On the other hand, the -band flare might be produced far from the central engine, and thus it could be also related to the stellar ring. However, we cannot decide on this issue.
4 Conclusions and discussion
Using the best available optical light curves of Q0957+561A,B, which contain three pairs of twin events with significant signal-to-noise ratio ( 2.5), we found a clear evidence for three different time delays. As far as we know, this is the first detection of multiple delays in a double-imaged QSO. Our analysis based on data of a lens system sampled during many years could be extended to other lens systems in a near future.
We concentrated on relatively violent events with an amplitude of 100 mmag (a fluctuation of 0.1 mag represents a relative fluctuation in flux of 10 per cent) and a duration of 100-300 days. If these events are originated inside a standard hybrid source (accretion disk and circumnuclear stellar region), the observed time delay multiplicity suggests that they do not come from a common zone in the source (Yonehara 1999). So, the studied events may be related to violent and local physical phenomena (flares). Accepting the hypothesis of events caused by flares in a standard hybrid source, in Sect. 3 we discussed on the size and nature of the region of flares. In particular, it is showed that two of the three flares must be generated at distances (from the central black hole) larger than 90 pc. Therefore, taking into account that the radius of a typical accretion disk is of 10-2 pc, accretion disk instabilities or collisions of stars with the black hole + hot disk complex (e.g., Haardt, Maraschi & Ghiselini 1994; Kawaguchi et al. 1998; Ayal, Livio & Piran 2000) can be discarded as candidates to these two flares far away from the black hole. However, in principle, the observed flux variability may be due to either stellar collisions in dense clusters separated from the centre (e.g., Courvoisier, Paltani & Walter 1996) or the violent evolution of stars in the circumnuclear stellar region (e.g., Aretxaga, Cid Fernandes & Terlevich 1997). A more complex scenario, involving star-gas encounters in a extended gaseous disk or bar, is also possible.
We can roughly estimate the rest-frame -band energy released in the flare related to the main events in the -band APO data, and compare it with the rest-frame -band energy released in a typical event occuring in a given stellar scenario. To do the estimation/comparison we followed several steps. Firstly, from the light curve of the image A in the first season (), it is deduced a -band background of = 17.08 mag. We transformed this -band background component to a -band background contribution using the color and the equations of Kent (1985). The magnitude can be then converted to a monochromatic flux (4400 Å) using standard laws (e.g., Allen 1973; Henden and Kaitchuck 1990; Léna, Lebrun & Mignard 1998). The relevant flux, , may be found by multiplying the monochromatic flux by the -correction (e.g., Schmidt & Green 1983). Thus, 10-15 erg cm-2 s-1 Å-1. Secondly, using the luminosity distance , one obtains: , where is the background intrinsic luminosity (at 4400 Å) and is the extinction-magnification factor. This last factor is due to both the magnification of the light from image A by the lens, and the extinction by dust in the lens galaxy, the Milky Way and so on. The magnification can be easily obtained, whereas it is difficult to estimate the total extinction. In a cosmology with = 0, = 1 and = 100 km s-1 Mpc-1, we inferred 3 1042 erg s-1 Å-1. Thirdly, the observed event has a duration of = 100 days and an effective (top hat) amplitude of = 0.07 mag. We assumed that 0.07 mag and found an intrinsic luminosity of the associated flare given by 2 1041 erg s-1 Å-1. Taking 1, a time scale of 40 days, and a width of the filter’s bandpass of 1000 Å, the rest-frame -band energy released in the flare will be erg. Finally, we compared the result on with the energy released in a supernova explosion and in a head-on stellar collision. The mean rest-frame -band energy released in a SN explosion is of 0.5 1051 erg (Aretxaga, Cid Fernandes & Terlevich 1997). On the other hand, the energy released in a collision of two solar-mass stars with a velocity parameter will be of erg (Courvoisier, Paltani & Walter 1996). Therefore, the value of agrees with the energy released in a supernova explosion and in a relativistic stellar collision ( 0.1), and a stellar collision at moderate velocities () cannot produce so high energy in the rest-frame band.
For Seyfert nuclei, the isolated SN events have a characteristic time-scale of 300 days. However, the evolution of SNs in QSOs can be very much faster, with time-scales of 10 days (see Aretxaga, Cid Fernandes & Terlevich 1997). So, the time-scale and the energy corresponding to the -band flares agree with the expected ones in a starburst scenario. On the other hand, for QSO 0957+561, a picture including only a starburst nucleus or ring has one difficulty. Kawaguchi et al. (1998) claimed that the measured slope of the first-order structure function is in clear disagreement with the pure starburst model. However, as it was remarked by Kawaguchi et al. (1998), the assumption of either a realistic shape of each SN event or a hybrid scenario could conciliate the existence of supernova explosions and the observed structure function. Moreover, the observational sampling was not taken into account in the simulations, and the observed structure function included observational noise, which was absent in model calculations.
Very recently, Collier (2001) found evidence for accretion disk reprocessing in QSO 0957+561. He compared the two events depicted in the top panel of Fig. 1 (the -band APO main event and the -band APO main event in ) and obtained that the event in the band lags the event in the band by 1 day. This non-zero chromatic lag seems to support a reverberation within an accretion disk, and therefore, flares originated at points very close to the black hole. The result disagrees with our suggestion about the origin of the flare related to the APO main events in the band, but with regard to this discrepancy, we must do a remark. The detection of a non-zero lag is only based in an interpolated cross-correlation method. Another discrete technique () led to an 1 interval including a lag equal to zero. In any case, we can conciliate the claim by Collier (2001) and the measured delays in a simple way. The -band APO main events could come from a flare in the hot disk, with the other two flares (which generated the -band APO secondary events and the -band TO events) having a stellar origin and typical time delay differences of 8 and 15 days. In this new scheme, the projected (on a direction joining both images of the QSO) relative positions of the two stellar flares are = 140 pc and = 263 pc. However, the solution to the possible conflict is not very comfortable. As the direction defined by the vector is not a privileged one in relation to the physics of the source (obviously, it is a privileged direction of the gravitational mirage), there is an apparent bias in the 2D distribution of stellar flares: the two flares are produced in the semicircle defined by . Of course the statistic is very poor with only a few flares, and we must analyze new monitoring campaigns to find more flares and a reliable estimate of the time delay associated with hypothetical signals from the centre of the source.
Acknowledgments
I am grateful to Atsunori Yonehara and Joachim Wambsganss for interesting discussions during the GLITP Workshop held at the Instituto de Astrofisica de Canarias (IAC). I also acknowledge the anonymous referee for criticisms that helped improve the paper. This work was supported by Universidad de Cantabria funds, the DGESIC (Spain) grant PB97-0220-C02 and the Spanish Department of Science and Technology grant AYA2001-1647-C02.
References
- [] Allen, C.W., 1973, Astrophysical Quantities, The Athlone Press, London, p. 196
- [] Aretxaga, I., Cid Fernandes, R., Terlevich, R., 1997, MNRAS, 286, 271
- [] Ayal, S., Livio, M., Piran, T., 2000, ApJ, 545, 772
- [] Cid Fernandes, R., Sodré Jr., L., Vieira da Silva Jr., L., 2000, ApJ, 544, 123
- [] Collier, S., 2001, MNRAS, 325, 1527
- [] Courvoisier, T.J.-L., Paltani, S., Walter, R., 1996, A&A, 308, L17
- [] Florentin-Nielsen, R., 1984, A&A, 138, L19
- [] Gil-Merino, R., Goicoechea, L.J., Serra-Ricart, M., Oscoz, A., Alcalde, D., Mediavilla, E., 2001, MNRAS, 322, 397
- [] Haardt, F., Maraschi, L., Ghisellini, G., 1994, ApJ, 432, L95
- [] Henden, A.A., Kaitchuck, R.H., 1990, Astronomical Photometry, Willmann-Bell, Richmond, p. 50
- [] Kawaguchi, T., Mineshige, S., Umemura, M., Turner, E.L., 1998, ApJ, 504, 671
- [] Keel, W.C., 1982, ApJ, 255, 20
- [] Kent, S.M., 1985, PASP, 97, 165
- [] Kundić, T., Colley, W. N., Gott III, J. R., et al., 1995, ApJ, 455, L5
- [] Kundić, T., Turner, E. L., Colley, W. N., et al., 1997, ApJ, 482, 75
- [] Léna, P., Lebrun, F., Mignard, F., 1998, Observational Astrophysics, A&A Library, Springer-Verlag, Heidelberg, p. 90
- [] Lloyd, C., 1981, Nature, 294, 727
- [] Oscoz, A., Alcalde, D., Serra-Ricart, M., Mediavilla, E., et al., 2001, ApJ, 552, 81
- [] Pijpers, F.P., 1997, MNRAS, 289, 933
- [] Schild, R. E., 1990, AJ, 100, 1771
- [] Schild, R. E., 1996, ApJ, 464, 125
- [] Schild, R. E., Cholfin, B., 1986, ApJ, 300, 209
- [] Schild, R. E., Thomson, D. J., 1995, AJ, 109, 1970
- [] Schmidt, M., Green, R. E., 1983, ApJ, 269, 352
- [] Schmidt, R., Wambsganss, J., 1998, A&A, 335, 379
- [] Schneider, P., Ehlers, J., Falco, E.E., 1992, Gravitational Lenses, A&A Library, Springer-Verlag, Heidelberg
- [] Serra-Ricart, M., Oscoz, A., Sanchis, T., Mediavilla, E., Goicoechea, L. J., Licandro, J., Alcalde, D., Gil-Merino, R., 1999, ApJ, 526, 40
- [] Slavcheva-Mihova, L.S., Oknyanskij, V.L., Mihov, B.M., 2001, ApSS, 275, 385
- [] Umemura, M., Fukue, J., Mineshige, S., 1997, ApJ, 479, L97
- [] Vanderriest, C., Schneider, J., Herpe, G., Chevreton, M., Moles, M., Wlérick, G., 1989, A&A, 215, 1
- [] Wang, L., Caldwell, R.R., Ostriker, J.P., Steinhardt, P.J., 2000, ApJ, 530, 17
- [] Yonehara, A., 1999, ApJ, 519, L31