Chandra Study of Young Stellar Objects in the NGC 1333 Star-forming Cloud
Abstract
NGC 1333, a highly active star formation region within the Perseus molecular cloud complex, has been observed with the ACIS-I detector on board the Chandra X-ray Observatory. In our image with a sensitivity limit of erg s-1, we detect 127 X-ray sources, most with sub-arcsecond positional accuracy. While 32 of these sources appear to be foreground stars and extragalactic background, 95 X-ray sources are identified with known cluster members. The X-ray luminosity function of the discovered YSO population spans a range of to 31.5 erg s-1 in the keV band, and absorption ranges from to 23 cm-2. Most of the sources have plasma energies between 0.6 and 3 keV, but a few sources show higher energies up to keV. Comparison with K-band source counts indicates that we detect all of the known cluster members with , and about half of members with . , the peak of the K-band luminosity function, corresponds to M⊙ stars for a cluster age of Myr.
We detect seven of the twenty known YSOs in NGC 1333 producing jets or molecular outflows as well as one deeply embedded object without outflows. No evident difference in X-ray emission of young stars with and without outflows is found. Based on the complete subsample of T Tauri stars, we also find no difference in X-ray properties and X-ray production mechanism of stars with and without K-band excess disks.
Several other results are obtained. We suggest that the X-ray emission from two late-B stars which illuminate the reflection nebula originates from unresolved late-type companions. Two T Tauri stars are discovered in the ACIS images as previously unknown components of visual binaries. A good correlation is seen which confirms the well-known relation found in many star forming regions. Based on spectral analysis for the X-ray counterpart of SVS 16, we establish that the column density is much lower than that expected from near-IR photometry so that its X-ray luminosity, erg s-1, is not unusually high.
1 Introduction
NGC 1333 is a star formation region within the Perseus molecular cloud complex noted for its large population of protostars and young stellar outflows. Named for a reflection nebula illuminated by B-type members of the Per OB2 association and lying in the Lynds 1450 dark cloud (Barnard 205), near-infrared (IR) imaging surveys revealed two embedded clusters of about 150 low- and intermediate-mass young stars within the inner parsec (Aspin, Sandell, & Russel, 1994; Lada, Alves, & Lada, 1996). The northern cluster includes the reflection nebula, while the southern cluster is associated with dense molecular material surrounding HH 7-11. Both clusters are associated with concentrations of dense molecular material seen in H2CO, CS, and CO molecular-line observations (Lada et al., 1974; Warin et al., 1996; Knee & Sandell, 2000).
Members of NGC 1333 produce an astonishing profusion of outflows with at least 17 young stellar objects (YSOs) ejecting Herbig-Haro objects, H2 shocks and/or CO bipolar flows (Bally, Devine, & Reipurth, 1996). The kinetic energy of these outflows dominates the dynamics of the cloud. At least five objects are extremely young Class 0 protostars (Knee & Sandell, 2000; Looney, Mundy, & Welch, 2000; Chini et al., 2001). The large population of short-lived outflows, together with the K-band luminosity function, indicate that the star clusters are extremely young with a high star formation rate around M⊙ yr-1 over the past 1 Myr (Lada, Alves, & Lada, 1996).
Herbig-Haro (HH) objects are jets of shocked gas (Reipurth & Bally, 2001) which trace high-velocity bipolar outflows that all young stellar objects appear to produce shortly after their birth. In NGC 1333, several HH objects are powered by optically visible low-mass young stars that suffer relatively low extinction and seem not to be embedded within opaque cloud cores. Three of the irradiated jets exhibit unusual C-shaped symmetry, suggesting that the source stars, still forming protostars, have been ejected from the cluster core (Bally & Reipurth, 2001). NGC 1333 thus provides a unique opportunity to study protostellar X-ray emission with relatively little intervening absorption.
We adopt 318 pc for the distance to NGC 1333 based on the Hipparcos parallactic measurements of the Perseus OB2 association (de Zeeuw et al., 1999). Values around pc were adopted in previous X-ray studies of NGC 1333 (Preibisch, 1997b; Preibisch, Neuhäuser, & Stanke, 1998; Preibisch & Zinnecker, 2002), substantially more distant than the value of 220 pc (Černis, 1990) used by other recent authors (e.g. Looney, Mundy, & Welch, 2000; Bally & Reipurth, 2001; Sandell & Knee, 2001). IC 348, a nearby star-forming region that is part of the Perseus molecular cloud complex as well, has also been the subject of recent Chandra studies (Preibisch & Zinnecker, 2001, 2002). These authors use the distance to IC 348 (310 pc) obtained by Herbig (1998), who shows that the photometric technique used by Černis (1993) to derive a distance of pc to IC 348 infers earlier spectral types than direct spectroscopic measurements. Since Herbig’s arguments apply equally well to NGC 1333 and more precise distance estimates are unavailable for this confused region, we choose to adopt the Hipparcos distance to the OB association. This facilitates comparisons to the earlier X-ray studies but must be taken into account in quantitative comparisons with studies that use a smaller distance.
X-ray studies give a unique view of star forming regions (Feigelson & Montmerle, 1999). X-ray luminosities are elevated fold above main sequence levels during all phases of pre-main sequence evolution. X-ray surveys are particularly effective for identifying YSOs that no longer exhibit circumstellar disks and, with recent telescopes with good sensitivity in the hard X-ray band, can penetrate deep into molecular cloud cores. X-rays are tracers of YSO magnetic activity; the emission arises from plasma heated by violent magnetic reconnection flaring. The NGC 1333 clusters were observed in the soft X-ray band with the ROSAT High Resolution Imager by Preibisch (1997b). This 40 ks observation detected 16 YSOs, most with and intrinsic luminosities to 31.2 erg s-1. The YSO SVS 16 was a notable exception with and X-ray emission apparently constant at the unusually high level of erg s-1 (Preibisch, Neuhäuser, & Stanke, 1998).
We present here a study of the region with the Chandra X-ray Observatory and its Advanced CCD Imaging Spectrometer (ACIS) detector. With its excellent mirrors and detectors, Chandra achieves an order of magnitude higher sensitivity and spatial resolution compared to ROSAT. More than half of the known cluster members are detected, penetrating deep into the X-ray luminosity function of the population. We first present data analysis methods (§2), provide source lists (§3), and discriminate between cluster members and background sources (§4). We then consider the X-ray stellar population (§5), summarize the K-band survey and the ACIS survey (§6), present the X-ray properties of the cluster as a whole (§7) and discuss in particular the X-ray emission from late B stars (§8), the X-ray properties of CTTs, WTTs (§9, §10), younger protostars, and outflow sources (§11), and a few other interesting sources (§12).
2 Observations and data analysis
2.1 ACIS Observation
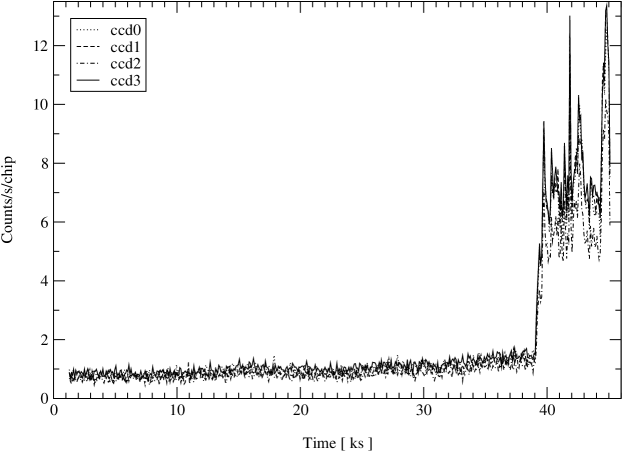
The Chandra observation of NGC 1333 was performed on 12.96-13.48 July 2000 utilizing the ACIS imaging array (ACIS-I) consisting of four abutted front-side illuminated CCDs with a field of view of about . The aimpoint of the array is , (J2000) and the satellite roll angle (i.e., orientation of the CCD array relative to the north-south direction) is 95.7∘. The focal plane temperature is -120∘C. The total exposure time of our NGC 1333 image is 43.9 ks, but because of background flaring at the end of the observation (Figure 1), we utilize a reduced exposure time of 37.8 ks. Two of the CCDs of the ACIS-S spectroscopic array were also turned on, but these data will not be discussed here as the mirror point spread function is considerably degraded far off-axis. Detailed Chandra ACIS instrumental information can be found in Weisskopf et al. (2002) and at http://asc.harvard.edu.
2.2 Data selection and astrometric alignment
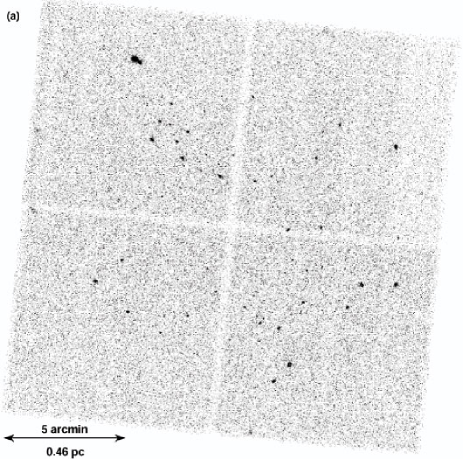
We start data analysis with the Level 1 processed event list provided by the pipeline processing at the Chandra X-ray Center. The energy and grade of each data event are then corrected for charge transfer inefficiency (CTI), applying the techniques developed by Townsley et al. (2000, 2002a). This provides a more uniform gain and improved energy resolution, accounting for the spatial redistribution of charge during the chip readout process. A sequence of cleaning operations follows to remove cosmic ray afterglows, hot columns/pixels, events arising from charged particles, and detector noise. These include filtering by ASCA grades (0,2,3,4,6), status bits, timeline, and background flaring due to solar activity. More extensive discussion of these methods is provided by Feigelson et al. (2002) [hereafter F02]. Note, however, that our treatment of spectral calibration is improved over the method described in that paper. The resulting ACIS-I image is shown in Figure 2.
The effect of solar protons is illustrated in Figure 1, which shows that background flaring occurred during the last 6 ks of the exposure. This is attributed to flares from solar active region 9077 which produced a rise in the GOES satellite MeV solar proton fluence from to particles cm-2 s-1 sr-1 during 13.1-13.5 July, peaking at particles cm-2 s-1 sr-1 during 14.5-15.8 July. The Chandra flare onset coincided within two minutes of the geomagnetic Sudden Storm Commencement at 0945UT 13 July. This was the strongest solar proton event, and produced the worst geomagnetic storm, of the decade. Detailed information about solar activity during this period of time can be found on-line at http://www.sec.noaa.gov/weekly/weekly00.html.
To correct for possible systematic errors in the Chandra aspect system, which are typically around 1″, we compare the X-ray positions of 2 ACIS sources with their optical counterparts from the Tycho-2 catalog (BD +30∘549, BD +30∘547), and 10 ACIS sources in the inner 5′ field with optical counterparts from the USNO-A2.0 catalog. The resulting offset of in right ascension and in declination was applied to the ACIS field.
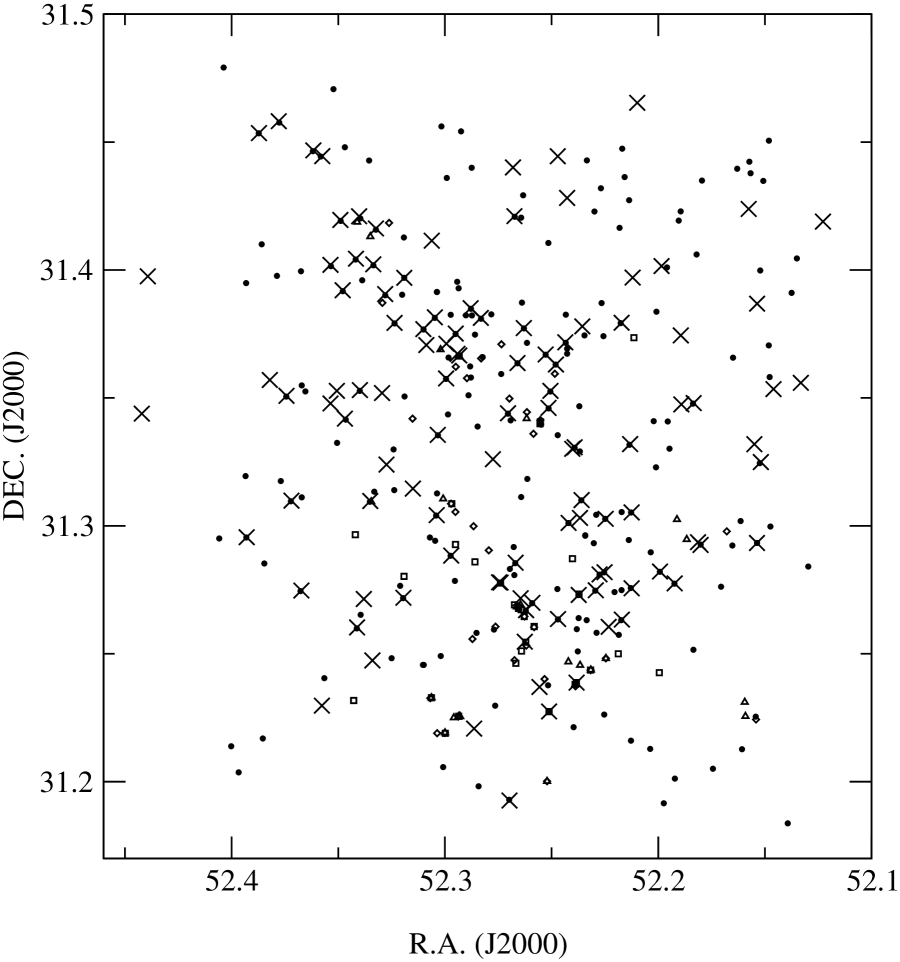
The ACIS image of NGC 1333 emerging from these data selection and alignment procedures is shown in Figure 2a. Sources are located with the wavdetect program within the CIAO data analysis system that performs a Mexican hat wavelet decomposition and reconstruction of the image (Freeman et al., 2002). Cosmic ray afterglow events were removed from the data and the energy range was restricted to keV for source detection. Wavelet scales ranging from 1 to 16 pixels in steps of were used, where each pixel subtends . To enhance selection sensitivity we run wavdetect separately for a series of three pixel concentric images at 1, 2 and 4 pixel resolutions for each of the three energy bands (soft , hard , full keV) with a source significance threshold of . The merged catalog produced 117 sources. Eight sources appeared to be spurious upon visual inspection of the image. Repeating the detection procedure with a significance threshold of did not reveal any convincing new sources. Our source list thus contains 109 sources, tabulated in Table 1 and displayed in Figure 3 and Figure 4.
We then performed a visual search for faint sources, looking for concentrations of photons spatially coincident with known sources from near-IR (Lada, Alves, & Lada, 1996; Aspin, Sandell, & Russel, 1994), mm/submm (Chini et al., 2001; Sandell & Knee, 2001) and radio continuum (Rodríguez, Anglada, & Curiel, 1999) catalogs. We were careful to avoid biasing these results; no other information (e.g. IR magnitude) about the known sources was provided to the person performing the matching. The results are shown in Table 3, where is the off-axis angle. Most of these candidate X-ray sources were matched to K-band sources from Lada, Alves, & Lada (1996). No further tentative matches were found to the radio sources of Rodríguez, Anglada, & Curiel (1999) or the protostars in Chini et al. (2001) or Sandell & Knee (2001). While some of these concentrations of ACIS photons in Table 3 may be random coincidences, we believe most of them are real sources. For small off-axis angles, assuming an average point spread function size of roughly 10 arcsec2 and the background rate of 0.018 counts per arcsec2, the likelihood of the random occurrence of 3 or more events sampled from a Poisson distribution of photons is on-axis.
2.3 Optical imaging
A deep broad-band image in the Sloan Digital Sky Survey I-band was obtained with the MOSAIC CCD camera at the prime focus of the Mayall KPNO 4 meter reflector on the night of 13 October 2001. This camera uses eight 2048 4096 pixel SITe CCDs, has a 36′ field of view and a 0.26″/pixel image scale. Five individual 180 second exposures, obtained using a standard dither pattern to remove the intra-CCD gaps, were combined to form an image with a total exposure time of 900 sec in 0.8″ seeing. The IRAF package MSCRED was used for standard reductions. The USNO catalog was used to establish an astrometric solution accurate to about 0.6″ and to compare with the Chandra source positions. The limiting magnitude is about .
2.4 Stellar counterparts and source positions
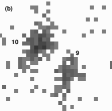
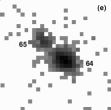
Likely stellar identifications within 3″ of each ACIS source in Table 1 were selected from multiwavelength studies of the NGC 1333 cloud. We found 6 compact radio continuum counterparts (Rodríguez, Anglada, & Curiel, 1999), 1 mm/submm continuum source (Looney, Mundy, & Welch, 2000; Chini et al., 2001; Sandell & Knee, 2001), 3 far-IR sources from the Infrared Astronomical Satellite (Jennings et al., 1987), 43 mid-IR sources from the Infrared Space Observatory111We used the ISO public data archive located on-line at http://www.iso.vilspa.esa.es/ISO/. These data are not cleaned of instrumental artifacts, so additional faint ISO counterparts may be present., 73 near-IR sources (Aspin, Sandell, & Russel, 1994; Aspin & Sandell, 1997; Lada, Alves, & Lada, 1996), and 70 optical band stars from our I-band image, from the Hipparcos/Tycho, USNO-A2.0, HST Guide Star catalogs, and studies of the region by Herbig & Jones (1983), Bally, Devine, & Reipurth (1996), and Bally & Reipurth (2001). We also searched the SIMBAD and NED databases for additional counterparts without success, and the 2MASS survey catalog of the region has not been released at the time of writing. All 16 soft X-ray sources detected with ROSAT (Preibisch, 1997b) in the field of view are recovered. ROSAT source #15 is resolved into two sources separated by 4″(ACIS #64 and #65; see Figure 2e). These results are presented in Table 1 and Figures 3-4.
Altogether, 80 of the 109 ACIS sources (73%) have counterparts at a non-X-ray band. We believe that these identifications are highly reliable in the sense that they are not chance coincidences. Of the 38 sources with astrometric counterparts (2 from Tycho and 36 from USNO-A2.0), two-thirds have X-ray/optical offsets less than 0.5″ with the remainder within 1.7″ (Table 1, column 9), well within uncertainties of the Chandra ACIS instrument. We believe the main uncertainty in identification lies in binarity and multiplicity of most YSO stellar systems (Mathieu et al., 2000; Looney, Mundy, & Welch, 2000). Figure 2b-e show four cases where ACIS resolved close () double sources that were unresolved in the K-band image of Lada, Alves, & Lada (1996). Many closer multiple systems are likely present for which we cannot identify the X-ray active component. Except for the early B-type stars, we assume that most of the X-rays are produced by the component that produces most of the bolometric emission.
2.5 Source extraction and limiting sensitivity
Extraction of counts generally follows the procedures described in F02. Briefly, we extract counts in the total ( keV) band from within radius , the radius encircling about 90% (99% for very strong sources with counts) of the energy, which increases with off-axis distance due to deterioration of the point spread function. background events are extracted from four circular regions with radii surrounding the source. Background extraction circles are manually adjusted for crowded regions of the field. The mean background level is counts per arcsec2. The count rate for each source is then given by where the net exposure time ks (§2.1) and the fraction of energy extracted is typically . These extracted quantities are tabulated for each source in Table 2.
The faintest on-axis source emerging from the wavelet source detection procedure (§2.2) has 5 extracted counts. The corresponding minimum detectable X-ray luminosity in the total ( keV) band is erg s-1 for a source with negligible interstellar absorption () and a typical source spectrum of a keV thermal plasma222The determination of the transformation factor from detector count rates to X-ray flux was done using PIMMS. PIMMS is the Portable, Interactive Multi-Mission Simulator located on-line at http://asc.harvard.edu/toolkit/pimms.jsp. This limit increases to 28.6 and 29.3 erg s-1 if the absorption is increased to () and 22.6 cm-2 (), respectively. The sensitivity decreases by a factor of 4 at the edge of the field as described in F02.
2.6 Variability analysis
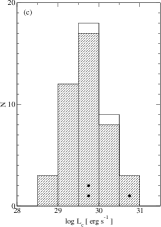
For each X-ray source, lightcurves in the total ( keV) band were created. The lightcurves are displayed with total number of bins: 20 for strong sources and 10 for weaker sources. The existence of variability was tested by comparing the observed photon arrival times to that of a constant source using the Kolmogorov-Smirnov one-sample test333Note that this classification differs from that in F02, which used mainly qualitative rather than quantitative classification criteria.. Sources were classified as ‘Constant’ if the probability of accepting the null hypothesis , as ‘Possible flare’ if , and as ‘Flare’ if . Examples of these variability classes are shown in Figure 5. The lightcurves in panels (c)-(f) are very similar to the X-ray behavior of solar long decay flares with a rise time of 1-2 hours and a decay time of a few hours up to 10 hours (Getman & Livshits, 2000). In contrast to short impulsive flares, these often originate during posteruptive processes resulting in magnetic reconnection in a vertical current sheet with the subsequent formation and evolution of new giant coronal loops.
2.7 Spectral analysis
Our spectral analysis utilizes new techniques to improve treatment of the ACIS CCD charge transfer inefficiency (CTI) induced by particle irradiation during the first weeks of the Chandra mission. The CTI problem causes degradation of detector gain, spectral resolution and high energy sensitivity as a function of location on the chip. Spectral analysis implemented in the CIAO version 1 and 2 software fits the gain drop but does not seek to improve the spectral resolution or sensitivity. In our previous study (F02), we corrected the data for all three effects using the procedures described by Townsley et al. (2000), but did not have appropriately corrected calibration auxiliary response files (arf) and response matrix files (rmf) for scaling the observed event energy distribution to the true spectrum incident on the detector. Here, we both apply the CTI correction to the data and use newly derived self-consistent arf and rmf files (Townsley et al., 2002a, b). The spectral analysis here minimizes the limitations or biases of previous studies as much as possible.
Source and background pulse height distributions in the total band keV) were constructed for each X-ray object and grouped into energy bins. Model fitting of background subtracted spectra were performed using XSPEC 11.0.1 using the new arf and rmf files. For nearly all sources, a one-temperature optically thin thermal plasma MEKAL model (Mewe, Lemen, & van den Oord, 1986; Liedahl, Osterheld, & Goldstein, 1995) successfully fits continuum and emission line strength, assuming a uniform density plasma with 0.3 times solar elemental abundances. In a few cases, multi-temperature or variable abundance models were needed to obtain an adequate fit. X-ray absorption was modelled using atomic cross-sections of Morrison & McCammon (1983).
The derived spectral parameters inherit a statistical uncertainty, and a bias, from the fitting process. We used the fakeit utility in the XSPEC package to perform a series of simulations with sources of known spectra, considering the instrumental model based on the rmf and arf files of our observation, to estimate the statistical uncertainties of , and broad-band luminosities. Simulations were carried out for a wide ranges of parameters: cm-2, keV, and counts. The results show a tendency to systematically underestimate the plasma energies of keV sources by % ( counts), % (100 counts), and % (1000 counts). This can be explained by the rapid decline in telescope effective area at high energies. The column density can be over-estimated in weak unabsorbed sources because no data below 0.5 keV is considered.
The simulations show that the standard deviations of derived plasma energy values range from % ( counts) to % (100 counts) and 10-15% (1000 counts). Column density uncertainties are 0.5 to 0.2 ( counts), 0.4 to 0.1 (100 counts), and 0.3 to 0.02 (1000 counts) for unabsorbed and highly absorbed sources, respectively. Log values below cm-2 are often ill-determined because we consider data only above 0.5 keV. Due to the nonlinearity of the models and data, correlated errors are naturally present. Broad-band luminosity values exhibit standard deviations ranging from % ( cts) to 15% (100 cts) and 4% (1000 cts), only somewhat larger than the optimal . All of these results are not substantially affected by use of the likelihood ratio (C) statistic instead of the statistic.
We conclude from this simulation analysis that all broad-band luminosities derived here are reliable, but that the individual spectral parameters (kT and ) are unreliable for the faintest sources. We thus confine discussion of spectral properties to the sources with cts for which estimated errors are smaller than the parameter ranges.
Figure 6 shows several examples of YSO X-ray spectra. Panels (a) and (b) show typical hard spectra of highly absorbed sources. Panel (a) is source #71 with a heavily reddened near-IR counterpart. Its 150 counts are fitted with keV (internal errors, evaluated from the XSPEC statistic, indicate 1 confidence limit) and cm-2 corresponding to . Panel (b) is source #49 with only mm/submm and radio counterparts; it is probably a deeply embedded protostar. The 16 ACIS counts are fitted by a keV plasma and cm-2. Panels (c) and (d) show typical sources with moderate absorption. Panel (c) is source #25 with a near-IR counterpart with K-band excess, probably a classical T Tauri star. Its 35 counts are fitted by a keV plasma with cm-2. Source #52 in panel (d), also probably a classical T Tauri star, exhibited a strong flare. Its 478 counts are not well fit by the standard plasma model. The model shown here has cm-2 and keV. Excess abundance of sulfur (2.5 keV) and a non-solar neon-to-iron ratio ( keV) may be present. Panels (e) (source #81) and (f) (source #91) show relatively soft spectra with little absorption and optical counterparts. Panel (e), a likely weak-lined T Tauri star, has 234 counts fitted by keV plasma and cm-2. Its spectrum may show excess oxygen (0.82 keV). Panel (f), also probably a weak-lined T Tauri star, has 85 counts and is fitted by a model with cm-2 and keV.
3 Source list and properties
The database of sources found in the NGC 1333 ACIS field is provided in Tables 1 and 2. The first of these tables gives source locations and multiwavelength properties while the second table gives X-ray properties. Specifics regarding table entries follow.
- Table 1, Column 1
-
Source number. Sources are sorted by their right ascension.
- Column 2
-
Source name in IAU format Jhhmmss.s-ddmmss with the IAU designation
CXONGC1333. - Columns 3-4
-
Source position for epoch J2000 in sexagesimal units.
- Column 5
- Column 6
-
Source number in X-ray study of the NGC 1333 star forming region using the ROSAT High Resolution Imager (Preibisch, 1997b).
- Columns 7-9
-
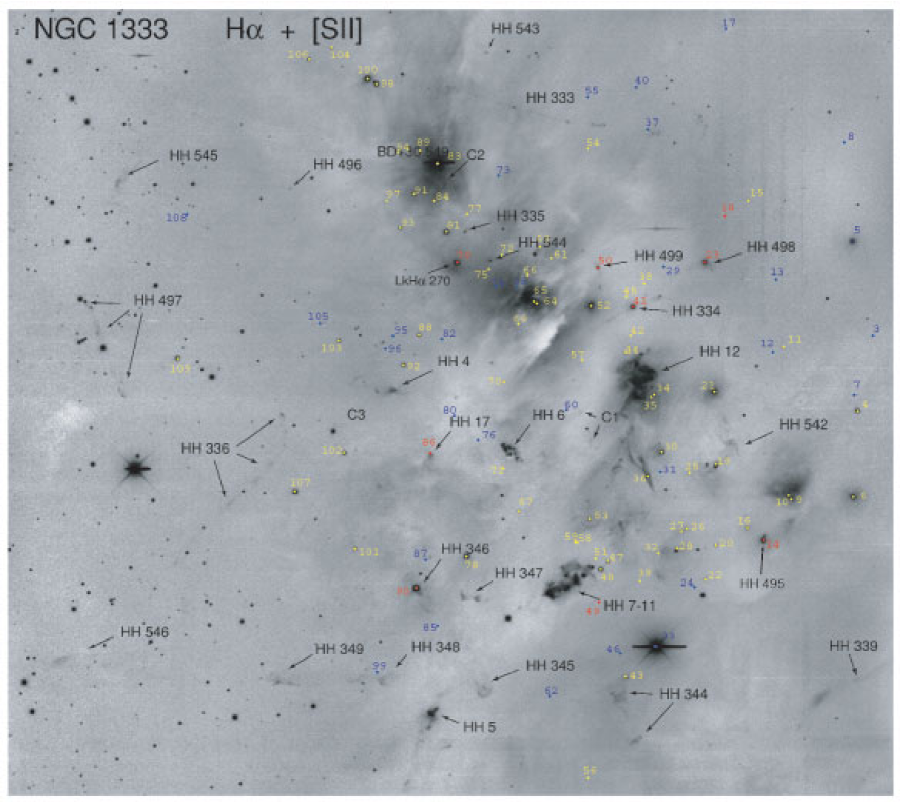
Optical counterparts: HJ = source number from the catalog derived from R-band photographic plates by Herbig & Jones (1983); BR = visible on H/[SII] CCD image by Bally & Reipurth (2001, see Figure 4); USNO = listed in USNO-A2.0 astrometric catalog (Monet, 1998). For USNO conterparts we give the offset between the X-ray and USNO-A2.0 positions in arcseconds.
- Column 10
-
I-band magnitudes from our KPNO image (§2.3). ‘Yes’ indicates the star is saturated while ‘Conf’ indicates a confused region where X-ray position lost in the glare of a nearby source or reflection nebula.
- Columns 11-12
- Columns 13-15
- Column 16
-
Footnotes indicate other counterparts including mid-IR, far-IR, mm/submm and radio counterparts. ISOCAM counterparts are based on visual inspection of public domain ISO images. ‘?’ indicates a weak or tentative ISOCAM source; these are not included in the analysis.
- Table 2, Columns 1-2
-
Source number and name from Table 1.
- Columns 3-6
-
Quantities associated with event extraction from the full band ( keV) image (§2.5): extracted counts from radius , background counts , and the fraction of the source’s events collected within a circle of radius .
- Columns 7
-
Average source count rate during the observation (§2.5).
- Column 8
-
Variability class (§2.6): ‘Flare’ (flare), ‘Pos flare’ (possible flare) and ‘Const’ (constant).
- Columns 9-10
-
Spectral parameters from one and two-temperature plasma models. (in cm-2) is the equivalent hydrogen column density of intervening interstellar material producing soft X-ray absorption, and (in keV) is the energy of the plasma. Parentheses indicate 1 errors.
- Columns 11-14
-
X-ray luminosities of the source assuming a distance of 318 pc: = soft-band ( keV) luminosity; = hard-band ( keV) luminosity; = total band ( keV) luminosity; and = total band luminosity corrected for the estimated interstellar absorption. See F02 for details.
- Column 15
-
Table notes giving details of non-standard spectral fits.
4 Sources without stellar counterparts
Extragalactic sources, mainly quasars and other active galactic nuclei, can be seen through molecular clouds in the hard X-ray band. Assuming a faint quasar power law spectrum with photon index and a typical total column density of cm-2 across the field, our 13 photon (mean count value of 30 unidentified sources) point source corresponds to a limiting sensitivity of erg s-1 cm-2 in the hard ( keV) band. The corresponding extragalactic source density is about sources per square degree (Brandt et al., 2001b), or in our ACIS-I field. From source counts alone, all 29 of our sources without stellar counterparts plus source #108 may thus be extragalactic. Our deep I-band photometric data support this idea with for all these sources.
This interpretation is generally supported by the X-ray properties of the unidentified sources: they are relatively weak ( with a median of 14 counts), exhibit no flares and are highly absorbed ( cm-2). Their spatial distribution is roughly uniform, although a north-south asymmetry may be marginally present. We will hereafter consider the unidentified sources to be unrelated to the NGC 1333 young stellar cluster and will omit them from further discussion444A similar conclusion concerning ACIS sources without counterparts was reached in studies of the Perseus cloud IC 348 cluster (Preibisch & Zinnecker, 2001), the Ophiuchus cloud core (Imanishi, Koyama, & Tsuboi, 2001), and the central region of the Pleiades (Krishnamurthi et al., 2001). However, the ACIS image of the Orion Nebula Cluster had a several-fold excess of unidentified sources which were too bright for quasars and strongly clustered around the molecular cloud cores (F02). The Orion unidentified sources were therefore inferred to be mostly previously unknown YSOs..
5 The X-ray stellar population
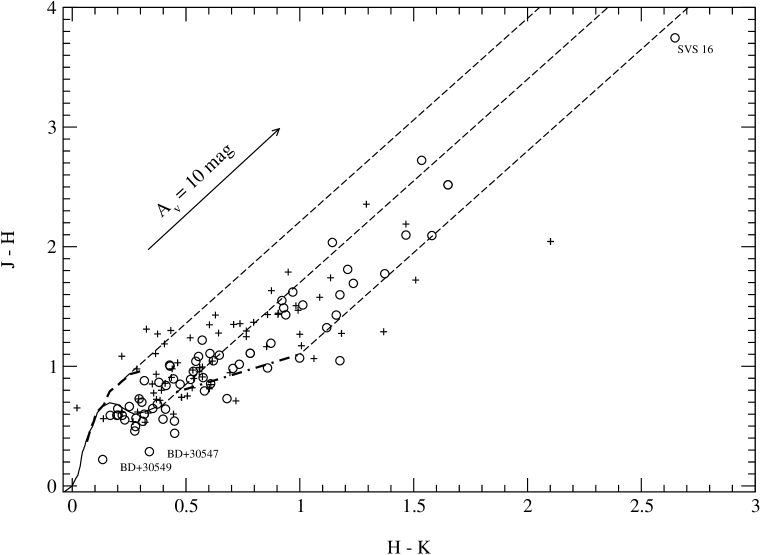
Seventy-three of the 77 ACIS sources with YSO counterparts have near-infrared photometric measurements. Their locations are displayed as yellow and red circles in Figure 4; about 80% of them lie in the central concentrations of the double cluster (Lada, Alves, & Lada, 1996). Their average K-band magnitude corresponds to masses between M⊙ for a cluster age of Myr (Lada, Alves, & Lada, 1996). The infrared diagram in Figure 7 shows that about half of the X-ray sources are consistent with reddened photospheres, classified as Class III YSOs or weak-lined T Tauri stars, while half show infrared excesses characteristic of Class II YSOs or classical T Tauri stars. Here we adopt the reddening relationship (Cohen et al., 1981). A similar fraction of circumstellar disks is found among the 16 L-band sources detected in X-rays (Aspin & Sandell, 1997). These are the magnetically active low-mass T Tauri stars found in all X-ray images of nearby star forming regions (Feigelson & Montmerle, 1999).
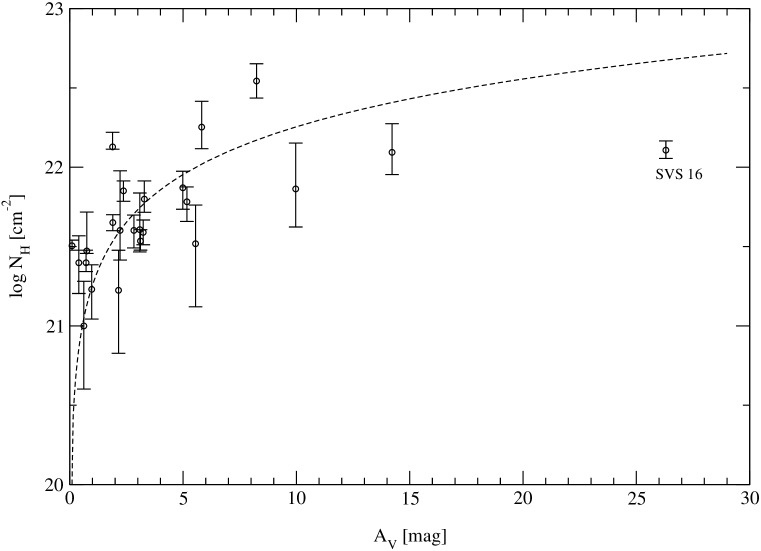
Figure 8 compares the line-of-sight absorption estimated from the infrared color-color diagram with the soft X-ray absorption derived from our spectral analysis (§2.7). The visual absorption is estimated by projecting each star along the reddening vector to the main sequence or classical T Tauri star locus in the diagram. Error bars are provided for selected values to illustrate the internal errors of the X-ray absorption measurements, evaluated from the XSPEC statistic. We find good agreement between the two absorption measurements for the stronger sources with ( cm-2), consistent with the relationship cm-2 obtained by Ryter (1996) for a standard interstellar gas-to-dust ratio, but several objects show considerably greater than expected from the value. An offset towards higher was also seen in several hundred Orion stars (F02). We cannot distinguish here between several possible causes of this discrepancy: unmodeled infrared emission from an inner disk, incorrect modelling of the X-ray spectrum, a non-standard dust-to-gas ratio associated with an extremely young YSO, or spatial separation between the X-ray emitting region and the photosphere.
There are 6 sources which are neither probable background objects (§4) nor K-band sources. Two of these (#59 and #65) are previously unresolved companions of bright K-band cluster members (Figure 2c and d). One (#18) has KPNO/ counterparts only. Two (#5 and #109) have optical counterparts: source #5 (HJ 110, Herbig & Jones, 1983) along with #33 (BD +30∘547) are probably foreground stars (Preibisch, 1997b) while #109 is probably a cluster member. Source #109 is the only one having offset from its optical counterpart, but taking into account the fact that it lies far off-axis, where the larger offsets are common due to anisotropies in the Chandra mirror point spread function, it is reasonable to assume this identification valid.
The remaining source (#49) has only radio/submm counterparts with properties of an extremely young object, probably a Class I protostar. We consider this source, together with seven K-band stars that produce Herbig-Haro outflows (#14, 23, 41, 50, 79, 86 and 90), in §11 below. ACIS source #33, the foreground star with nearly 3000 ACIS counts overwhelms any possible ACIS signal from the nearby protostar IRAS 2B = VLA 10 = SK 7 (Rodríguez, Anglada, & Curiel, 1999; Sandell & Knee, 2001).
6 Cluster membership
X-ray surveys provide insights into the census of a young stellar population that are distinct from traditional optical and infrared surveys: X-rays select for elevated magnetic activity, while other methods mostly select for circumstellar disks. For example, a study of the Chamaeleon I cloud nearly doubled the cluster membership known at that time and established that most members are weak-lined T Tauri stars without prominent disks and that many stars lose their disks before they reach the birthline (Feigelson et al., 1993). In clouds such as NGC 1333 where sensitive and spatially complete K-band surveys locate virtually all young stellar objects (Lada, Alves, & Lada, 1996), X-ray observations serve principally to discriminate cluster members from background Galactic stars rather than discover new members.
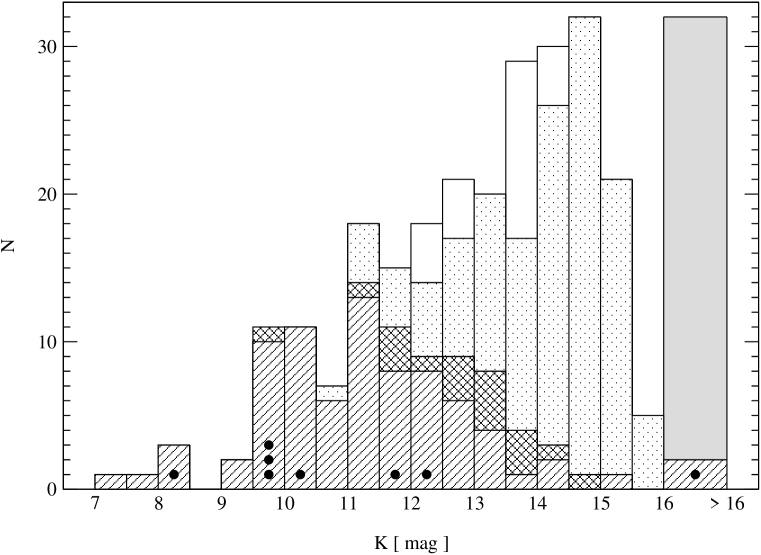
Figure 9 summarizes the K-band survey of Lada, Alves, & Lada (1996) and the ACIS survey obtained here. The histogram from shows the distribution of K magnitudes in the region covered by the ACIS field. The dotted portion shows the expected Galactic contamination obtained from nearby control fields and adjusted for extinction due to the cloud by Lada, Alves, & Lada (1996). The K-band luminosity function (KLF) is incomplete below magnitude and the counts in the bins in Figure 9 are estimates based on control field observations of Lada, Alves, & Lada (1996). For these brightness bins, the number of cluster members contributing to the KLF is presently uncertain but likely to be small. The hatched portion shows the K stars that are also ACIS sources.
We detect all of the clusters members with . These 55 ACIS/K-band sources with constitute a nearly ‘complete’ sample. From to , the X-ray observations discriminate a decreasing fraction of cluster members from background stars. The 18 candidate faint ACIS sources listed in Table 3 have with a median of , as shown in the double-hatched portion of Figure 9. The facts that these candidate sources have K magnitudes fainter than the X-ray brighter sources and near the peak of the cluster luminosity function give confidence that they are real X-ray sources. If they were spurious, they would be associated with random K-band sources, most of which are background stars around . There is thus good reason to accept most of the identifications in Table 3 as valid. This indicates that ACIS sources as faint as 3 counts (with counterparts in other wavebands) can be valid, and that a future deeper exposure should successfully detect most of the remaining cluster members.
As noted in §2.2, no matches of tentative sources to sub-mm protostars (Chini et al., 2001) were found. A stacking analysis (Brandt et al., 2001a) yielded 5 counts for the 6 undetected protostars; one of these events should be background based on the number of sources, the approximate PSF size in this region, and the average background rate. An ACIS exposure, several times deeper than the 37.8 ks studied here would thus be likely to detect these protostars.
The rightmost bar in Figure 9 shows the 32 X-ray sources without counterparts. The grey portion is our estimation of the extragalactic contamination to the X-ray survey (§4). The ACIS source in the hatched portion is X-ray source #49 which is associated with radio/millimeter and mid-IR emitting protostar that is too deeply embedded to appear in the K-band survey (§11). Unlike the ACIS Orion Nebula study which revealed several dozen X-ray discovered deeply embedded cluster members (F02), there is no indication here that the existing K-band plus radio/millimeter surveys are incomplete, at least for stars with masses M⊙555Recall that pre-main sequence X-ray emission depends strongly on stellar mass, for unknown reasons, so that our X-ray detection rate of M stars and brown dwarfs here is low (Preibisch & Zinnecker, 2001, F02)..
7 Global X-ray properties
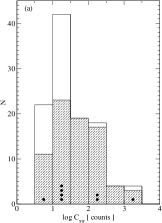
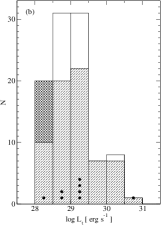
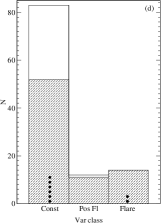
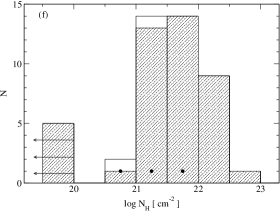
Figure 10 shows univariate distributions of six measured X-ray properties: extracted counts , observed total X-ray luminosity ( keV), absorption-corrected X-ray luminosity , variability class, plasma energy , and absorbing column density . In these histograms, we distinguish between the unidentified background sources and two foreground stars (clear regions), the population of cluster members (hatched regions), and stars producing large-scale jets (marked as circles). We omit the 32 probable non-members from our discussion here to concentrate on the NGC 1333 cluster members.
The distribution of source counts ranges from 5 to 1707 events with log mean and standard deviation of cts and median value cts (Figure 10a). Background counts are not included here; they are usually negligible. The shape of the distribution is roughly flat at lower count rates666The apparent drop in sources between 5 and 10 counts likely does not reflect the true distribution in the cluster, as sensitivity to the weakest sources decreases off-axis and we have omitted the faint sources in Table 3. and falls to a lower level at high count rates. The distribution of observed X-ray luminosities has a similar shape with mean value of erg s-1 (Figure 10b). This is somewhat below the comparable value of erg s-1, found in the study of the Orion Nebula Cluster with a similar limiting sensitivity (F02), perhaps because the latter has more higher mass stars than the NGC 1333 cluster. The distribution of luminosities after correction for absorption shows a lognormal distribution with erg s-1 (Figure 10c). The effect of the absorption correction is to push more sources into the luminous erg s-1 range. Of course, the mean luminosities of the full cluster population are lower than these values, as the faintest cluster members are not detected here.
The variability class distribution is shown in Figure 10d. Of 77 known cluster members 26 show temporal variability with 14 indicating a strong X-ray flare. The remaining 51 members with ‘Constant’ emission are dominated by sources with counts which are too weak to clearly show flaring activity. If one considers only the stronger sources, the distribution among the three variability classes becomes roughly equal, similar to that seen in the Orion X-ray population (F02).
Figures 10e and 10f show the distribution of plasma energies and the interstellar column densities. Only sources with extracted counts are included here. Plasma energies are distributed with mean and standard deviation of keV and median keV. 84% of sources have between keV, which is a typical range for X-ray active T Tauri stars (Feigelson & Montmerle, 1999; Preibisch, 1997a). One source (#30) has unusually high plasma temperature up to keV. Such ultra-hot plasmas have been found in ASCA studies during powerful T Tauri and protostar flares (e.g. Tsuboi et al., 1998). Most of NGC 1333 stars have plasmas hotter than seen in the Sun, even during its most powerful contemporary flares (Reale, Peres, & Orlando, 2001). There is no apparent relationship between variability (‘Flare’ and ‘Possible flare’ variability classes) and spectral hardness. This implies that the ‘quiescent’ emission of YSOs arises from plasma as hot as ‘flare’ emission, supporting the idea that quiescent emission in magnetically active stars arises from microflares rather than coronal processes (Cargill, 1994; Güedel, 1997; Drake et al., 2000).
The interstellar column densities derived from X-ray spectral fitting (Figure 10f) are not an intrinsic property of the X-ray emission, but rather reflect the location of each star in relation to molecular cloud material in NGC 1333. Most of the values are normally distributed with mean cm-2, but 5 sources suffer no detectable absorption with cm-2. Seven stellar sources have cm-2 ( magnitudes). We cannot distinguish here between those that happen to lie deep within or on the far side of the cloud, and those that are very young protostars with dense circumstellar envelopes.
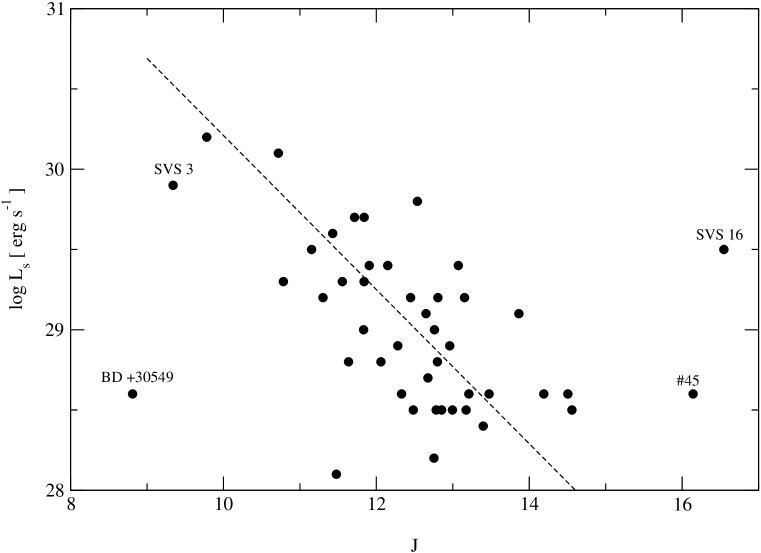
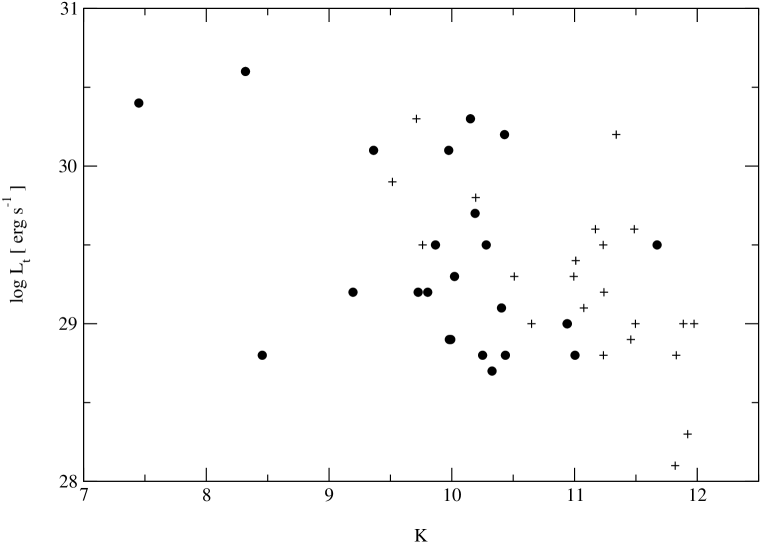
A simple correlation for the soft X-ray emission in several young stellar populations has been reported (e.g. Feigelson et al. 1993 for the Chamaeleon I cloud and Casanova et al. 1995 for the Ophiuchi cloud). The astrophysical cause of this relation is unknown, as these stars typically have X-ray emission -fold below saturation levels where the correlation is expected. It may reflect the dependence of bolometric and X-ray luminosities on the mass, age or internal dynamo processes of pre-main sequence stars. As -band magnitudes are a good empirical measure of (Greene et al., 1994) and the extinction cross-sections are the same in the soft X-ray and bands (Casanova et al., 1995), and values can be directly compared without absorption correction. Figure 11 shows such a correlation for the keV luminosities of NGC 1333 YSOs. A similar relation is seen for the total band ( keV) luminosities. Excluding three outliers, BD +30∘549, SVS 3 (§8), and SVS 16 (§12), linear fits to the data give and for the soft and total energy band, respectively777These regressions are the ordinary least square bisector lines which treat the variables symmetrically (Feigelson & Babu, 1992).. Casanova et al. (1995) found for ROSAT-detected stars in the Ophiuchi cloud.
NGC 1333 and IC 348 are the two most prominent young stellar clusters in the Perseus molecular cloud where IC 348 is older with the age of about Myr (Lada & Lada, 1995; Herbig, 1998). It is interesting to investigate whether the X-ray properties of the stars in the NGC 1333 are different from those of the IC 348 due perhaps to an evolution of magnetic activity. We have compared the absorption-corrected X-ray luminosity functions of 77 members of NGC 1333 and 168 members of IC 348 (Table 1 in Preibisch & Zinnecker, 2002) using the two-sided two-sample Kolmogorov-Smirnov test. These samples constitute % of the entire populations in both cases. No difference in the X-ray luminosity functions is present. This supports the suggestion of Preibisch (1997b) that, during the PMS evolution between Myr, an increase in the X-ray surface flux from an increase in the rotation rate may be compensated by a decrease in the stellar surface area.
8 X-ray emission from late B stars
Theoretically, X-ray emission from late B stars is not expected as they lack both the convection zones driving magnetic activity and the strong radiation driven stellar winds with shocks responsible for X-ray emission in O and early B stars (Pallavicini, 1989). We detect here X-ray emission from both stars that illuminate the optical reflection nebulae: BD +30∘549 (B9, ACIS source #83) and SVS 3 (B6, #64).
These two sources differ in X-ray luminosity by a factor of , after correction for reddening. Only 39 photons are seen from the lightly absorbed B9 star compared to 1161 photons from the heavily absorbed B6 star; the corresponding X-ray luminosities are and erg s-1 and emissivities are and respectively. A similar wide dispersion among intermediate-mass young stars is seen in the Orion Nebula Cluster (see their Figure 12 in F02). These stars are outliers on different sides of the diagram in Figure 11; a similar effect is reported for intermediate mass stars in the IC 348 cluster (Preibisch & Zinnecker, 2002, see their Figure 7).
The simplest resolution to these discrepancies between intermediate- and low-mass pre-main sequence X-ray emission is that the observed emission originates from unresolved late-type companions and not from the late-B stars themselves. This has been argued by various researchers (e.g. Schmitt et al., 1985; Simon, Drake, & Kim, 1995). The ‘Constant’ variability class of SVS 3 may suggest that its emission does not arise from magnetic flares. Such strong constant emission is unusual, but not unique, among X-ray luminous T Tauri stars. For example, JW 286 is a solar-mass Orion Nebula star with constant emission at erg s-1 over two ks observations separated by 6 months (F02).
9 On the X-ray properties of classical vs. weak-lined T Tauri stars
There has been some debate concerning the X-ray properties of classical and weak-lined T Tauri stars. In several young stellar clusters associated with nearby star formation regions – Chamaeleon I (Feigelson et al., 1993), Ophiuchus (Casanova et al., 1995; Grosso et al., 2000), Orion Nebula Cluster (F02) and IC 348 (Preibisch & Zinnecker, 2001) – no substantial difference in X-ray properties are found between these two classes of T Tauri stars. However, studies of the more extended Taurus-Auriga clouds show WTTs are on average several times more X-ray luminous than CTTs (Neuhäuser et al., 1995; Stelzer & Neuhäuser, 2001). Preibisch & Zinnecker (2002) argue that this arises from a combination of the correlation (§7) and incompleteness in the sample of faint Taurus-Auriga WTTs.
For the NGC 1333 cluster, we examine the subsample of stars which has 24 CTTs and 22 WTTs (Figure 9). This subsample is complete in two senses: it includes all cluster members above a mass , and all of these stars are X-ray detected here. Figure 12 plots the total band ( keV) X-ray luminosities derived from our spectral fitting versus observed -magnitude. The X-ray luminosity distributions show no systematic differences between the two classes: the means and standard deviations are erg s-1 for CTTs and erg s-1 for WTTs. Similar results are found for absorption-corrected X-ray luminosities: erg s-1 for CTTs and erg s-1 for WTTs.
The NGC 1333 results thus confirm the findings from most other young stellar clusters, which suggest that there is no difference in the astrophysical mechanism of WTT and CTT X-ray emission. We support the interpretation of Preibisch & Zinnecker (2002) that the Taurus-Auriga measurement of higher X-ray luminosities in WTTs compared to CTTs is a sample selection bias rather than an astrophysical effect.
10 X-ray spectra
Spectroscopy can address important questions concerning the astrophysical origins of young stellar X-ray emission. The solar flare paradigm predicts a statistical scaling between plasma temperature and X-ray emission, roughly as (e.g. Schmitt et al., 1990). This is predicted by simple models of plasma heated in magnetic coronal loops (Rosner, Tucker, & Vaiana, 1978), with or without additional heating from multiple weak flares (Drake et al., 2000), and is seen in studies of magnetically late-type active stars (e.g. Preibisch, 1997a; Güedel, Guinan, & Skinner, 1997). The diagram for NGC 1333 sources (not shown) between erg s-1 and ∘K shows a broad trend consistent with previous results, but the random scatter is comparable to the correlation. One source (#30) shows spectrum dominated by plasma temperature above 60 MK ( keV). Such super-hot temperatures are seen only during rare powerful flares on the Sun, but were seen with Chandra in of the Orion Nebula Cluster sources (F02). It is possible that the prevalence of super-hot plasmas requires non-solar-like magnetic reconnection, perhaps involving star-disk magnetic interaction (e.g. Hayashi et al., 1996; Montmerle et al., 2000), but the evidence for this model is not yet convincing.
A second issue concerns the complexity of individual spectra. The Sun and magnetically active stars exhibit a distribution of emission measures over a wide range of temperatures (e.g. Brinkman et al., 2001). Time-variable abundance anomalies are present in some solar flares, and were recently found to be very prominent in powerful flares of magnetically active stars. The NGC 1333 sources are generally too faint to reveal such effects, but some hints emerge. Figure 6d shows that a one-temperature plasma model gives a poor fit in the keV range. This could either be due to a several-fold excess of sulfur and argon compared to solar abundances or, more probably, to a multi-component plasma with temperatures from keV.
Figure 13 shows the spectrum of the CTT star LkH 270 (source #79 with 1707 counts) which clearly needs a two-temperature model. The top panel shows a two-temperature model with components at 0.5 and 3.1 keV. Note the discrepancies around keV; the spectrum shows a narrow line from the Lyman- transition of hydrogenic neon at 1.02 keV, while the model has a weaker neon line with a broad shoulder towards higher energies due to L-shell emission lines from iron-group elements. The bottom panel shows a two-temperature model where the abundance of neon is enhanced 2.5 times over solar levels and iron-like elements are reduced to 0.4 times solar levels. This reproduces the observed line shape nicely, and the ratio [Ne]/[Fe] is similar to the ‘Inverse First Ionization Potential effect’ recently seen in high-resolution X-ray spectra of stellar flares in older magnetically active stars (Brinkman et al., 2001; Audard et al., 2001; Huenemoerder, Canizares, & Schulz, 2001) and TW Hya, the nearest classical T Tauri star (Kastner et al., 2001). Although the signal-to-noise ratio in the NGC 1333 spectra is not sufficiently high to measure abundance effects with statistical significance, Figure 13 lends confidence that such studies can be conducted with non-dispersed Chandra ACIS CCD spectra. If the high [Ne]/[Fe] ratio is confirmed, it would further demonstrate that the X-ray emission mechanism of classical T Tauri stars is similar to that of magnetically active stars without circumstellar disks.
11 X-ray emission from the sources of HH outflows and embedded object
Protostellar jets in NGC 1333 are detected by their optical line emission (Bally, Devine, & Reipurth, 1996; Bally & Reipurth, 2001, see Figure 4), infrared H2 line emission (Garden, Russell, & Burton, 1990), radio continuum emission (Rodríguez, Anglada, & Curiel, 1999), and CO emission (Knee & Sandell, 2000). Many jets are highly collimated, consisting of a series of knots and bow shocks, extending as far as several parsecs out from the driving stellar system. Jet power appears to decline from the youngest protostellar Class 0 stage through the classical T Tauri Class II stage, presumably due to a decline in accretion rate from the disk onto the star. These jets are powered by the gravitational energy liberated in the accretion disk and are supplied by both disk and shocked ambient material. Magnetic fields are critical for converting planar Keplerian motions in the disk to polar ejection. Reipurth & Bally (2001) and Hartigan et al. (2000) provide a more extensive background on these issues. Coupling between fields and the disk material requires a modest ionization fraction; YSO X-ray emission may be an important source of this ionization (Glassgold et al., 2001).
NGC 1333 has a number of relatively lightly absorbed YSOs driving jets or outflows. The C-shaped symmetry and external irradiation of these jets suggests that their host stars have been dynamically ejected from the cloud core (Bally & Reipurth, 2001). Seven of these YSOs are detected in our Chandra observation. Their locations are shown in red in Figure 4 and their X-ray properties are denoted as filled circles in Figure 10. We describe them individually here:
- ACIS source #14 = LkH 351
-
This object has a knotty H jet (HH 495; Bally & Reipurth, 2001). The X-ray source has an average luminosity of erg s-1, a relatively soft and unabsorbed spectrum ( keV, cm-2), and a ‘Constant’ variability class. It is curious that its colors do not indicate an infrared excess.
- #23 = HJ 109
-
This source drives a bent [SII]-bright jet (HH 498; Bally & Reipurth, 2001). Its X-ray properties are typical for cluster members: erg s-1, cm-2, and keV. This source exhibits an X-ray flare.
- #41 = HJ 8
-
This source drives a bipolar, asymmetrical and knotty jet (HH 334; Bally & Reipurth, 2001). X-ray source is weak and absorbed with erg s-1.
- #50 = HJ 12
-
This source is the originator of bright bent jets emerging from both sides of the star ending in terminal shocks (HH 499; Bally & Reipurth, 2001). The X-ray source is very weak (9 counts) and heavily absorbed with erg s-1.
- #79 = LkH 270
-
This source lies in the middle of the NGC 1333 reflection nebula and drives a monopolar, knotty and bent jet 1 long (HH 335; Bally, Devine, & Reipurth, 1996; Bally & Reipurth, 2001). The X-ray luminosity is above average for the cluster at erg s-1, and a flare was seen during the observation. Its spectral properties are ordinary ( keV, cm-2), but non-solar elemental abundances may be present (see §10 and Figure 13) .
- #86 = IRAS f
-
This source drives a C-shaped monopolar jet (HH 17; Bally, Devine, & Reipurth, 1996). The X-ray spectrum extracted from only 16 counts indicates high absorption. The X-ray luminosity is below average at erg s-1.
- #90 = LkH 271 = SVS 20
-
The flow from this YSO is seen close to the star as a small and bright H bow shock (HH 346) and can be traced to a bright arc (HH 345) 3′ away (Bally, Devine, & Reipurth, 1996). Faint wisps of H emission may trace a counterflow. As in the case of source #86, the X-ray source is weak and highly absorbed with erg s-1.
From their location in the distributions shown in Figure 10 and from the details given above, we do not find any significant differences between the X-ray properties of the jet-driving YSOs and the rest of the young stellar population in NGC 1333.
More than 20 YSOs in the NGC 1333 star forming region produce jets or molecular outflows (Knee & Sandell, 2000; Bally, Devine, & Reipurth, 1996; Bally & Reipurth, 2001). The ACIS image does not reveal X-rays from some of the youngest, deeply embedded Class 0 and Class I protostars (Sandell & Knee, 2001; Rudolph et al., 2001; Reipurth et al., 2002, and references therein). The M⊙ dense molecular ridge at the base of the high-velocity HH 7-11 outflow has several YSOs including SVS 13 (IRAS 3 and optically visible), SVS 13B (Class 0), VLA 2 (also a water maser), VLA 3, and VLA 20. The far-IR/submillimeter sources IRAS 2A (Class 0), 2B and 2C drive at least two molecular bipolar flows. IRAS 7 drives the HH 6 jet near the center of the ACIS field; it is also a complicated system with several submillimeter/radio components and multiple jets. The protostellar multiple source IRAS 4A-C also drive two bipolar flows. None of these well-studied protostars appear in the ACIS-I image.
Our failure to detect the youngest Class 0 protostars in NGC 1333 is consistent with them having the same luminosity distribution as the Class I and T Tauri stars with typical erg s-1 but with substantially higher absorptions. However, it stands in contrast to the reported ACIS-I detection of MMS 2 and MMS 3 in the Orion OMC-3 cloud cores with absorptions of cm-2 and luminosities erg s-1 (Tsuboi et al., 2001). Our observation has the same level of sensitivity as the OMC-2/3 observation and we would have detected emission at that level. The levels seen in these Orion protostars may be drawn from a larger population of protostars and represent the high end of the Class 0 X-ray luminosity function. It may also be the case that the protostars in the OMC observation, with an exposure time more than twice that of our observation, have been detected while they were in a high variability state.
Sekimoto et al. (1997) suggested that protostars may be preferentially detected in X-rays when viewed along the jet axis, where local obscuration may be reduced. Our results are roughly consistent with this scenario; for example, we detect two sources (SVS 20, which ejects HH 345-346, and LkH 270, which ejects HH 335) with high-radial velocity jets and optically visible sources and do not detect objects (sources of HH 333, 336) with low-radial velocity jets (Bally, Devine, & Reipurth, 1996; Bally & Reipurth, 2001). But the small number of objects, the difficulty in establishing jet orientations, and wide differences in obscuration prevent us from establishing this idea with confidence.
Notably, we detected X-ray emission from a deeply embedded object (#49), probably a Class I protostar located in the vicinity of HH 7-11, that is not detected in optical or near-IR observations but has mm/submm/radio counterparts (see Table 1)888Source #49 = MMS5 had been mistakenly classified as a T Tauri star (Chini et al., 2001) because of the incorrect identification of this object with the near-IR source ASR 7.. The X-ray luminosity of about erg s-1 (see Table 2) is similar to those of the embedded young stellar objects in other regions (Feigelson & Montmerle, 1999; Preibisch & Zinnecker, 2001). Interestingly, #49 is also a variable and circularly polarized gyrosynchrotron radio source VLA 19 (Rodríguez, Anglada, & Curiel, 1999), and joins CrA-IRS 5 (Feigelson, Carkner, & Wilking, 1998) as the only known X-ray/radio flaring protostar.
12 Other interesting sources
- #39, 1 northwest from HH 7-11 region
-
Infrared photometry (e.g. Aspin, Sandell, & Russel, 1994; Aspin & Sandell, 1997; Lada, Alves, & Lada, 1996) shows that SVS 16 is highly obscured (). Preibisch, Neuhäuser, & Stanke (1998) report this is a binary system consisting of two very young M-type PMS stars without significant amount of circumstellar matter with a separation of 1. ROSAT data (Preibisch, 1997b; Preibisch, Neuhäuser, & Stanke, 1998) indicated SVS 16 has an extremely high constant X-ray luminosity erg s-1 in the keV, based on the extinction of mag from near-IR data. In contrast to that result, Chandra data indicate an evident flare showing a much lower column density cm-2 or (Figure 14). The presence of soft X-rays indicates that the source is not very deeply embedded into the cloud. The lower column density reduces the inferred corrected X-ray luminosity to erg s-1. Both IR and X-ray data are quite reliable and suggest that the plasma emitting the X-rays does not originate in the same region as the IR emission from this source.
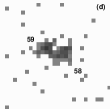
- #58 and #59, Figure 2d
-
Source #58 is a known classical T-Tauri star exhibiting strong variation and large circular polarization in the radio continuum (Rodríguez, Anglada, & Curiel, 1999), which indicates the presence of gyrosynchrotron emission from particles accelerated in situ by magnetic reconnection flares. This demonstrates the similarity in the production mechanism of the X-ray emission to that of magnetically active WTTs (Feigelson & Montmerle, 1985). The only known optical counterpart (from our KPNO image) has , which means that the source is deeply embedded into the molecular cloud. Chandra source #59 is an X-ray discovered companion to the #58. It has a projected separation of AU) from #58 (Figure 2d). Both components have nearly identical spectra with cm-2, suggesting it may be a physical binary. With 71 counts, #59 exhibits an X-ray flare.
- #65 and #64, Figure 2e
-
At optical and infrared wavelengths it is hard to detect any objects in the vicinity of SVS 3 (#64) because of its extreme brightness. The difference between X-ray brightnesses is not so dramatic, even with the moderately high luminosity erg s-1 for SVS 3, so we are able to discover a flaring young T-Tauri star (#65) with a projected separation of 3 from SVS 3 (Figure 2e). An X-ray spectrum extracted from 153 counts shows about the same absorption column density cm-2 for source #65 as for SVS 3 and the plasma energy of keV.
13 Conclusions
We present a 37.8 ks Chandra ACIS observation of the NGC 1333 star formation region within the Perseus molecular cloud complex. The main conclusions of our study are as follows:
-
1.
We detect 127 X-ray sources with a limiting luminosity of erg s-1. Among them, 30 are probably extragalactic background objects, and 2 are foreground stars. The remaining 95 (77 bright and 18 faint tentative ACIS sources) are identified with cluster members. Two T Tauri stars are discovered in the ACIS images as previously unknown components of visual binaries.
-
2.
The X-ray luminosity function of the sample of 77 bright cluster members is approximately lognormal with mean and standard deviation erg s-1 after correction for interstellar absorption. Most of the sources have plasma energies between keV, a typical range for the X-ray active T Tauri stars. The trend between increased variability and increased hardness ratio can not be discerned.
-
3.
A complete K-band luminosity function distribution of the observed region including Table 3 indicates that we detect all cluster members with and over half of members with . Their average K-band magnitude of corresponds to masses between M⊙ for a cluster age of Myr.
-
4.
We find a good correlation which confirms a well known relation found in many star forming regions.
-
5.
The observed X-ray emission from two late-B stars is consistent with emission originating from unresolved late-type companions.
-
6.
We detect seven X-ray emitting YSOs which drive optically visible jets as well as one deeply embedded object that has not been detected in near-IR observations. The last one is presumably Class I protostar.
-
7.
We also find no systematic differences in X-ray luminosity distributions between two complete subsamples of CTTs and WTTs. That suggests that there is no difference in the astrophysical mechanism of WTT and CTT X-ray emission production. The presence or absence of an outflows does not appear to produce any difference in X-ray properties of YSOs.
-
8.
We find that the X-ray counterpart of SVS 16 has the column density much lower than that expected from near-IR photometry and thus its X-ray luminosity is not anomalously high, as has been previously suggested.
References
- Aspin, Sandell, & Russel (1994) Aspin, C., Sandell, G., & Russell, A. P. G. 1994, A&AS, 106, 165
- Aspin & Sandell (1997) Aspin, C. & Sandell, G. 1997, MNRAS, 289, 1
- Audard et al. (2001) Audard, M., et al. 2001, 12th Cool Stars, Stellar Systems and the Sun, eds. A. Brown, T.R. Ayres, G.M. Harper, (Boulder: Univ. of Colorado), in press
- Bally, Devine, & Reipurth (1996) Bally, J., Devine, D., & Reipurth, B. 1996, ApJ, 473, L49
- Bally & Reipurth (2001) Bally, J. & Reipurth, B. 2001, ApJ, 546, 299
- Bessell & Brett (1988) Bessell, M. S. & Brett, J. M. 1988, PASP, 100, 1134
- Brandt et al. (2001a) Brandt, W. N. et al. 2001a, AJ, 122, 1
- Brandt et al. (2001b) Brandt, W. N. et al. 2001b, AJ, 122, 2810
- Brinkman et al. (2001) Brinkman, A. C. et al. 2001, A&A, 365, L324
- Cargill (1994) Cargill, P. J. 1994, ApJ, 422, 381
- Casanova et al. (1995) Casanova, S., Montmerle, T., Feigelson, E. D., & André, P. 1995, ApJ, 439, 752
- Černis (1990) Černis, K. 1990, Ap&SS, 166, 315
- Černis (1993) Černis, K. 1993, Baltic Astronomy, 2, 214
- Chini et al. (2001) Chini, R., Ward-Thompson, D., Kirk, J. M., Nielbock, M., Reipurth, B., & Sievers, A. 2001, A&A, 369, 155
- Cohen et al. (1981) Cohen, J. G., Persson, S. E., Elias, J. H., & Frogel, J. A. 1981, ApJ, 249, 481
- de Zeeuw et al. (1999) de Zeeuw, P. T., Hoogerwerf, R., de Bruijne, J. H. J., Brown, A. G. A., & Blaauw, A. 1999, AJ, 117, 354
- Drake et al. (2000) Drake, J. J., Peres, G., Orlando, S., Laming, J. M., & Maggio, A. 2000, ApJ, 545, 1074
- Feigelson & Montmerle (1985) Feigelson, E. D. & Montmerle, T. 1985, ApJ, 289, L19
- Feigelson & Babu (1992) Feigelson, E. D. & Babu, G. J. 1992, ApJ, 397, 55
- Feigelson et al. (1993) Feigelson, E. D., Casanova, S., Montmerle, T., & Guibert, J. 1993, ApJ, 416, 623
- Feigelson, Carkner, & Wilking (1998) Feigelson, E. D., Carkner, L., & Wilking, B. A. 1998, ApJ, 494, L215
- Feigelson & Montmerle (1999) Feigelson, E. D. & Montmerle, T. 1999, ARA&A, 37, 363
- Feigelson et al. (2002) Feigelson, E. D., Broos, P., Gaffney, J. A. Garmire, G., Hillenbrand, L., Pravdo, S. P., Townsley, L., Tsuboi, Y. 2002, ApJ, in press, astro-ph/0203316 [F02]
- Freeman et al. (2002) Freeman, P. E., Kashyap, V., Rosner, R., & Lamb, D. Q. 2002, ApJS, 138, 185
- Garden, Russell, & Burton (1990) Garden, R. P., Russell, A. P. G., & Burton, M. G. 1990, ApJ, 354, 232
- Getman & Livshits (2000) Getman, K. V. & Livshits, M. A. 2000, Astronomy Reports, 44, 255
- Glassgold et al. (2001) Glassgold, A. E., Shang, H., Shu, F. H., & Lizano, S. 2001, American Astronomical Society Meeting, 198, 2802
- Greene et al. (1994) Greene, T. P., Wilking, B. A., Andre, P., Young, E. T., & Lada, C. J. 1994, ApJ, 434, 614
- Grosso et al. (2000) Grosso, N., Montmerle, T., Bontemps, S., André, P., & Feigelson, E. D. 2000, A&A, 359, 113
- Güedel (1997) Güedel, M. 1997, ApJ, 480, L121
- Güedel, Guinan, & Skinner (1997) Güedel, M., Guinan, E. F., & Skinner, S. L. 1997, ApJ, 483, 947
- Harju et al. (1998) Harju, J., Lehtinen, K., Booth, R. S., & Zinchenko, I. 1998, A&AS, 132, 211
- Hartigan et al. (2000) Hartigan, P., Bally, J., Reipurth, B., & Morse, J. A. 2000, Protostars and Planets IV, 841
- Hayashi et al. (1996) Hayashi, M. R., Shibata, K., & Matsumoto, R. 1996, ApJ, 468, L37
- Herbig (1956) Herbig, G. H. 1956, PASP, 68, 353
- Herbig & Jones (1983) Herbig, G. H. & Jones, B. F. 1983, AJ, 88, 1040
- Herbig & Bell (1988) Herbig, G. H. & Bell, K. R. 1988, Lick Obs. Bull.
- Herbig (1998) Herbig, G. H. 1998, ApJ, 497, 736
- Huenemoerder, Canizares, & Schulz (2001) Huenemoerder, D. P., Canizares, C. R., & Schulz, N. S. 2001, ApJ, 559, 1135
- Imanishi, Koyama, & Tsuboi (2001) Imanishi, K., Koyama, K., & Tsuboi, Y. 2001, ApJ, 557, 747
- Jennings et al. (1987) Jennings, R. E., Cameron, D. H. M., Cudlip, W., & Hirst, C. J. 1987, MNRAS, 226, 461
- Kastner et al. (2001) Kastner, J. H., Huenemoerder, D. P., Schulz, N. S., Canizares, C. R., & Weintraubet, D. A. 2001, ApJ, in press (astro-ph/0111049)
- Knee & Sandell (2000) Knee, L. B. G. & Sandell, G. 2000, A&A, 361, 671
- Krishnamurthi et al. (2001) Krishnamurthi, A., Reynolds, C. S., Linsky, J. L., Martín, E., & Gagné, M. 2001, AJ, 121, 337
- Lada et al. (1974) Lada, C. J., Gottlieb, C. A., Litvak, M. M., & Lilley, A. E. 1974, ApJ, 194, 609
- Lada & Lada (1995) Lada, E. A. & Lada, C. J. 1995, AJ, 109, 1682
- Lada, Alves, & Lada (1996) Lada, C. J., Alves, J., & Lada, E. A. 1996, AJ, 111, 1964
- Liedahl, Osterheld, & Goldstein (1995) Liedahl, D. A., Osterheld, A. L., & Goldstein, W. H. 1995, ApJ, 438, L115
- Looney, Mundy, & Welch (2000) Looney, L. W., Mundy, L. G., & Welch, W. J. 2000, ApJ, 529, 477
- Mathieu et al. (2000) Mathieu, R. D., Ghez, A. M., Jensen, E. L. N., & Simon, M. 2000, Protostars and Planets IV, 703
- Mewe, Lemen, & van den Oord (1986) Mewe, R., Lemen, J. R., & van den Oord, G. H. J. 1986, A&AS, 65, 511
- Meyer, Calvet, & Hillenbrand (1997) Meyer, M. R., Calvet, N., & Hillenbrand, L. A. 1997, AJ, 114, 288
- Monet (1998) Monet, D. G. 1998, American Astronomical Society Meeting, 193, 112003
- Montmerle et al. (2000) Montmerle, T., Grosso, N., Tsuboi, Y., & Koyama, K. 2000, ApJ, 532, 1097
- Morrison & McCammon (1983) Morrison, R. & McCammon, D. 1983, ApJ, 270, 119
- Neuhäuser et al. (1995) Neuhäuser, R., Sterzik, M. F., Schmitt, J. H. M. M., Wichmann, R., & Krautter, J. 1995, A&A, 297, 391
- Pallavicini (1989) Pallavicini, R. 1989, A&A Rev., 1, 177
- Preibisch (1997a) Preibisch, T. 1997a, A&A, 320, 525
- Preibisch (1997b) Preibisch, T. 1997b, A&A, 324, 690
- Preibisch, Neuhäuser, & Stanke (1998) Preibisch, T., Neuhäuser, R., & Stanke, T. 1998, A&A, 338, 923
- Preibisch & Zinnecker (2001) Preibisch, T. & Zinnecker, H. 2001, AJ, 122, 866
- Preibisch & Zinnecker (2002) Preibisch, T. & Zinnecker, H. 2002, AJ, 123, 1613
- Reale, Peres, & Orlando (2001) Reale, F., Peres, G., & Orlando, S. 2001, ApJ, 557, 906
- Reipurth & Bally (2001) Reipurth, B. & Bally, J. 2001, ARA&A, 39, 403
- Reipurth et al. (2002) Reipurth, B., Rodríguez, L.F., Anglada, G., & Bally, J. 2002, AJ, submitted
- Rodríguez, Anglada, & Curiel (1999) Rodríguez, L. F., Anglada, G., & Curiel, S. 1999, ApJS, 125, 427
- Rosner, Tucker, & Vaiana (1978) Rosner, R., Tucker, W. H., & Vaiana, G. S. 1978, ApJ, 220, 643
- Rudolph et al. (2001) Rudolph, A. L., Bachiller, R., Rieu, N. Q., Van Trung, D., Palmer, P., & Welch, W. J. 2001, ApJ, 558, 204
- Ryter (1996) Ryter, C. E. 1996, Ap&SS, 236, 285
- Sandell & Knee (2001) Sandell, G. & Knee, L. B. G. 2001, ApJ, 546, L49
- Schmitt et al. (1985) Schmitt, J. H. M. M., Golub, L., Harnden, F. R., Maxson, C. W., Rosner, R., & Vaiana, G. S. 1985, ApJ, 290, 307
- Schmitt et al. (1990) Schmitt, J. H. M. M., Collura, A., Sciortino, S., Vaiana, G. S., Harnden, F. R., & Rosner, R. 1990, ApJ, 365, 704
- Sekimoto et al. (1997) Sekimoto, Y., Tatematsu, K., Umemoto, T., Koyama, K., Tsuboi, Y., Hirano, N., & Yamamoto, S. 1997, ApJ, 489, L63
- Simon, Drake, & Kim (1995) Simon, T., Drake, S. A., & Kim, P. D. 1995, PASP, 107, 1034
- Stelzer & Neuhäuser (2001) Stelzer, B. & Neuhäuser, R. 2001, A&A, 377, 538
- Strom, Vrba, & Strom (1976) Strom, S. E., Vrba, F. J., & Strom, K. M. 1976, AJ, 81, 314
- Townsley et al. (2000) Townsley, L. K., Broos, P. S., Garmire, G. P., & Nousek, J. A. 2000, ApJ, 534, L139
- Townsley et al. (2002a) Townsley, L. K., Broos, P. S., Garmire, G. P., & Nousek, J. A. 2002a, Nuclear Instruments and Methods in Physics Research, in press, astro-ph/0111031
- Townsley et al. (2002b) Townsley, L. K., Broos, P. S., Chartas, G., Moskalenko E., Nousek, J. A., & Pavlov, G. G. 2002b, Nuclear Instruments and Methods in Physics Research, in press, astro-ph/0111003
- Tsuboi et al. (1998) Tsuboi, Y., Koyama, K., Murakami, H., Hayashi, M., Skinner, S., & Ueno, S. 1998, ApJ, 503, 894
- Tsuboi et al. (2001) Tsuboi, Y., Koyama, K., Hamaguchi, K., Tatematsu, K., Sekimoto, Y., Bally, J., & Reipurth, B. 2001, ApJ, 554, 734
- Vrba, Strom, & Strom (1976) Vrba, F. J., Strom, S. E., & Strom, K. M. 1976, AJ, 81, 958
- Warin et al. (1996) Warin, S., Castets, A., Langer, W. D., Wilson, R. W., & Pagani, L. 1996, A&A, 306, 935
- Weisskopf et al. (2002) Weisskopf, M. C., Brinkman, B., Canizares, C., Garmire, G., Murray, S., & Van Speybroeck, L. P. 2002, PASP, 114, 1


| X-ray source | Optical counterpart | Near-IR counterpart | Notes | |||||||||||||||
|---|---|---|---|---|---|---|---|---|---|---|---|---|---|---|---|---|---|---|
| Src | CXONGC1333 J | R.A. | Dec. | Pr | HJ | BR | USNO | KPNO-I | ASR | LAL | K | J-H | H-K | |||||
| # | (J2000) | ′ | # | # | ″ | (mag) | # | # | (mag) | (mag) | (mag) | |||||||
| 1 | 032829.4+312508 | 03 28 29.47 | +31 25 08.1 | 9.7 | ||||||||||||||
| 2 | 032831.9+312121 | 03 28 31.96 | +31 21 21.3 | 7.6 | ||||||||||||||
| 3 | 032835.0+312112 | 03 28 35.04 | +31 21 12.5 | 6.9 | ||||||||||||||
| 4 | 032836.4+311929 | 03 28 36.46 | +31 19 29.7 | 6.4 | 29 | yes | 0.5 | 14.5 | 55 | 11.83 | 0.57 | 0.28 | ||||||
| 5 | 032836.8+312312 | 03 28 36.88 | +31 23 12.6 | 7.3 | 4 | 110 | yes | 0.7 | 14.2 | |||||||||
| 6 | 032836.8+311735 | 03 28 36.89 | +31 17 35.9 | 6.7 | 3 | 28 | yes | 0.3 | 15.1 | 56 | 10.20 | 1.11 | 0.60 | |||||
| 7 | 032837.1+311954 | 03 28 37.19 | +31 19 54.9 | 6.3 | ||||||||||||||
| 8 | 032837.8+312525 | 03 28 37.83 | +31 25 25.9 | 8.5 | ||||||||||||||
| 9 | 032843.2+311733 | 03 28 43.24 | +31 17 33.1 | 5.4 | 27 | yes | 15.9 | 126 | Bl | 10.19 | 1.81 | 1.21 | ||||||
| 10 | 032843.5+311737 | 03 28 43.52 | +31 17 37.1 | 5.3 | 26 | yes | 1.7 | 15.6 | 127 | 79 | 9.87 | 0.98 | 0.71 | |||||
| 11 | 032844.0+312052 | 03 28 44.01 | +31 20 52.8 | 5.0 | yes | 17.6 | 83 | 12.74 | 0.79 | 0.58 | ||||||||
| 12 | 032845.4+312050 | 03 28 45.40 | +31 20 50.9 | 4.7 | ||||||||||||||
| 13 | 032845.4+312227 | 03 28 45.47 | +31 22 28.0 | 5.3 | ||||||||||||||
| 14 | 032846.1+311639 | 03 28 46.15 | +31 16 39.0 | 5.3 | 5 | 30 | yes | 0.4 | 14.2 | 128 | 89 | 9.76 | 0.73 | 0.29 | ||||
| 15 | 032847.6+312405 | 03 28 47.63 | +31 24 05.5 | 6.1 | yes | 17.9 | 93 | 11.24 | 2.04 | 1.14 | ||||||||
| 16 | 032847.8+311655 | 03 28 47.80 | +31 16 55.7 | 4.8 | 32 | yes | 16.3 | 111 | 97 | 10.94 | 0.99 | 0.86 | ||||||
| 17 | 032850.3+312755 | 03 28 50.37 | +31 27 55.2 | 9.1 | ||||||||||||||
| 18 | 032850.8+312349 | 03 28 50.88 | +31 23 49.3 | 5.4 | 19.8 | |||||||||||||
| 19 | 032850.9+311818 | 03 28 50.99 | +31 18 18.9 | 3.5 | 6 | yes | 0.2 | 14.0 | 122 | 106 | 9.20 | 1.32 | 1.12 | |||||
| 20 | 032850.9+311632 | 03 28 51.00 | +31 16 32.2 | 4.5 | 33 | yes | 1.0 | 15.5 | 44 | 107 | 12.22 | 0.68 | 0.37 | |||||
| 21 | 032851.1+311955 | 03 28 51.17 | +31 19 55.1 | 3.3 | 7 | 9 | yes | 0.1 | 14.2 | 125 | 110 | 9.97 | 1.09 | 0.65 | ||||
| 22 | 032852.0+311548 | 03 28 52.09 | +31 15 48.1 | 4.9 | 42 | yes | 0.5 | 16.1 | 45 | 125 | 12.08 | 0.54 | 0.45 | |||||
| 23 | 032852.1+312245 | 03 28 52.12 | +31 22 45.7 | 4.4 | 109 | yes | 0.3 | 14.1 | 120 | 11.67 | 0.91 | 0.57 | ||||||
| 24 | 032853.5+311537 | 03 28 53.58 | +31 15 38.0 | 4.9 | ||||||||||||||
| 25 | 032853.9+311809 | 03 28 53.92 | +31 18 10.0 | 3.0 | 21.7 | 40 | 129 | 10.94 | 2.10 | 1.47 | ||||||||
| 26 | 032854.0+311654 | 03 28 54.04 | +31 16 54.8 | 3.8 | 37 | yes | 15.8 | 42 | 131 | 11.71 | 0.85 | 0.47 | ||||||
| 27 | 032854.6+311651 | 03 28 54.61 | +31 16 51.6 | 3.8 | 38 | yes | 16.2 | 43 | 136 | 10.28 | 1.43 | 0.94 | ||||||
| 28 | 032855.0+311629 | 03 28 55.03 | +31 16 29.3 | 4.0 | 35 | yes | 17.7 | 107 | 141 | 10.44 | 1.49 | 0.93 | ||||||
| 29 | 032856.5+312240 | 03 28 56.54 | +31 22 40.7 | 3.7 | ||||||||||||||
| 30 | 032856.6+311836 | 03 28 56.62 | +31 18 36.2 | 2.3 | 8 | 21 | yes | 0.1 | 15.5 | 120 | 150 | 9.80 | 1.51 | 1.01 | ||||
| 31 | 032856.8+311811 | 03 28 56.81 | +31 18 11.2 | 2.5 | ||||||||||||||
| 32 | 032856.9+311622 | 03 28 56.95 | +31 16 22.8 | 3.9 | 39 | yes | 17.9 | 118 | 154 | 10.25 | 1.77 | 1.37 | ||||||
| 33 | 032857.1+311419 | 03 28 57.19 | +31 14 19.4 | 5.7 | 10 | yes | 0.5 | 18.1 | 130 | 157 | 7.84 | 0.29 | 0.34 | |||||
| 34 | 032857.4+311950 | 03 28 57.41 | +31 19 50.6 | 1.9 | 9 | 19 | yes | 14.5 | 115 | 158 | 10.65 | 0.89 | 0.52 | |||||
| 35 | 032857.6+311948 | 03 28 57.67 | +31 19 48.3 | 1.8 | 20 | yes | 1.3 | 15.7 | 113 | Bl | 10.43 | 0.73 | 0.68 | |||||
| 36 | 032858.0+311804 | 03 28 58.08 | +31 18 04.2 | 2.4 | 7 | yes | 0.3 | 14.8 | 36 | 162 | 11.46 | 0.90 | 0.45 | |||||
| 37 | 032858.2+312541 | 03 28 58.25 | +31 25 41.4 | 6.4 | ||||||||||||||
| 38 | 032858.4+312218 | 03 28 58.45 | +31 22 18.2 | 3.2 | 166 | 11.35 | ||||||||||||
| 39 | 032859.2+311548 | 03 28 59.28 | +31 15 48.9 | 4.2 | 11 | 106 | 171 | 10.15 | 3.75 | 2.65 | ||||||||
| 40 | 032859.3+312640 | 03 28 59.31 | +31 26 40.1 | 7.3 | ||||||||||||||
| 41 | 032859.5+312146 | 03 28 59.51 | +31 21 47.0 | 2.6 | 8 | yes | 0.4 | 14.5 | 173 | 10.33 | 1.07 | 1.00 | ||||||
| 42 | 032900.1+312109 | 03 29 00.13 | +31 21 10.0 | 2.0 | 22.5 | 175 | 13.29 | 1.69 | 1.24 | |||||||||
| 43 | 032900.2+311338 | 03 29 00.28 | +31 13 38.8 | 6.2 | 12 | 4 | yes | 0.3 | 15.8 | 51 | 178 | 11.49 | 1.04 | 0.54 | ||||
| 44 | 032900.3+312045 | 03 29 00.35 | +31 20 46.0 | 1.7 | 18 | yes | 16.6 | 177 | 11.92 | 0.96 | 0.53 | |||||||
| 45 | 032900.6+312201 | 03 29 00.67 | +31 22 01.1 | 2.7 | 22.5 | 180 | 11.89 | 2.72 | 1.53 | |||||||||
| 46 | 032901.3+311413 | 03 29 01.36 | +31 14 13.2 | 5.6 | ||||||||||||||
| 47 | 032902.1+311611 | 03 29 02.16 | +31 16 11.7 | 3.6 | 40 | yes | 0.4 | 15.9 | 3 | 184 | 13.70 | 0.56 | 0.20 | |||||
| 48 | 032902.8+311601 | 03 29 02.87 | +31 16 01.3 | 3.7 | 13 | 6 | yes | 0.5 | 14.2 | 2 | 188 | 11.97 | 0.59 | 0.20 | ||||
| 49 | 032903.0+311516 | 03 29 03.02 | +31 15 17.0 | 4.5 | ||||||||||||||
| 50 | 032903.1+312238 | 03 29 03.13 | +31 22 38.3 | 3.1 | 12 | yes | 0.7 | 17.0 | 189 | 12.25 | 1.05 | 1.18 | ||||||
| 51 | 032903.4+311618 | 03 29 03.48 | +31 16 18.2 | 3.4 | 132 | 15.14 | ||||||||||||
| 52 | 032903.8+312149 | 03 29 03.84 | +31 21 49.1 | 2.3 | 14 | 11 | yes | 0.4 | 14.3 | 195 | 9.36 | 1.19 | 0.87 | |||||
| 53 | 032904.0+311708 | 03 29 04.05 | +31 17 08.1 | 2.6 | 23 | yes | 0.3 | 15.5 | 8 | 199 | 12.49 | 0.50 | 0.28 | |||||
| 54 | 032904.1+312515 | 03 29 04.19 | +31 25 15.8 | 5.7 | yes | 17.5 | 198 | 11.00 | 1.55 | 0.92 | ||||||||
| 55 | 032904.3+312624 | 03 29 04.35 | +31 26 24.3 | 6.9 | ||||||||||||||
| 56 | 032904.7+311133 | 03 29 04.74 | +31 11 33.5 | 8.2 | 99 | 205 | 14.21 | 2.64 | ||||||||||
| 57 | 032904.9+312038 | 03 29 04.90 | +31 20 38.4 | 1.1 | 204 | 12.67 | ||||||||||||
| 58 | 032905.7+311640 | 03 29 05.74 | +31 16 40.1 | 3.0 | 22.0 | 7 | 207 | 10.02 | 2.52 | 1.65 | ||||||||
| 59 | 032905.9+311640 | 03 29 05.90 | +31 16 40.6 | 3.0 | Conf | Bl | ||||||||||||
| 60 | 032906.6+311933 | 03 29 06.60 | +31 19 33.8 | 0.1 | ||||||||||||||
| 61 | 032907.9+312252 | 03 29 07.96 | +31 22 52.5 | 3.3 | 13 | yes | 16.9 | 215 | 10.40 | 1.62 | 0.97 | |||||||
| 62 | 032908.7+311314 | 03 29 08.72 | +31 13 14.7 | 6.5 | ||||||||||||||
| 63 | 032909.1+312306 | 03 29 09.11 | +31 23 06.3 | 3.6 | yes | 19.7 | 222 | 11.68 | 1.43 | 1.16 | ||||||||
| 64 | 032910.3+312159 | 03 29 10.38 | +31 21 59.7 | 2.6 | 15 | yes | 15.7 | 230 | 7.45 | 1.11 | 0.78 | |||||||
| 65 | 032910.5+312202 | 03 29 10.59 | +31 22 02.0 | 2.6 | 15 | Conf | Bl | |||||||||||
| 66 | 032910.7+312230 | 03 29 10.79 | +31 22 30.6 | 3.1 | yes | 18.6 | 233 | 12.89 | 1.05 | 0.62 | ||||||||
| 67 | 032911.2+311718 | 03 29 11.29 | +31 17 18.1 | 2.6 | yes | 16.8 | 24 | 243 | 12.97 | 0.44 | 0.45 | |||||||
| 68 | 032911.8+312216 | 03 29 11.83 | +31 22 16.3 | 3.0 | ||||||||||||||
| 69 | 032911.8+312127 | 03 29 11.87 | +31 21 27.4 | 2.2 | 248 | 12.51 | ||||||||||||
| 70 | 032912.8+312008 | 03 29 12.80 | +31 20 08.0 | 1.5 | yes | 17.5 | 83 | 257 | 13.35 | 0.64 | 0.41 | |||||||
| 71 | 032912.9+311815 | 03 29 12.93 | +31 18 15.1 | 2.0 | 30 | 261 | 14.23 | |||||||||||
| 72 | 032913.1+312253 | 03 29 13.13 | +31 22 53.4 | 3.7 | 15 | yes | 16.1 | 262 | 9.98 | 1.60 | 1.18 | |||||||
| 73 | 032913.4+312441 | 03 29 13.48 | +31 24 41.3 | 5.4 | ||||||||||||||
| 74 | 032914.0+312214 | 03 29 14.09 | +31 22 14.4 | 3.2 | ||||||||||||||
| 75 | 032914.4+312236 | 03 29 14.43 | +31 22 36.8 | 3.5 | yes | 17.5 | 269 | 13.11 | ||||||||||
| 76 | 032915.6+311852 | 03 29 15.61 | +31 18 52.4 | 2.2 | ||||||||||||||
| 77 | 032916.5+312348 | 03 29 16.57 | +31 23 49.0 | 4.8 | yes | 16.5 | 276 | 11.17 | 1.22 | 0.57 | ||||||||
| 78 | 032916.6+311618 | 03 29 16.67 | +31 16 18.9 | 4.1 | 16 | 3 | yes | 0.3 | 14.3 | 121 | 280 | 10.51 | 0.59 | 0.20 | ||||
| 79 | 032917.6+312245 | 03 29 17.67 | +31 22 45.7 | 4.1 | 17 | 103 | yes | 0.6 | 14.3 | 283 | 8.32 | 0.85 | 0.61 | |||||
| 80 | 032918.5+311926 | 03 29 18.58 | +31 19 26.2 | 2.7 | ||||||||||||||
| 81 | 032918.7+312326 | 03 29 18.72 | +31 23 26.1 | 4.7 | 18 | 102 | yes | 0.3 | 14.4 | 293 | 11.23 | 0.66 | 0.25 | |||||
| 82 | 032919.0+312106 | 03 29 19.07 | +31 21 06.8 | 3.2 | ||||||||||||||
| 83 | 032919.7+312458 | 03 29 19.76 | +31 24 58.4 | 6.2 | yes | 1.4 | yes | 295 | 8.46 | 0.22 | 0.13 | |||||||
| 84 | 032920.0+312408 | 03 29 20.06 | +31 24 08.0 | 5.5 | 296 | 12.47 | ||||||||||||
| 85 | 032920.1+311450 | 03 29 20.16 | +31 14 50.6 | 5.7 | ||||||||||||||
| 86 | 032920.4+311834 | 03 29 20.40 | +31 18 35.0 | 3.3 | yes | 18.9 | 112 | 300 | 9.99 | 2.09 | 1.58 | |||||||
| 87 | 032921.1+311617 | 03 29 21.12 | +31 16 17.1 | 4.7 | ||||||||||||||
| 88 | 032921.5+312111 | 03 29 21.57 | +31 21 11.1 | 3.7 | 17 | yes | 0.5 | 14.5 | 304 | 11.50 | 0.55 | 0.23 | ||||||
| 89 | 032921.6+312515 | 03 29 21.65 | +31 25 15.6 | 6.6 | yes | 16.3 | 303 | 11.82 | 0.84 | 0.41 | ||||||||
| 90 | 032921.8+311537 | 03 29 21.88 | +31 15 37.1 | 5.3 | 46 | yes | 0.4 | 14.3 | 123 | 307 | 9.73 | 1.02 | 0.73 | |||||
| 91 | 032922.0+312415 | 03 29 22.00 | +31 24 15.9 | 5.8 | 100 | yes | 0.3 | 14.2 | 306 | 11.08 | 0.59 | 0.17 | ||||||
| 92 | 032923.2+312030 | 03 29 23.25 | +31 20 30.9 | 3.8 | 2 | yes | 1.5 | 14.4 | 78 | 310 | 11.25 | 0.60 | 0.32 | |||||
| 93 | 032923.5+312331 | 03 29 23.50 | +31 23 31.5 | 5.5 | 101 | yes | 15.2 | 311 | 11.34 | 0.88 | 0.32 | |||||||
| 94 | 032923.7+312510 | 03 29 23.76 | +31 25 10.4 | 6.8 | yes | 16.9 | 312 | 12.43 | 1.00 | 0.43 | ||||||||
| 95 | 032924.1+312109 | 03 29 24.16 | +31 21 09.9 | 4.2 | ||||||||||||||
| 96 | 032924.8+312052 | 03 29 24.87 | +31 20 52.2 | 4.3 | ||||||||||||||
| 97 | 032924.8+312407 | 03 29 24.88 | +31 24 07.2 | 6.1 | yes | 16.6 | 315 | 13.41 | 0.54 | 0.31 | ||||||||
| 98 | 032925.8+312640 | 03 29 25.80 | +31 26 40.2 | 8.3 | yes | 1.4 | 13.6 | 318 | 9.52 | 1.08 | 0.56 | |||||||
| 99 | 032925.8+311347 | 03 29 25.84 | +31 13 47.0 | 7.3 | ||||||||||||||
| 100 | 032926.7+312648 | 03 29 26.80 | +31 26 48.3 | 8.6 | 19 | yes | 0.5 | 13.9 | 321 | 9.71 | 0.70 | 0.31 | ||||||
| 101 | 032928.1+311628 | 03 29 28.15 | +31 16 29.0 | 5.8 | 48 | yes | 0.2 | 15.7 | 328 | 12.07 | 0.46 | 0.28 | ||||||
| 102 | 032929.2+311835 | 03 29 29.26 | +31 18 35.5 | 5.1 | 1 | yes | 0.2 | 14.9 | 331 | 11.01 | 1.01 | 0.43 | ||||||
| 103 | 032929.8+312102 | 03 29 29.83 | +31 21 03.0 | 5.3 | 53 | yes | 1.0 | 15.1 | 333 | 11.24 | 0.87 | 0.38 | ||||||
| 104 | 032930.6+312729 | 03 29 30.70 | +31 27 29.4 | 9.6 | yes | 16.4 | 335 | 12.60 | 0.65 | 0.35 | ||||||||
| 105 | 032931.6+312125 | 03 29 31.70 | +31 21 25.2 | 5.8 | ||||||||||||||
| 106 | 032932.9+312712 | 03 29 32.92 | +31 27 12.6 | 9.6 | yes | 1.1 | 15.2 | 344 | 12.22 | 0.56 | 0.40 | |||||||
| 107 | 032934.3+311743 | 03 29 34.30 | +31 17 44.0 | 6.4 | 20 | 51 | yes | 0.4 | 14.1 | 347 | 10.99 | 0.65 | 0.20 | |||||
| 108 | 032945.4+312351 | 03 29 45.43 | +31 23 51.1 | 9.6 | 22.7 | |||||||||||||
| 109 | 032946.1+312037 | 03 29 46.11 | +31 20 37.8 | 8.7 | yes | |||||||||||||
Notes to Table 1:
##6, 11, 18, 20, 21, 22, 23, 38, 41, 50, 56, 78 ISOCAM
(m)
##25, 27, 28, 34, 35, 57, 59, 71, 88, 102, 103 ISOCAM (m, m)
#5 ISOCAM (m); VSS 32 (Vrba, Strom, & Strom, 1976)
#9 ISOCAM (m, m);
HBC 340 (Herbig & Bell, 1988); IRAS 03256+3107
#10 ISOCAM (m, m); HBC
341 (Herbig & Bell, 1988)
#14 ISOCAM
(m, m); VSS 24 (Vrba, Strom, & Strom, 1976); LkH 351
(Herbig, 1956); SVS 21 (Strom, Vrba, & Strom, 1976)
#16 ISOCAM (m, m); SVS 17
(Strom, Vrba, & Strom, 1976)
#19 ISOCAM (m,
m); LkH 352A (Herbig, 1956); SVS 10
(Strom, Vrba, & Strom, 1976)
#30 ISOCAM
(m, m); HBC 344 (Herbig & Bell, 1988); SVS 11
(Strom, Vrba, & Strom, 1976); M1 star (SIMBAD)
#32 ISOCAM
(m, m); SVS 15 (Strom, Vrba, & Strom, 1976); VLA 8
(Rodríguez, Anglada, & Curiel, 1999)
#33 ISOCAM (m,
m, m); BD +30∘547; SVS 19
(Strom, Vrba, & Strom, 1976); VSS 10 (Vrba, Strom, & Strom, 1976); VLA 9 (Rodríguez, Anglada, & Curiel, 1999);
K0 star (SIMBAD)
#36 ISOCAM (m,
m); HBC 345 (Herbig & Bell, 1988)
#39 ISOCAM
(m, m, m); SVS 16 (Strom, Vrba, & Strom, 1976)
#43 ISOCAM? (m); VLA 13
(Rodríguez, Anglada, & Curiel, 1999)
#49 ISOCAM? (m); MMS
5 (Chini et al., 2001); VLA 16 (Rodríguez, Anglada, & Curiel, 1999)
#52 ISOCAM (m); SVS 8 (Strom, Vrba, & Strom, 1976)
#58 ISOCAM (m, m); SVS 14
(Strom, Vrba, & Strom, 1976); VLA 22 (Rodríguez, Anglada, & Curiel, 1999)
#64 IRAS 03260+3111 ; SiO maser (Harju et al., 1998);
SVS 3 (Strom, Vrba, & Strom, 1976); VLA 44 (Rodríguez, Anglada, & Curiel, 1999); B6 star
(SIMBAD)
#79 VSS 4 (Vrba, Strom, & Strom, 1976); LkH
270 (Herbig, 1956); SVS 2 (Strom, Vrba, & Strom, 1976); K2 star (SIMBAD)
#81 ISOCAM (m)
#83 BD
+30∘549; IRAS 9 (Jennings et al., 1987); SVS 1 (Strom, Vrba, & Strom, 1976);
VSS 3 (Vrba, Strom, & Strom, 1976); B9 star (SIMBAD)
#86 ISOCAM
(m, m); IRAS 03262+3108; HH 17; HH 17A; SVS 5
(Strom, Vrba, & Strom, 1976)
#90 VSS 27 (Vrba, Strom, & Strom, 1976);
LkH 271 (Herbig, 1956); SVS 20 (Strom, Vrba, & Strom, 1976); HBC 13
(Herbig & Bell, 1988); G star (SIMBAD)
#92 ISOCAM
(m, m); LkH 355 (Herbig, 1956)
#98 VSS 2 (Vrba, Strom, & Strom, 1976)
#100 VSS
1 (Vrba, Strom, & Strom, 1976); SVS 6 (Strom, Vrba, & Strom, 1976)
#107 VSS
30 (Vrba, Strom, & Strom, 1976)
| X-ray extraction | Variability | Spectrum | Luminosity | Notes | |||||||||||||
|---|---|---|---|---|---|---|---|---|---|---|---|---|---|---|---|---|---|
| Src | CXONGC1333 J | Var Cl | log | log | log | log | log | ||||||||||
| (counts) | (″) | (ct ks-1) | (cm-2) | (keV) | (erg s-1) | ||||||||||||
| 1 | 032829.4+312508 | 20 | 4 | 17.6 | 0.88 | 0.5 | Const | 22.0 (21.2-22.5) | 3.0 (1.5-16.6) | 28.9 | a | ||||||
| 2 | 032831.9+312121 | 14 | 2 | 11.3 | 0.87 | 0.4 | Const | 22.8 | 29.1 | a,b | |||||||
| 3 | 032835.0+312112 | 13 | 3 | 9.5 | 0.86 | 0.3 | Const | 22.9 (22.3-23.4) | 2.1 | 28.9 | a | ||||||
| 4 | 032836.4+311929 | 32 | 1 | 8.6 | 0.89 | 0.9 | Const | 21.4 (20.9-21.8) | 0.6 (0.3-0.7) | 28.7 | 28.8 | 29.1 | |||||
| 5 | 032836.8+312312 | 260 | 7 | 12.4 | 0.94 | 7.1 | Const | 21.5 (21.4-21.7) | 1.5 (1.4-1.6) | c | |||||||
| 6 | 032836.8+311735 | 272 | 2 | 10.9 | 0.93 | 7.7 | Flare | 21.6 (21.5-21.7) | 2.1 (1.8-2.4) | 29.4 | 29.5 | 29.8 | 30.0 | ||||
| 7 | 032837.1+311954 | 11 | 1 | 6.1 | 0.74 | 0.4 | Const | 20.8 | 28.6 | a,b | |||||||
| 8 | 032837.8+312525 | 16 | 4 | 13.6 | 0.88 | 0.4 | Const | 22.9 | 29.1 | a,b | |||||||
| 9 | 032843.2+311733 | 88 | 2 | 6.1 | 0.87 | 2.6 | Const | 22.5 (22.4-22.6) | 2.3 (2.0-2.8) | 28.6 | 29.6 | 29.7 | 30.2 | ||||
| 10 | 032843.5+311737 | 193 | 6 | 6.6 | 0.91 | 5.4 | Const | 21.5 (21.5-21.7) | 1.5 (1.4-1.6) | 29.3 | 29.2 | 29.5 | 29.7 | ||||
| 11 | 032844.0+312052 | 8 | 2 | 5.6 | 0.90 | 0.2 | Const | d | |||||||||
| 12 | 032845.4+312050 | 13 | 1 | 5.2 | 0.87 | 0.4 | Const | 22.3 | 29.1 | a,b | |||||||
| 13 | 032845.4+312227 | 8 | 1 | 6.2 | 0.90 | 0.2 | Const | d | |||||||||
| 14 | 032846.1+311639 | 212 | 1 | 7.7 | 0.95 | 5.9 | Const | 21.0 (20.6-21.3) | 1.3 (1.2-1.4) | 29.3 | 28.9 | 29.5 | 29.6 | ||||
| 15 | 032847.6+312405 | 48 | 4 | 9.2 | 0.94 | 1.2 | Flare | 21.9 (21.7-22.0) | 3.5 (2.2-12.4) | 28.6 | 29.1 | 29.2 | 29.4 | ||||
| 16 | 032847.8+311655 | 28 | 1 | 5.4 | 0.90 | 0.8 | Const | 21.1 (20.0-21.5) | 28.5 | 28.9 | 29.0 | 29.1 | a,b | ||||
| 17 | 032850.3+312755 | 29 | 7 | 15.5 | 0.77 | 0.8 | Const | 22.0 (21.6-22.4) | 28.2 | 29.1 | 29.2 | 29.3 | a,b | ||||
| 18 | 032850.8+312349 | 12 | 2 | 6.3 | 0.89 | 0.3 | Const | 22.0 | 1.5 | 28.4 | a | ||||||
| 19 | 032850.9+311818 | 66 | 1 | 4.9 | 0.95 | 1.8 | Pos fl | 21.2 (20.8-21.5) | 3.2 (2.2-5.3) | 28.8 | 29.0 | 29.2 | 29.3 | ||||
| 20 | 032850.9+311632 | 11 | 1 | 8.0 | 0.96 | 0.3 | Const | 20.9 | 1.5 | 28.3 | a | ||||||
| 21 | 032851.1+311955 | 521 | 3 | 4.8 | 0.95 | 14.4 | Flare | 21.5 (21.5-21.6) | 2.3 (2.1-2.5) | 29.7 | 29.8 | 30.1 | 30.2 | ||||
| 22 | 032852.0+311548 | 7 | 1 | 5.6 | 0.88 | 0.2 | Const | d | |||||||||
| 23 | 032852.1+312245 | 157 | 2 | 5.9 | 0.95 | 4.3 | Flare | 21.3 (21.0-21.4) | 2.0 (1.7-2.5) | 29.2 | 29.1 | 29.5 | 29.6 | ||||
| 24 | 032853.5+311537 | 5 | 1 | 3.2 | 0.69 | 0.2 | Const | d | |||||||||
| 25 | 032853.9+311809 | 35 | 1 | 3.0 | 0.90 | 1.0 | Const | 21.9 (21.6-22.1) | 1.7 (1.4-2.4) | 28.6 | 28.7 | 29.0 | 29.3 | ||||
| 26 | 032854.0+311654 | 7 | 1 | 4.0 | 0.92 | 0.2 | Const | d | |||||||||
| 27 | 032854.6+311651 | 143 | 1 | 5.3 | 0.95 | 4.0 | Const | 21.8 (21.7-21.9) | 2.3 (1.8-2.8) | 29.1 | 29.3 | 29.5 | 29.8 | ||||
| 28 | 032855.0+311629 | 32 | 1 | 4.0 | 0.89 | 0.9 | Const | 22.3 (22.1-22.4) | 0.9 (0.6-1.3) | 28.5 | 28.6 | 28.8 | 29.8 | ||||
| 29 | 032856.5+312240 | 6 | 2 | 3.9 | 0.87 | 0.1 | Const | d | |||||||||
| 30 | 032856.6+311836 | 56 | 2 | 3.8 | 0.94 | 1.5 | Pos fl | 21.5 (21.1-21.8) | 7.0 (3.3-55.2) | 28.6 | 29.1 | 29.2 | 29.3 | ||||
| 31 | 032856.8+311811 | 5 | 1 | 2.8 | 0.88 | 0.1 | Const | d | |||||||||
| 32 | 032856.9+311622 | 29 | 1 | 4.0 | 0.91 | 0.8 | Const | 21.8 (21.4-22.1) | 0.8 (0.2-11.2) | 28.4 | 28.5 | 28.8 | 28.8 | a | |||
| 33 | 032857.1+311419 | 2896 | 13 | 15.0 | 0.99 | 77.0 | Pos fl | 20.8 | 1.2 | 30.1 | 29.5 | 30.2 | 30.3 | c | |||
| 34 | 032857.4+311950 | 34 | 1 | 2.5 | 0.92 | 0.9 | Const | 21.7 (21.4-22.0) | 1.1 (0.8-1.5) | 28.8 | 28.5 | 29.0 | 29.3 | ||||
| 35 | 032857.6+311948 | 243 | 3 | 3.8 | 0.95 | 6.7 | Flare | 21.6 (21.5-21.7) | 3.6 (2.7-4.2) | 29.7 | 30.0 | 30.2 | 30.3 | ||||
| 36 | 032858.0+311804 | 49 | 1 | 3.8 | 0.95 | 1.3 | Const | 21.5 (21.1-22.1) | 1.3 (0.5-4.0) | 28.8 | 28.3 | 28.9 | 29.5 | ||||
| 37 | 032858.2+312541 | 7 | 1 | 8.4 | 0.88 | 0.2 | Const | d | |||||||||
| 38 | 032858.4+312218 | 7 | 1 | 3.2 | 0.86 | 0.2 | Const | d | |||||||||
| 39 | 032859.2+311548 | 515 | 7 | 5.5 | 0.94 | 14.3 | Flare | 22.1 (22.1-22.2) | 2.8 (2.4-3.4) | 29.5 | 30.2 | 30.3 | 30.6 | ||||
| 40 | 032859.3+312640 | 16 | 1 | 10.4 | 0.87 | 0.5 | Const | 22.3 (22.0-22.6) | 29.2 | 29.2 | 29.4 | a,b | |||||
| 41 | 032859.5+312146 | 14 | 1 | 2.8 | 0.88 | 0.4 | Const | 22.1 | 2.7 | 28.7 | 29.1 | a | |||||
| 42 | 032900.1+312109 | 5 | 1 | 2.5 | 0.90 | 0.1 | Const | d | |||||||||
| 43 | 032900.2+311338 | 267 | 1 | 9.8 | 0.94 | 7.5 | Const | 21.6 (21.5-21.7) | 1.5 (1.3-1.7) | 29.4 | 29.3 | 29.6 | 29.9 | ||||
| 44 | 032900.3+312045 | 11 | 1 | 2.5 | 0.93 | 0.3 | Const | 21.1 | 1.2 | 28.3 | a | ||||||
| 45 | 032900.6+312201 | 39 | 1 | 2.8 | 0.89 | 1.1 | Pos fl | 22.2 (21.9-22.3) | 1.3 (0.9-2.0) | 28.6 | 28.8 | 29.0 | 29.6 | ||||
| 46 | 032901.3+311413 | 7 | 1 | 6.6 | 0.86 | 0.2 | Const | d | |||||||||
| 47 | 032902.1+311611 | 20 | 1 | 3.7 | 0.91 | 0.6 | Const | 21.7 (21.1-22.1) | 0.3 (0.1-1.2) | 28.4 | a | ||||||
| 48 | 032902.8+311601 | 85 | 2 | 5.2 | 0.96 | 2.3 | Const | 1.0 (0.9-1.1) | 29.0 | 28.2 | 29.0 | 29.0 | |||||
| 49 | 032903.0+311516 | 16 | 1 | 4.7 | 0.87 | 0.5 | Const | 22.9 (22.5-23.3) | 1.9 (0.7-4.9) | 29.1 | 29.1 | 29.9 | a | ||||
| 50 | 032903.1+312238 | 9 | 1 | 3.2 | 0.88 | 0.2 | Const | 22.8 | 0.5 | 28.5 | 30.9 | a | |||||
| 51 | 032903.4+311618 | 34 | 1 | 3.5 | 0.88 | 1.0 | Flare | 22.4 (22.2-22.6) | 2.1 (1.4-4.3) | 28.2 | 29.1 | 29.2 | 29.7 | ||||
| 52 | 032903.8+312149 | 478 | 3 | 3.8 | 0.94 | 13.4 | Flare | 21.8 (21.7-21.9) | 2.3 (2.1-2.8) | 29.6 | 30.0 | 30.1 | 30.3 | ||||
| 53 | 032904.0+311708 | 19 | 1 | 2.8 | 0.91 | 0.5 | Const | 20.9 (20.0-21.8) | 0.9 (0.5-1.3) | 28.4 | a | ||||||
| 54 | 032904.1+312515 | 34 | 1 | 6.9 | 0.87 | 1.0 | Const | 22.2 (22.0-22.4) | 0.7 (0.4-1.1) | 28.6 | 28.5 | 28.8 | 29.9 | ||||
| 55 | 032904.3+312624 | 6 | 1 | 9.4 | 0.86 | 0.2 | Const | d | |||||||||
| 56 | 032904.7+311133 | 30 | 4 | 12.9 | 0.87 | 0.8 | Pos fl | 22.5 (22.3-22.8) | 1.6 (0.9-6.7) | 28.1 | 29.0 | 29.1 | 29.8 | ||||
| 57 | 032904.9+312038 | 7 | 1 | 2.2 | 0.89 | 0.2 | Const | d | |||||||||
| 58 | 032905.7+311640 | 71 | 2 | 2.6 | 0.91 | 2.0 | Const | 22.1 (21.9-22.3) | 3.1 (2.1-7.1) | 28.6 | 29.2 | 29.3 | 29.6 | ||||
| 59 | 032905.9+311640 | 71 | 1 | 2.0 | 0.88 | 2.1 | Pos fl | 22.2 (22.1-22.3) | 2.2 (1.3-3.1) | 28.7 | 29.3 | 29.4 | 29.8 | ||||
| 60 | 032906.6+311933 | 15 | 1 | 1.8 | 0.84 | 0.4 | Const | 22.7 | 2.4 | 29.0 | a | ||||||
| 61 | 032907.9+312252 | 24 | 1 | 3.4 | 0.88 | 0.7 | Const | 22.5 (22.3-22.8) | 0.9 (0.5-1.5) | 28.5 | 28.9 | 29.1 | 30.3 | a | |||
| 62 | 032908.7+311314 | 11 | 3 | 8.7 | 0.86 | 0.2 | Const | 22.4 | 29.1 | a,b | |||||||
| 63 | 032909.1+312306 | 8 | 1 | 3.7 | 0.89 | 0.2 | Const | d | |||||||||
| 64 | 032910.3+312159 | 1161 | 9 | 4.7 | 0.95 | 32.1 | Const | 22.1 (22.1-22.2) | 1.5 (1.2-1.6) | 29.9 | 30.3 | 30.4 | 30.9 | ||||
| 65 | 032910.5+312202 | 153 | 3 | 2.7 | 0.87 | 4.6 | Pos fl | 22.0 (21.9-22.2) | 2.8 (2.1-3.8) | 29.0 | 29.6 | 29.7 | 30.0 | ||||
| 66 | 032910.7+312230 | 25 | 1 | 3.1 | 0.90 | 0.7 | Const | 21.6 (21.3-21.8) | 1.5 (0.4-2.0) | 28.5 | 28.3 | 28.7 | 28.9 | a | |||
| 67 | 032911.2+311718 | 139 | 1 | 4.0 | 0.95 | 3.8 | Flare | 3.0 (2.4-3.9) | 29.1 | 29.1 | 29.4 | 29.4 | b | ||||
| 68 | 032911.8+312216 | 5 | 1 | 3.0 | 0.85 | 0.1 | Const | d | |||||||||
| 69 | 032911.8+312127 | 9 | 1 | 2.6 | 0.87 | 0.2 | Const | d | |||||||||
| 70 | 032912.8+312008 | 7 | 1 | 2.3 | 0.92 | 0.2 | Const | d | |||||||||
| 71 | 032912.9+311815 | 150 | 1 | 3.8 | 0.93 | 4.2 | Pos fl | 22.6 (22.5-22.7) | 3.3 (2.3-6.0) | 28.5 | 29.9 | 30.0 | 30.4 | ||||
| 72 | 032913.1+312253 | 20 | 1 | 3.8 | 0.89 | 0.6 | Pos fl | 22.2 (21.9-22.4) | 1.9 (1.2-3.5) | 28.2 | 28.7 | 28.9 | 29.3 | a | |||
| 73 | 032913.4+312441 | 16 | 5 | 6.3 | 0.88 | 0.3 | Const | 23.5 | 0.9 | 29.0 | a | ||||||
| 74 | 032914.0+312214 | 14 | 1 | 3.2 | 0.87 | 0.4 | Const | 22.1 | 28.9 | a,b | |||||||
| 75 | 032914.4+312236 | 28 | 1 | 3.6 | 0.90 | 0.8 | Flare | 21.9 (21.5-22.29) | 1.3 (0.6-2.5) | 28.4 | 28.4 | 28.7 | 29.1 | a | |||
| 76 | 032915.6+311852 | 16 | 1 | 2.6 | 0.87 | 0.5 | Const | 23.3 | 2.8 | 29.2 | a | ||||||
| 77 | 032916.5+312348 | 117 | 1 | 6.8 | 0.94 | 3.3 | Pos fl | 21.9 (21.7-22.0) | 3.4 (2.2-5.2) | 28.9 | 29.5 | 29.6 | 29.8 | ||||
| 78 | 032916.6+311618 | 168 | 3 | 5.5 | 0.96 | 4.5 | Flare | 1.2 (0.9-1.5) | 29.2 | 28.6 | 29.3 | 29.3 | b | ||||
| 79 | 032917.6+312245 | 1707 | 19 | 14.0 | 0.99 | 45.1 | Flare | 21.5 (21.5-21.5) | 2.2 (2.2-2.6) | 30.2 | 30.4 | 30.6 | 30.7 | ||||
| 80 | 032918.5+311926 | 25 | 1 | 2.8 | 0.87 | 0.7 | Const | 22.6 (22.4-22.9) | 1.8 (0.9-6.4) | 29.1 | 29.1 | 29.8 | a | ||||
| 81 | 032918.7+312326 | 234 | 1 | 6.6 | 0.95 | 6.5 | Const | 21.4 (21.2-21.6) | 1.0 (0.9-1.1) | 29.4 | 28.8 | 29.5 | 29.7 | ||||
| 82 | 032919.0+312106 | 19 | 1 | 3.2 | 0.88 | 0.5 | Const | 21.9 (21.4-22.2) | 29.0 | a,b | |||||||
| 83 | 032919.7+312458 | 39 | 2 | 8.0 | 0.91 | 1.1 | Const | 21.2 (20.9-21.7) | 1.6 (1.1-2.2) | 28.6 | 28.3 | 28.8 | 28.9 | ||||
| 84 | 032920.0+312408 | 30 | 2 | 6.4 | 0.88 | 0.8 | Pos fl | 22.4 (22.1-22.6) | 28.0 | 29.3 | 29.3 | 29.5 | a,b | ||||
| 85 | 032920.1+311450 | 8 | 1 | 6.9 | 0.88 | 0.2 | Const | d | |||||||||
| 86 | 032920.4+311834 | 16 | 1 | 3.3 | 0.88 | 0.5 | Const | 22.7 (22.6-22.9) | 1.5 (1.0-2.1) | 28.9 | 29.9 | a | |||||
| 87 | 032921.1+311617 | 10 | 1 | 5.3 | 0.88 | 0.3 | Const | 22.9 | 29.0 | a,b | |||||||
| 88 | 032921.5+312111 | 69 | 1 | 5.2 | 0.95 | 1.9 | Const | 21.4 (21.1-21.7) | 1.2 (0.9-1.4) | 28.9 | 28.4 | 29.0 | 29.2 | ||||
| 89 | 032921.6+312515 | 11 | 2 | 9.0 | 0.90 | 0.3 | Const | 21.8 | 0.5 | 28.1 | a | ||||||
| 90 | 032921.8+311537 | 23 | 1 | 6.2 | 0.89 | 0.7 | Const | 22.3 (22.2-22.5) | 5.4 (2.4-15.3) | 28.1 | 29.2 | 29.2 | 29.5 | a | |||
| 91 | 032922.0+312415 | 85 | 5 | 8.6 | 0.95 | 2.2 | Const | 21.1 (20.1-21.5) | 1.3 (1.1-1.6) | 29.0 | 28.5 | 29.1 | 29.2 | ||||
| 92 | 032923.2+312030 | 6 | 1 | 4.0 | 0.90 | 0.1 | Const | d | |||||||||
| 93 | 032923.5+312331 | 643 | 5 | 8.2 | 0.95 | 17.8 | Flare | 21.7 (21.6-21.7) | 2.6 (2.3-2.9) | 29.8 | 30.0 | 30.2 | 30.4 | ||||
| 94 | 032923.7+312510 | 14 | 2 | 9.2 | 0.89 | 0.4 | Const | 2.7 | 28.5 | a,b | |||||||
| 95 | 032924.1+312109 | 11 | 1 | 4.4 | 0.88 | 0.3 | Const | 22.7 | 2.9 | 28.9 | a | ||||||
| 96 | 032924.8+312052 | 6 | 1 | 4.5 | 0.87 | 0.2 | Const | d | |||||||||
| 97 | 032924.8+312407 | 12 | 1 | 7.8 | 0.91 | 0.3 | Const | 21.8 | 28.3 | a | |||||||
| 98 | 032925.8+312640 | 231 | 10 | 13.8 | 0.91 | 6.4 | Flare | 21.8 (21.7-21.9) | 1.7 (1.2-2.1) | 29.5 | 29.7 | 29.9 | 30.2 | ||||
| 99 | 032925.8+311347 | 14 | 4 | 10.5 | 0.88 | 0.3 | Const | 22.1 | 4.0 | 28.7 | a | ||||||
| 100 | 032926.7+312648 | 1055 | 16 | 16.0 | 0.95 | 28.9 | Const | 21.4 (21.3-21.5) | 1.5 (1.5-1.5) | 30.1 | 29.9 | 30.3 | 30.5 | ||||
| 101 | 032928.1+311628 | 153 | 5 | 8.5 | 0.95 | 4.1 | Pos fl | 1.3 (1.2-1.5) | 29.2 | 28.7 | 29.3 | 29.3 | b | ||||
| 102 | 032929.2+311835 | 142 | 2 | 7.5 | 0.95 | 3.9 | Const | 21.6 (21.5-21.8) | 1.4 (1.1-1.5) | 29.2 | 29.0 | 29.4 | 29.7 | ||||
| 103 | 032929.8+312102 | 29 | 1 | 6.2 | 0.90 | 0.8 | Const | 2.8 (1.8-5.1) | 28.5 | 28.5 | 28.8 | 28.8 | a | ||||
| 104 | 032930.6+312729 | 13 | 5 | 17.2 | 0.90 | 0.2 | Const | 21.4 | 0.5 | 28.2 | a | ||||||
| 105 | 032931.6+312125 | 16 | 4 | 7.2 | 0.87 | 0.4 | Const | 21.7 | 28.8 | a,b | |||||||
| 106 | 032932.9+312712 | 30 | 6 | 20.1 | 0.95 | 0.7 | Const | 21.5 (21.0-21.9) | 0.8 (0.4-1.1) | 28.5 | 28.6 | 28.9 | a | ||||
| 107 | 032934.3+311743 | 157 | 3 | 10.3 | 0.96 | 4.2 | Const | 21.6 (21.4-22.0) | 0.6 (0.2-0.6) | 29.3 | 28.2 | 29.3 | 29.8 | ||||
| 108 | 032945.4+312351 | 23 | 11 | 10.0 | 0.42 | 0.8 | Const | 22.9 | 29.4 | 29.4 | 29.8 | a,b | |||||
| 109 | 032946.1+312037 | 36 | 9 | 14.6 | 0.81 | 0.9 | Const | 1.4 (1.1-1.6) | 28.8 | 28.3 | 28.9 | 28.9 | b | ||||
| LAL | K | ||
|---|---|---|---|
| # | (counts) | (′) | (mag) |
| 34 | 6 | 8.0 | 14.20 |
| 48 | 6 | 6.9 | 13.57 |
| 50 | 3 | 7.1 | 11.91 |
| 95 | 6 | 9.2 | 12.68 |
| 99 | 5 | 3.9 | 14.58 |
| 137 | 4 | 2.8 | 13.23 |
| 147 | 3 | 3.6 | 11.80 |
| 164 | 3 | 3.1 | 13.38 |
| 165 | 5 | 3.8 | 13.79 |
| 202 | 5 | 0.9 | 13.74 |
| 206 | 3 | 2.0 | 13.46 |
| 208 | 6 | 5.9 | 12.76 |
| 224 | 4 | 2.2 | 12.32 |
| 256 | 4 | 5.0 | 11.96 |
| 265 | 3 | 2.5 | 13.12 |
| 314 | 4 | 9.6 | 12.82 |
| 336 | 4 | 5.3 | 11.09 |
| (a) | 6 | 4.0 | 10.00 |