1]Institut für Experimentelle Kernphysik, University of Karlsruhe, 76021 Karlsruhe, Germany 2]Institut für Kernphysik, Forschungszentrum Karlsruhe, 76021 Karlsruhe, Germany 3]National Institute of Physics and Nuclear Engineering, 7690 Bucharest, Romania 4]Cosmic Ray Division, Yerevan Physics Institute, Yerevan 36, Armenia 5]Department of Experimental Physics, University of Lodz, 90236 Lodz, Poland 6]Soltan Institute for Nuclear Studies, 90950 Lodz, Poland ]now at: University of Leeds, Leeds LS2 9JT, U.K. ]on leave of absence from IFIN-HH, Bucharest +]now at: Warsaw University of Technology, 09-400 Plock, Poland
K.-H. Kampert (kampert@ik.fzk.de)
110mm
The Physics of the Knee in the Cosmic Ray Spectrum
Abstract
Recent results from the KASCADE extensive air shower experiment
are presented. After briefly reviewing the status of the
experiment we report on tests of hadronic interaction models
and emphasize the progress being made in understanding
the properties and origin of the knee at eV.
Analysing the muon- and hadron trigger rates in the KASCADE
calorimeter as well as the global properties of high energy hadrons
in the shower core leads us to conclude that
QGSJET still provides the best overall description of EAS data,
being superior to DPMJET II-5 and neXus 2, for example.
Performing high statistics CORSIKA simulations and applying
sophisticated unfolding techniques to the electron and muon
shower size distributions, we are able to successfully
deconvolute the all-particle energy spectrum into energy spectra
of 4 individual primary mass groups (p, He, C, Fe). Each of
these preliminary energy distributions exhibits a knee like
structure with a change of their knee positions suggesting a
constant rigidity of -3 PV.
1 Introduction
The origin and acceleration mechanism of ultra-high energy cosmic rays ( eV) have been subject to debate for several decades. Mainly for reasons of the power required to maintain the observed cosmic ray energy density of eV/cm3, the dominant acceleration sites are generally believed to be supernova remnants (SNR). Charged particles mainly originating from the surrounding interstellar medium of the pre-supernova star may get trapped at the highly supersonic shock wave generated by the SN explosion. Repeatedly reflections on both sides of the shock front lead to an acceleration by the so-called ‘first order Fermi mechanism’. Naturally, this leads to a power law spectrum as is observed experimentally. Simple dimensional estimates show that this process is limited to , with being the atomic number of the cosmic ray (CR) isotope and , the size and magnetic field strength of the acceleration region. A more detailed examination of the astrophysical parameters suggests an upper limit of acceleration of eV (Drury, 1994; Berezhko and Ksenofontov, 1999). Curiously, the CR spectrum steepens from to at eV which is called the ‘knee’. The coincidence thus may indicate that the ‘knee’ is related to the upper limit of acceleration.
Alternative interpretations of the knee discuss a change in the propagation of CRs from their sources to the solar system. Such kind of propagation effects are conveniently described by an ‘escape time’ from our galaxy, . Extrapolation of from direct measurements in the GeV range to higher energies breaks down at eV, because pc which is the thickness of the galactic disk (Gaisser, 2000). The value corresponds to just one crossing of the disk and would give rise to significant anisotropies with respect to the galactic plane when approaching this value. Similarly as to the process of acceleration at SNR shocks, the process of galactic containment is closely related to magnetic field confinement, i.e. in addition to anisotropies one again expects .
A picture related to both of these interpretations has been proposed by Erlykin and Wolfendale (1997). They consider the knee as a superposition of a weakly energy dependent galactic modulation with additional prominent structures in the flux spectrum caused by a single near-by object. This so-called ’single source model’ assumes that a shock wave of a recent nearby supernova which exploded some 10,000 years ago at a distance of a few hundred parsecs, currently propagates (or has recently propagated) through the solar system causing distinct peaks of elemental groups in the energy spectrum. The most recent update of this model can be found in the proceedings to this conference (p1804). However, there is some controversy whether or not the statistics of presently existing data gives sufficient support to the model.
Besides those kind of astrophysical interpretations, also particle physics motivated pictures of explaining the knee were put forward. For example, Wigmans (2000) suggested the inverse -decay reaction with massive relic neutrinos could destroy protons. Simple kinematics shows that this channel is open for . Thus, a knee energy PeV would correspond to an electron neutrino mass of 0.4 eV, a value presently not excluded by any other observation or experiment. However, ‘eating’ sufficiently large amounts of protons by such a process requires extraordinary high local densities of relic neutrinos, which appears doubtful even if possible gravitational trapping is considered. In case of a non-zero magnetic dipole moment of massive neutrinos, also electromagnetic interactions with much larger cross section would be possible, thus giving rise to inelastic GZK-like -interactions. Such a picture requiring neutrinos masses of about 100 eV has recently been discussed by Dova, Epele, and Swain (2001).
Nikolsky (1995) suggested that the knee is not a property of the primary energy spectrum itself, but may be caused by changing high-energy interactions in the Earth’s atmosphere. Producing a new type of a heavy particle in the first interactions escaping unseen by air shower experiments, or an abrupt increase in the multiplicity of produced particles (see proceedings to this conference, p1389) could, in principle, mimic a break in the spectrum. From the particle physics point of view this is not completely ruled out as the centre-of-mass (cms) energy available at the knee is above Tevatron energies. However, a well worked out model simultaneously describing accelerator and CR data without violating general physics, like the unitarity principle, is still to be presented.
Very recently, exotic scenarios with extra dimensions and TeV-scale quantum gravity have been discussed by Kazanas and Nicolaidis (2001) and others. Again, the argument is that the cms-energy of the knee ( TeV) is just above the highest energies reached by present accelerators and that some part of the CR energies is transferred into invisible channels, in this case gravitational energy. Some advantage of this picture is that the required fast growth of cross section for graviton radiation does not necessarily violate S-wave unitarity.
A common feature of the particle physics interpretations of the knee is the expectation of seeing the break of different elements to be displaced by their mass number rather than by their nuclear charge . This is understood from the reaction mechanism being governed, at sufficiently high energy, by the energy per nucleon of the incident particle.
To distinguish between these various ideas, better measurements of the energy spectrum and elemental composition of cosmic rays in the knee region are essential. Most commonly, the composition is expressed in terms of the mean logarithmic mass, . Obviously, such an average quantity appears to be rather insensitive to details of the individual energy spectra. Clearly, the most sensitive testbed for comparing different models would be given by CR energy spectra of different elemental groups. Direct measurements could in principle provide such information. However, due to their very limited collection area and exposure time, direct measurements across the knee energy are practically impossible. On the other hand, the well known difficulties in the interpretation of EAS data have not yet permitted such measurements either. Thus, beyond the knee energy very little is known about CRs other than their all-particle energy spectrum (Watson, 1998).
The primary goal of the KASCADE experiment is to provide such information by measuring the electromagnetic, muonic, and hadronic EAS components with high precision in each individual event and by applying advanced methods of multi-parameter data analyses. Determining the energy spectrum and composition of cosmic rays in the knee region with high precision also calls for detailed EAS simulations, as performed by the CORSIKA package (Heck, 1998). Testing and improving hadronic interaction models entering the EAS simulations is another objective of KASCADE. As discussed below, this is realised mostly by investigating the properties of high energy hadrons in the shower core. Reconstructing properties of the primary CRs from different sets of EAS observables and comparing their results provides another powerful means to judge the reliability of measurements and simulations.
2 Experimental
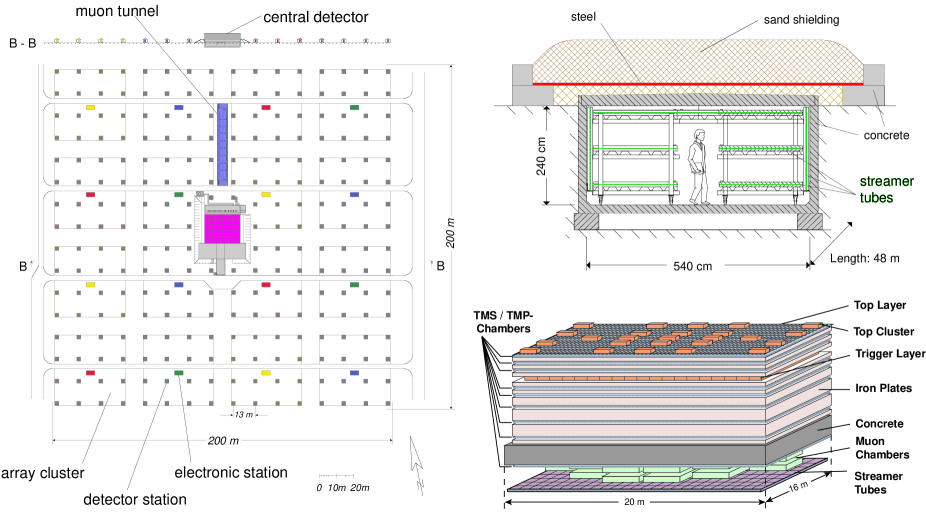
KASCADE (Karlsruhe Shower Core and Array Detector) is located at the laboratory site of Forschungszentrum Karlsruhe, Germany (at E, N, 110 m a.s.l.). In brief, it consists of three major components (see Fig. 1);
-
1.
A scintillator array comprising 252 detector stations of electron and muon counters arranged on a grid of m2 and providing in total about 500 m2 of - and 620 m2 of -detector coverage. The detection thresholds for vertical incidence are MeV and MeV.
-
2.
A central detector system (320 m2) consisting of a highly-segmented hadronic calorimeter read out by 44,000 channels of warm liquid ionization chambers distributed over 9 read-out layers, another set of scintillation counters above the shielding (top cluster), a trigger plane of scintillation counters in the third iron gap and, at the very bottom, 2 layers of positional sensitive MWPC’s, and a streamer tube layer with pad read-out for investigation of the muon component at GeV.
-
3.
A m2 tunnel housing three horizontal and a two vertical layers of positional sensitive limited streamer tubes for muon tracking at GeV.
More details about the experiment can be found in Doll et al. (1990) and in Klages et al. (1997). First correlated data have been taken with some parts of the experiment since 1996 and with its full set-up since 2000. At present, more than 500 Mio. events have been collected in a very stable mode and with a trigger threshold of the array corresponding to eV.
3 Tests of High-Energy Hadronic Interaction Models
The observation of EAS provides an opportunity to study global properties of hadronic interactions in an energy range not accessible to man-made accelerators. For example, the cms-energy at the Tevatron collider corresponds to a fixed target energy in the nucleon-nucleon system of eV. Even more importantly, the diffractive particle production dominating the energy flux in the forward region influences the EAS development most strongly, but has been studied experimentally only at comparatively low energies of GeV (Kaidalov, 1979). Most of the beam energy in present collider experiments remains unobserved. For example, the UA5 experiment could register up to 30 % of the total collision energy at TeV, while the CDF detector registers only about 5 % at TeV. Hence, hadronic interaction models applied to higher cms-energies and to particle production in the very forward region rely on extrapolations and may cause systematic uncertainties in simulations of EAS. Additional uncertainties arise from simulations of -nucleus and nucleus-nucleus collisions including a possible formation of a quark-gluon plasma. Again, such data are important for EAS interpretations but have been studied only at low energies in the past (SPS and ISR at CERN). Only very recently, RHIC data at GeV have become available and will be very helpful in this respect.
In KASCADE, hadronic interaction models have been tested by EAS data employing two basic approaches: At lower primary CR energies, where data from direct measurements still exist, the energy spectra and rate of single hadrons not accompanied by air showers were studied. At higher CR energies, on the other hand, various features of the hadronic shower cores were investigated. In both approaches, the sensitivity to details of the hadronic interaction models arises mostly from the high energy threshold applied to the hadron reconstruction in the calorimeter.

3.1 Tests at Low Primary Energies: Study of Trigger Rates
An important source of uncertainty in hadronic interaction models originates from the energy dependent inelastic cross-sections (Block, Halzen, Stanev, 2000). Taking into account the deviations among different experiments at Tevatron energies, the proton-antiproton cross section is not known to better than 5 % at best (Avila et al., 1999). As shown below, these uncertainties are amplified when predicting absolute hadron fluxes at sea-level by means of EAS simulations. Thus, one may take advantage of this strong dependence and perform stringent tests of models on the basis of EAS data. The idea is to use data of absolute CR fluxes up to several TeV of energy, as obtained from balloon- and satellite borne experiments at the top of the atmosphere. Taking into account the measured energy distribution and chemical composition, these particles are then propagated through the atmosphere employing the CORSIKA simulation package. At the level of the KASCADE experiment, we then ask for triggers released by either high energy hadrons ( GeV) or a minimum number of 9 muons ( GeV) detected in the central detector of KASCADE. Such an energy cut applied to the hadrons automatically selects particles originating from the first high-energy interactions in the atmosphere. Employing different hadronic interaction models, these simulated inclusive trigger rates are then compared to actual experimental data (Antoni et al., 2001). Figure 2 shows the results. None of the predictions agrees well with the experimental data, particularly the hadron rates are overestimated by up to a factor of 3. Furthermore, there are also large differences found among the models. This convincingly proves the sensitivity of the experimental observable to details of the interaction models.
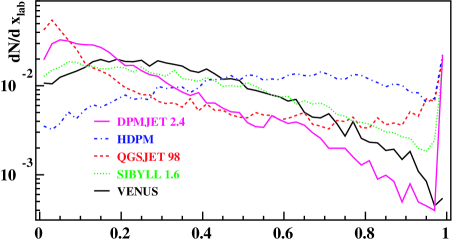
Earlier investigations of high-energy hadrons observed in the shower core (Antoni et al., 1999) lead us to the conclusion that QGSJET (Kalmykov and Ostapchenko, 1993) provides the best overall prescription of EAS data. This was independently concluded also from a consistency analysis including data from different EAS experiments (Erlykin and Wolfendale, 1998). Therefore, several modifications were applied to the QGSJET model in order to study their influence to the predicted trigger rates. Results are presented in the lower panel of Fig. 2. Increasing the inelastic proton-air cross section by 5 % (10 %) reduces the predicted hadron rate by approx. 27 % (54 %). Similar effects are obtained by lowering the diffraction dissociation by up to 10 % of the inelastic cross section. Clearly, there is a strong sensitivity to these parameters. Since the total inelastic cross section appears to be the better known quantity, we conclude that the uncertainty arises mostly from the diffraction dissociation which may be overestimated in the simulated hadron-nucleus interactions by about 5 % of the inelastic cross section . In fact, the trigger rates predicted by the different models shown in Fig. 2 (top) are strongly correlated to the simulated shapes of the Feynman- distributions of leading baryons. This is demonstrated in Fig. 3 for CORSIKA simulations of interactions at eV; for the same total cross section, a large fraction of diffractive interactions leads to high trigger rates and vice versa. In order to verify the aforementioned conclusions about the observed deviations of the trigger rates it would be highly desirable to measure the proton inelastic cross section on nitrogen and oxygen at the highest energies at accelerators and to study the kinematical region of diffraction dissociation.
3.2 Tests at High Primary Energies: Study of Hadrons in the Shower Core
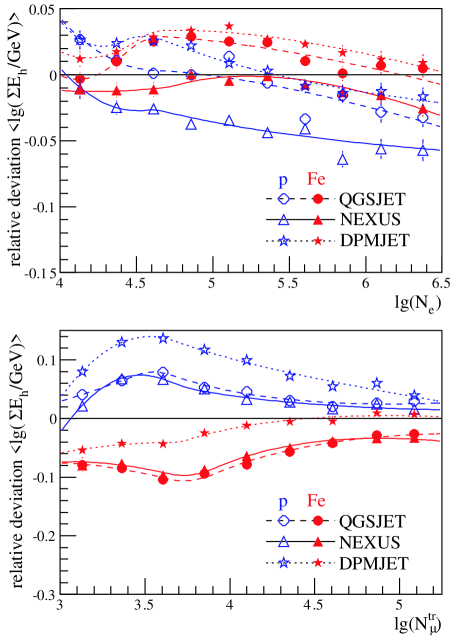
While the previous study selects mostly diffractive type interactions in the atmosphere, the following analysis samples the more ’typical’ nuclear interactions leading to a fully developed EAS. Events have to fulfil standard cuts in electron and muon number for EAS (, ) and need to have at least one hadron with GeV reconstructed in the calorimeter. Details of this type of analysis were presented by Milke et al. (2001) at this conference. An example employing only the three models which are closest to the data in Fig. 2 is depicted in Fig. 4. Here, the total hadronic energy observed in the calorimeter is compared with CORSIKA simulations for proton and iron primaries employing the QGSJET (Kalmykov and Ostapchenko, 1993), neXus 2 (Drescher et al., 2000), and DPMJET (version II-5) (Ranft, 1999) models. The upper panel shows the ratio for each of these models as a function of electron size. The lower panel shows the same quantity as function of the truncated muon size, defined as . Considering the steep primary energy distribution and the different EAS developments for light and heavy primaries, binning the data as a function of tends to enrich showers originating from light primaries. Therefore, proton simulations (open symbols in the upper panel of Figure 4) are expected to closely resemble the experimental data. QGSJET simulations follow this expectation best. With some exceptions at lower electron sizes, also DPMJET provides a reasonable description of the experimental data. However, neXus 2 clearly fails in this test: there is too little hadronic energy at given electron size. Since hadrons in an EAS continuously populate the electromagnetic component, this mismatch points to a general problem of the balance between electromagnetic and hadronic energy in the used version of neXus. However, it should be mentioned that this version of neXus is still considered preliminary and will be subject of further improvements. The observed overall decrease of simulated/experimental hadronic energies may be due to an increasingly heavier composition in the experimental data at higher energies (see next section).
The truncated muon number provides an energy estimator which is almost independent from primary mass. Thus, repeating the analysis and plotting the same quantities now as a function of truncated muon size should yield results with the proton and iron simulations being reasonably above and below the experimental data. Again, QGSJET exhibits the expected behaviour (lower panel of Fig. 4). Different from above, now the neXus model follows the QGSJET results very closely and DPMJET fails the test; DPMJET II-5 produces significantly too many hadrons so that a composition based on this model would appear too heavy. Such a composition contradicts measurements from other experiments as well as those from KASCADE (see below). At , i.e. energies corresponding to eV, a composition even heavier than iron would be needed to describe the experimental data. The combined results of Fig. 4 top and bottom thus suggest that EAS simulated with DPMJET II-5 penetrate too deeply into the atmosphere. The conclusion is confirmed also by studying the multiplicity and energy distribution of hadrons in the calorimeter (Milke et al., 2001).
4 Determination of the primary energy spectra and mass composition
Results presented in the previous section have demonstrated that QGSJET is still the model of choice when analysing EAS data in the knee region. Deviations between the Monte Carlo predictions and experimentally observed distributions of high energy hadrons ( GeV) have become reasonably small, however, efforts are still needed for further optimization of interaction models. As pointed out before, selecting high energy hadrons amplifies the sensitivity to the actual modelling of high energy hadronic interactions. Low energy electrons and muons, on the contrary, should be less affected as they result from an average of many interactions at mostly lower cms-energies. Thus, in the following we will concentrate on the reconstructed electron and truncated muon numbers.
4.1 Unfolding Techniques
*
It is well known that for given zenith angle, i.e. fixed atmospheric thickness, and depend simultaneously on the mass, , and energy, , of the primary particle. Besides their specific average relation also their fluctuations are known to change with energy and mass. Clearly, such effects are to be taken into account when reconstructing the properties of the primary particles, particularly in the presence of steeply falling energy spectra. Mathematically, the observed electron and muon shower size distributions at a given zenith angle bin can then be written as
where the sum runs over all primary masses . The quantity denotes the probability for a primary particle of mass and energy to be reconstructed as an air shower with electron- and muon size and , respectively. The equation thus represents a set of Fredholm integral equations of 1st kind. In practice, not all primary masses will be taken into account, but only a representative group of different primary particles, here protons, helium, carbon, and iron. Suitable methods to solve the inverse equation, i.e. to infer the physical quantities of interest, , from the experimentally observed distributions, are unfolding algorithms. Here, we have chosen the iterative scheme of the Gold-algorithm (Gold, 1964) which tries to minimize the functional and allows only non-negative solutions (Ulrich et al., 2001).
The kernel function needs to be determined from EAS and detector simulations and has to account for all kinds of physical and experimental effects, such as fluctuations of shower sizes, trigger and detection efficiencies or reconstruction accuracies. It has been determined from high statistics CORSIKA/QGSJET simulations generated with thinning option for 3 different bins of zenith angle (-, -, -), four primary masses and for a large number of fixed primary energies. The individual and distributions obtained for each primary energy and mass were then parametrized and the variation of the parameters with shower size, zenith angle, primary energy, and primary mass was used in the analysis. Details of this method are described in Ulrich et al. (2001) and by Ulrich (2002).
*
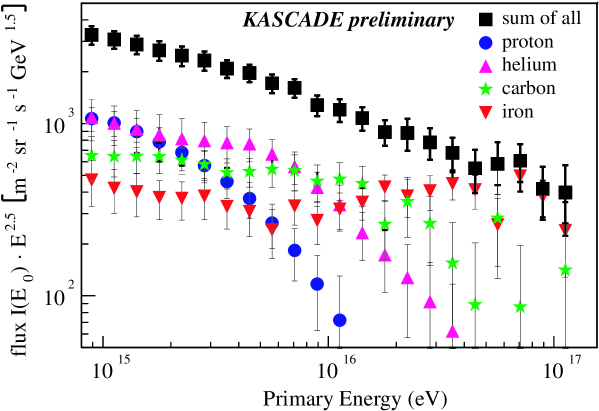
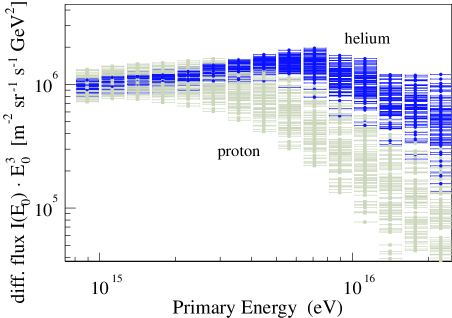
Results based on the experimental and shower distributions of all 3 zenith angle bins are presented in Fig. 5 for 4 primary mass groups. Each of the reconstructed energy distributions shows a knee like structure which is shifted towards higher energies with increasing mass. The knee in the all-particle spectrum at about 4 PeV appears to me mostly caused by the break of the light elements proton and helium. This is well in agreement to earlier analyses of KASCADE data (Glasstetter et al., 1999; Antoni et al., 2002).
It should be stressed that no assumption about spectral shapes or mass abundances is made in the analysis presented here, only the measured electron and muon shower size distributions at 3 zenith angles and the simulated response function are used. The error bars in Fig. 5 represent statistical errors only and are dominated by the limited statistics of the presently available CORSIKA simulations. Statistical errors of the experimental data correspond to about 20 months of data taking and are very small compared to that of the simulations.
In order to investigate the robustness of the reconstructed energy spectra, the unfolding algorithm has been repeated many times employing different sets of input parameters to the kernel function . These parameters describing the shapes of the simulated and distributions for fixed primary energies (see above) have been randomly distributed according to their individual fit uncertainties assuming Gaussian error shapes. The result of this study is shown in Fig. 6 for the reconstructed proton and helium energy spectra. The shoal of symbols, all obtained using the same experimental data, clearly demonstrates the presence of a knee at distinct energies in both of the reconstructed spectra. A closer inspection of the spectra below the knee energy exhibits a steeper proton spectrum as compared to helium and a smoother turnover into a power law behaviour above the knee. However, it should be kept in mind that the reconstructed proton spectrum is significantly affected by the large shower fluctuations limiting the experimental energy resolution. In fact, simulations have shown that even a sharp break would result in a smoothness similar to the observed one (Ulrich, 2002). The observed scattering of the reconstructed fluxes at a given energy has been used to estimate the statistical uncertainties of the unfolding procedure. Adding this in quadrature to the experimental statistical errors yields the values shown in figure 5. Clearly, improving the statistics of the Monte Carlo simulations in the near future will reduce this error.
The still preliminary energy spectra support the picture of a rigidity dependent scaling of the knee position. However, since for all shown mass groups with , the crucial test for distinguishing between a and scaling of the knee is given by the comparison of the proton and helium spectra. As can be seen from Fig. 6, the knee between and He is shifted by factor of favouring the rigidity picture. However, because of the different spectral shapes, such a comparison is not straightforward and further investigations are needed to verify that conclusion. Also, the sensitivity to the used hadronic interaction model needs to be studied. This may shift the overall energy scale and flux of the individual curves but is anticipated to have only minor influence to the relative positions of the observed knees.
4.2 Chemical Composition and Comparison to Neural Network Approaches
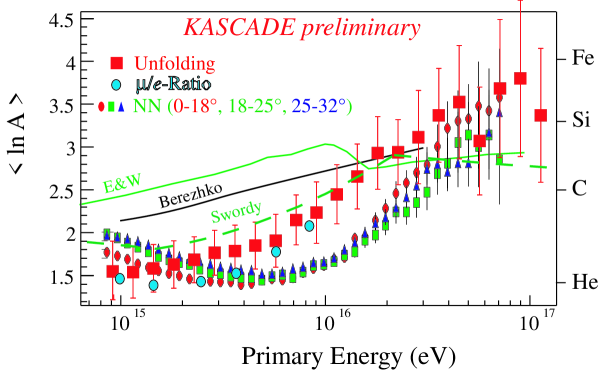
Individual energy spectra of the type shown above are ideally suited for comparisons with cosmic ray source- and acceleration models. However, up to now most EAS experiments have only been able to extract the all-particle energy spectrum and the mean logarithmic mass, . As a consequence, most theoretical papers present their results just in terms of these rather insensitive and inclusive variables. Thus, for completeness we plot in Fig. 7 the quantity as a function of the primary energy. As expected from the structure of the individual energy spectra, we find an increasingly heavier composition at energies above the knee. The data are compared to theoretical calculations by Erlykin and Wolfendale (1997), Berezhko and Ksenofontov (1999), and Swordy (1995). Also, other experimental results from KASCADE are included. Common to all models and data is an increasingly heavier mass at energies above the knee. Only the single source model of Erlykin and Wolfendale (1997) shows some structure at eV due to the assumed occurrence of an iron peak. As can be seen from that figure, the models differ significantly in their prediction of the mean mass and, except for the Swordy calculation, predict heavier masses than extracted from the experimental data.
In addition to the results from the unfolding procedure, we include earlier results from an analysis of the ratio (Weber et al., 1999) and from a neural network algorithm applied to the reconstructed electron and muon numbers at 3 different zenith angels (Roth et al., 2001). Within their errors, we find similar results from the unfolding procedure and from the ratios. However, the neural network approach yields a similar trend only at energies above the knee. In contrast to the other results, the composition shows a weak decrease in the mean logarithmic mass by about 0.5 units in the energy range from about 1 PeV to 4 PeV. Similar trends have been observed also by Cherenkov air shower measurements. (For a compilation of several data sets see Swordy et al. (2002)). At present, it cannot be said whether the effect is real or an artefact of the data analysis, such as due to improperly accounted EAS fluctuations, neural network training effects, etc. . For example, it is easy to realize that the occurrence of a break in the individual energy spectra combined with the well known stronger shower fluctuations for light primaries could qualitatively account for such an effect. Generally, this would produce a bias towards a lighter composition the steeper the power law distribution of the true proton spectrum is.
The experimental data match well to direct measurements recently reported by the JACEE and RUNJOB experiments up to eV (Asakimori et al., 1998; Apanasenko et al., 2001). While RUNJOB reports an almost constant composition of in the energy range - eV, that of JACEE tends to increase from 1.5 to 2.5 in the same energy range. This may point to some methodical problems in at least one of the two experiments. However, the statistical and systematic uncertainties of both experiments are still sufficiently large at eV ( for RUNJOB and for JACEE) to be compatible to one another and to the reported KASCADE data. Even though only 40 % of the available RUNJOB data have been included in that analysis and some more data being available from JACEE, the unsatisfactory situation of lacking statistics in direct experiments around eV will hardly change in the near future.
5 Discussion and Outlook
We have presented results on tests of the latest versions of currently available hadronic interaction models implemented into CORSIKA. Only three of the models (QGSJET, DPMJET II-5, and neXus 2) could describe the experimentally observed trigger rates at a reasonable level. The models Sibyll 1.6, VENUS, and HDPM overestimate the hadron trigger rates by up to a factor of 3. The differences in the predicted trigger rates are strongly correlated to the amount of diffractive dissociation, as can be seen from the Feynman- distributions of leading baryons in Fig. 3. Clearly, there is a need to improve the knowledge about diffractive interactions up to the highest energies by conducting either dedicated experiments or by increasing the forward acceptance of currently operating and planned accelerator experiments.
Investigating the properties of QGSJET, neXus, and DPMJET in EAS at energies around the knee reveals some problems also for the latter two models. neXus 2 predicts too little hadronic energy at given electron size, i.e. the balance between electromagnetic and hadronic energy disagrees with experimental data. DPMJET II-5, on the other hand, produces too many hadrons (and electrons) at given muon size, i.e. the EAS penetrate too deeply into the atmosphere. Thus, applying DPMJET II-5 for composition studies would mimic a too heavy composition. Combining all results, QGSJET still provides the best overall description of EAS in the knee region. Nevertheless, a continuation of such tests up to higher primary energies with optimized experimental observables and with tuned cuts to the hadron energy, appears mandatory in absence of adequate accelerator experiments.
Analysing the energy spectrum and composition of CRs in the knee region calls for suitable analysis techniques which properly account for mass and energy dependent EAS fluctuations and which enable the simultaneous usage of many (correlated) EAS parameters. Here, we have presented results from an ‘inclusive’ unfolding technique applied to the electron and muon shower size distributions at different zenith angles as well as results from an ‘exclusive’ neural network algorithm. The notations ‘inclusive’ and ‘exclusive’ refer to the fact that the unfolding algorithm does not aim at providing information about the primary energy and mass in single events, but only for the full sample of events. In other words, the technique is applied to measured shower size distributions and it supplies energy distributions. This lack of information in single events appears to be well compensated for by the sensitivity to details of the primary energy spectra. Employing this approach provides, for the first time, primary energy spectra for different mass species. Without making any ‘a priory’ assumption about the individual energy spectra, we find power-law distributions with a knee-like structure in each of the distributions. The observed shift of the knee energies supports the picture of a rigidity dependent cut-off, as expected from most astrophysical models of CR origin and acceleration.
The neural network approach confirms these overall trends but quantitative differences to the unfolding technique are observed and deserve further studies. Using only the electron and muon shower size as input does not allow to adequately distinguish more than two or at most three mass groups on a shower-by-shower basis. However, another advantage besides the shower-by-shower information is the simple inclusion of more EAS observables and the automatic consideration of correlations among the parameters. Such multi-parameter analyses have revealed systematic effects in the reconstructed energy and mass depending of the EAS observables used (Antoni et al., 2002), thereby demonstrating the need for further improvements of the EAS simulations.
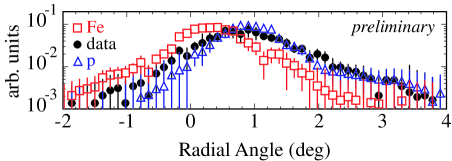
Clearly, much more work is still needed to verify and manifest the important finding of the observed break in the individual energy spectra. Despite the enormous progress made in recent years, parallel efforts are still required to (i) improve the modelling of EAS and to understand also the tails in the distributions of EAS observables, (ii) to continue developing advanced and complementary EAS analysis techniques, (iii) to provide additional EAS observables by the experimental data, and (iv) to improve the statistics and reconstruction accuracies particularly at the highest energies ( eV) in order to verify the occurrence of an iron knee. All of these aspects are presently addressed by the KASCADE collaboration. For example, besides improvements to CORSIKA and its interaction models, a new two-dimensional non-parametric unfolding algorithm has been developed to account also for the shower-by-shower correlations of the electron and muon numbers (Roth, 2002; Antoni et al., 2002). The preliminary results obtained with that method agree well with those presented in this article. Also, new observables just become available in KASCADE and will be included in future analyses. As an example we show in Fig. 8 preliminary results of the muon production height as extracted from the data of the streamer tube tracking detector in the tunnel north of the central detector (Büttner et al., 2001). This observable will become very powerful particularly at energies eV, but further optimization of the tracking algorithm and cut parameters is still needed before including the observable in the standard set of energy and composition parameters. Finally, in order to improve the measurements of primary energy and mass up to energies of about eV, the KASCADE and EAS-TOP experiment have been combined at the site of Forschungszentrum Karlsruhe to form a new experiment, called KASCADE-Grande (Bertaina et al., 2001). After finishing the deployment of 37 stations of 10 m2 detection area each over an area of km2 by the end 2001 the new experiment will start to take data in spring 2002.
Acknowledgements.
This work has been supported by Forschungszentrum Karlsruhe, by the Ministry for Research of the Federal Government of Germany (BMBF), by a grant of the Romanian National Agency for Science, Research and Technology, by a research grant of the Armenian Government, and by the ISTC project A116. The collaborating group of the Cosmic Ray Division of the Soltan Institute of Nuclear Studies in Lodz is supported by the Polish State Committee for Scientific Research. The KASCADE collaboration work is embedded in the frame of scientific-technical cooperation (WTZ) projects between Germany and Armenia, Poland, and Romania.References
- Asakimori et al. (1998) Asakimori, K. et al. (JACEE Coll.), Astrophys. J. 502 (1998) 278
- Antoni et al. (1999) Antoni, T. et al. (KASCADE Coll.), J. Phys. G25 (1999) 2161
- Antoni et al. (2001) Antoni, T. et al. (KASCADE Coll.), J. Phys. G27 (2001) 1785
- Antoni et al. (2002) Antoni, T. et al. (KASCADE Coll.), Astropart. Phys. 16 (2002) 373
- Antoni et al. (2002) Antoni, T. et al. (KASCADE Coll.), Astropart. Phys. 16 (2002) 245
- Antoni et al. (2002) Antoni, T. et al. (KASCADE Collaboration), to be subm. to Phys. Rev. Lett. (2002)
- Apanasenko et al. (2001) Apanasenko, A.V. et al. (RUNJOB Collaboration), Astropart. Phys. 16 (2001) 13
- Avila et al. (1999) Avila, C. et al. (E811 Collaboration), Phys. Lett. B445 (1999) 419
- Berezhko and Ksenofontov (1999) Berezhko, E.G. and Ksenofontov L.T., J. Exp. Theor. Phys. 89, (1999) 391.
- Bertaina et al. (2001) Bertaina, M. et al. (KASCADE-Grande Collaboration), 27th ICRC, Hamburg, (2001) 792
- Block, Halzen, Stanev (2000) Block, M.M., Halzen, F., Stanev, T., Phys. Rev. D62 (2000) 077501
- Büttner et al. (2001) Büttner, C. et al. (KASCADE Collaboration), 27th ICRC, Hamburg, (2001) 241
- Doll et al. (1990) Doll, P. et al. (KASCADE Collaboration), Report KfK 4648, Kernforschungszentrum Karlsruhe, 1990
- Dova, Epele, and Swain (2001) M.T. Dova, L.N.Epele, and J.D. Swain, astro-ph/0112191 (2001)
- Drescher et al. (2000) Drescher, H.J. et al., Phys. Rep. 350 (2001) 93
- Drury (1994) Drury, L. O’C., Contemp. Phys. 35, 1994.
- Erlykin and Wolfendale (1997) Erlykin, A.D. and Wolfendale, A.W., J. Phys. G23 (1997) 979
- Erlykin and Wolfendale (1998) Erlykin, A.D. and Wolfendale, A.W., Astropart. Phys. 9 (1998) 213
- Gaisser (2000) Gaisser, T.K., astro-ph/0011524, (2000)
- Glasstetter et al. (1999) Glasstetter, R. et al. (KASCADE Collaboration), 26th ICRC Salt Lake City 1 (1999) 222
- Gold (1964) Gold, R., Argonne Nat. Lab. Report ANL-6984, Argonne, 1964
- Heck (1998) Heck, D. et al., Report FZKA 6019, Forschungszentrum Karlsruhe, 1998
- Heck et al. (2001) Heck, D. et al. (KASCADE Collaboration), 27th ICRC, Hamburg, (2001) 233
- Kaidalov (1979) Kaidalov, A.B., Phys. Rep. 50 (1979) 157
- Kalmykov and Ostapchenko (1993) Kalmykov, N.N. and Ostapchenko, S.S., Yad. Fiz. 56 (1993) 105
- Kazanas and Nicolaidis (2001) Kazanas, D. and Nicolaidis, A., hep-ph/0109247 (2001)
- Klages et al. (1997) Klages, H.O. et al. (KASCADE Collaboration), Nucl. Phys. (Proc. Suppl.) 52B (1997) 92
- Milke et al. (2001) Milke, J. et al. (KASCADE Collaboration), 27th ICRC, Hamburg, (2001) 241
- Milke (2002) Milke, J., Doctoral Thesis, University Karlsruhe (2002)
- Nikolsky (1995) Nikolsky, S.I., Nucl. Phys. B (Proc. Suppl.) 39A (1995) 157
- Ranft (1999) Ranft, J., preprint hep-ph/9911213 (1999)
- Risse (2000) Risse, M., Doctoral Thesis, University Karlsruhe (2001)
- Roth et al. (2001) Roth, M. et al. (KASCADE Collaboration), 27th ICRC, Hamburg, (2001) 88
- Roth (2002) Roth, M., private communication (2002)
- Swordy (1995) Swordy, S., 24th ICRC, Rome, 2 (1995) 697
- Swordy et al. (2002) Swordy, S., et al., (Knee-workshop, Chicago 2000), Astropart. Phys. (2002) in press
- Ulrich et al. (2001) Ulrich, H. et al. (KASCADE Collaboration), 27th ICRC, Hamburg, (2001) 97
- Ulrich (2002) Ulrich, H., Doctoral Thesis, University Karlsruhe (2002)
- Watson (1998) Watson, A.A., 25th ICRC Durban 8 (1998) 257
- Weber et al. (1999) Weber, J.H. et al. (KASCADE Collaboration), 26th ICRC Salt Lake City 1 (1999) 347
- Wigmans (2000) Wigmans, R., Nucl. Phys. B (Proc. Suppl.) 85 (2000) 305