The Heavy Element Enrichment of Ly Clouds in the Virgo Supercluster11affiliation: Based on observations with the NASA/ESA Hubble Space Telescope, obtained at the Space Telescope Science Institute, which is operated by the Association of Universities for Research in Astronomy, Inc., under NASA contract NAS 5-26555.
Abstract
Using high signal-to-noise echelle spectra of 3C 273 obtained with the Space Telescope Imaging Spectrograph (resolution = 7 km s-1 FWHM), we constrain the metallicities of two Ly clouds in the vicinity of the Virgo cluster. We detect C II, Si II, and Si III absorption lines in the Ly absorber at = 0.00530. Previous observations with the Far Ultraviolet Spectroscopic Explorer have revealed LyLy absorption lines at the same redshift, thereby accurately constraining the H I column density. We model the ionization of the gas and derive [C/H] = , [Si/C] = , and log . The model implies a small absorber thickness, pc, and thermal pressure cm-3 K. It is most likely that the absorber is pressure confined by an external medium because gravitational confinement would require a very high ratio of dark matter to baryonic matter. Based on a sample of Milky Way sight lines in which carbon and silicon abundances have been reliably measured in the same interstellar cloud (including new measurements presented herein), we argue that it is unlikely that the overabundance of Si relative to C is due to depletion onto dust grains. Instead, this probably indicates that the gas has been predominately enriched by ejecta from Type II supernovae. Such enrichment is most plausibly provided by an unbound galactic wind, given the absence of known galaxies within a projected distance of 100 kpc and the presence of galaxies capable of driving a wind at larger distances (e.g., H I 1225+01). Such processes have been invoked to explain the observed abundances in the hot, X-ray emitting gas in Virgo. However, the sight line to 3C 273 is more than 10∘ away from the X-ray emission region. We also constrain the metallicity and physical conditions of the Virgo absorber at = 0.00337 in the spectrum of 3C 273 based on detections of O VI and H I and an upper limit on C IV. If this absorber is collisionally ionized, the O VI/C IV limit requires K in the O VI-bearing gas. For either collisional ionization or photoionization, we find that [O/H] at = 0.00337.
1 Introduction
The heavy element enrichment of the intergalactic medium (IGM) provides a valuable constraint on physical processes that play critical roles in the evolution of galaxies. Elements heavier than boron are synthesized in stars (presumably mostly located within galaxies), and understanding how these elements are removed from galaxies and transported into the IGM will likely yield insights on galaxy evolution. Is the IGM enriched by supernova-driven galactic winds, dynamical processes such as tidal or ram-pressure stripping, or all of these mechanisms? How does this affect/regulate star formation in galaxies? IGM enrichment also has cosmological implications. For example, the processes which deposit heavy elements in the IGM will also deposit energy, and this “feedback” can have important effects on cosmological structure growth (e.g., Kaiser 1991; Ponman, Cannon, & Navarro 1999; Cen & Bryan 2001; Voit & Bryan 2001).
IGM enrichment has been modeled using methods ranging from semi-analytic calculations to hydrodynamic simulations, and a variety of theoretical predictions have been made regarding the heavy element content of intergalactic gas at both high and low redshifts (e.g., Cen & Ostriker 1999b; Ferrara, Pettini, & Shchekinov 2000; Aguirre et al. 2001). These predictions can be tested using QSO absorption lines to estimate the metallicity of the IGM in a variety of contexts. Observations of QSO absorption-line systems have shown that the high-redshift IGM is remarkably-widely enriched with metals (Cowie et al. 1995; Tytler et al. 1995), and statistical analyses have indicated that this enrichment extends even to the absorbers with the lowest H I column densities (Ellison et al. 2000; Schaye et al. 2000).
Recently, high signal-to-noise (S/N) UV spectroscopy of 3C 273 with the Space Telescope Imaging Spectrograph (STIS) and the Far Ultraviolet Spectroscopic Explorer (FUSE) has provided an opportunity to probe the IGM enrichment within a particularly interesting environment: the Virgo cluster/supercluster. In this paper we derive constraints on the heavy element abundances in two Ly clouds in the immediate vicinity of this cluster. The sight line to 3C 273 extends through the Virgo cluster “Southern Extension” (e.g., Binggeli, Popescu, & Tammann 1993), although the projected distance from the sight line to M87 and the X-ray region is substantial ( Mpc). In the 3C 273 spectrum, there are three Ly clouds at Virgo redshifts; in this paper we are mainly interested in the Virgo absorbers at = 0.00337 and 0.00530. The connections between these Virgo absorption systems and nearby galaxies have been extensively studied (see §4.3), but measurements of the metallicities of these Ly absorbers have not been previously obtained. It is now possible to estimate the metal abundances in these Virgo Ly clouds due to two observational advances. First, Sembach et al. (2001) have presented a surprising result from the FUSE observation: the Virgo absorber at = 0.00530 is detected in seven higher Lyman series lines (Ly - Ly). This clearly establishes that the H I column is substantially higher than previously thought; from a curve-of-growth (COG) analysis, Sembach et al. (2001) derive log N(H I) = 15.85, an increase by a factor of more than 40 over the previous estimate based on fitting the profile of Ly only.111Using ORFEUS II observations of the Ly line at this redshift, Hurwitz et al. (1998) provided the first evidence that the column density of this system was substantially higher than expected based on profile fitting of the Ly transition alone. However, with only Ly and Ly, they were unable to tightly constrain (H i) and (see their Figure 4). More importantly, the H I column density and Doppler parameter are accurately constrained from the COG. Second, the high signal-to-noise STIS observations at 7 km s-1 resolution have enabled the detection of very weak lines in the 3C 273 spectrum, including weak lines of C II, Si II, and Si III at = 0.00530. In this paper, we use these weak metal lines and the new H I measurement to explore the heavy element enrichment of this Virgo Ly system at = 0.00530. We also constrain the metallicity of the lower-redshift Virgo Ly cloud ( = 0.00337) based on the detection of O VI and the absence of C IV.
The paper is organized as follows. In §2 we present the new STIS observations and absorption line measurements, and we briefly comment on the well-known galaxy structures at Virgo redshifts in the vicinity of the 3C 273 sight line. In §3 we model the ionization of the gas and derive constraints on the metallicity, density, and temperature of the Ly absorbers. We discuss the implications of the measurements and the nature of the absorbing gas in §4, and we summarize the main results in §5. In the Appendix we provide additional details on new Galactic ISM measurements to supplement the analysis in §4. Throughout the paper, we report heliocentric wavelengths and redshifts,222In the direction of 3C 273, km s-1 assuming the standard definition of the Local Standard of Rest (Kerr & Lynden- Bell 1986). and we assume km s-1 Mpc-1 and .
2 Observations and Measurements
Observations of 3C 273 were obtained with the E140M echelle mode of STIS, using the aperture, on 2000 May 2 and 2000 June 21-22. This mode provides a resolution of 7 km s-1 (FWHM) and records the spectrum between 1150 and 1700 Å with only a few small gaps between orders at 1615 Å (Kimble et al. 1998; Woodgate et al. 1998). The total integration time was 18.67 ksec, and this resulted in signal-to-noise ratios ranging from 6 to 66 per resolution element. The data reduction followed standard procedures, including the scattered light correction developed by the STIS Investigation Definition Team.
A selected portion of the final spectrum is shown in Figure 1. This portion of the spectrum spans the wavelength range of Ly lines at redshifts within the Virgo cluster/supercluster. Previous HST studies have detected two Ly clouds within the Virgo cluster at high significance levels at = 0.003 and 0.005, but a third Ly absorber at = 0.007 was reported in some studies but not confirmed (see §3.3.1 of Morris et al. 1993). For example, Brandt et al. (1997) do not list a line at = 0.007 in their intermediate-resolution GHRS atlas of 3C 273. However, Penton et al. (2000) claim a significant detection of this line using GHRS/G160M data, and a weak feature is evident at the right wavelength in the Brandt et al. spectrum. The new STIS spectrum settles this question: a broad feature with rest-frame equivalent width333Rest-frame equivalent width , where is the observed equivalent width. mÅ is detected at = 0.00745.
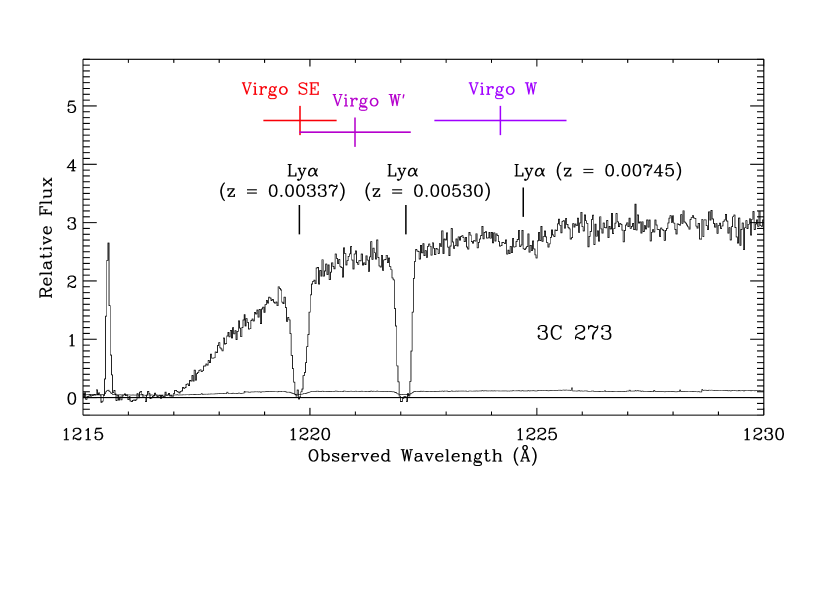
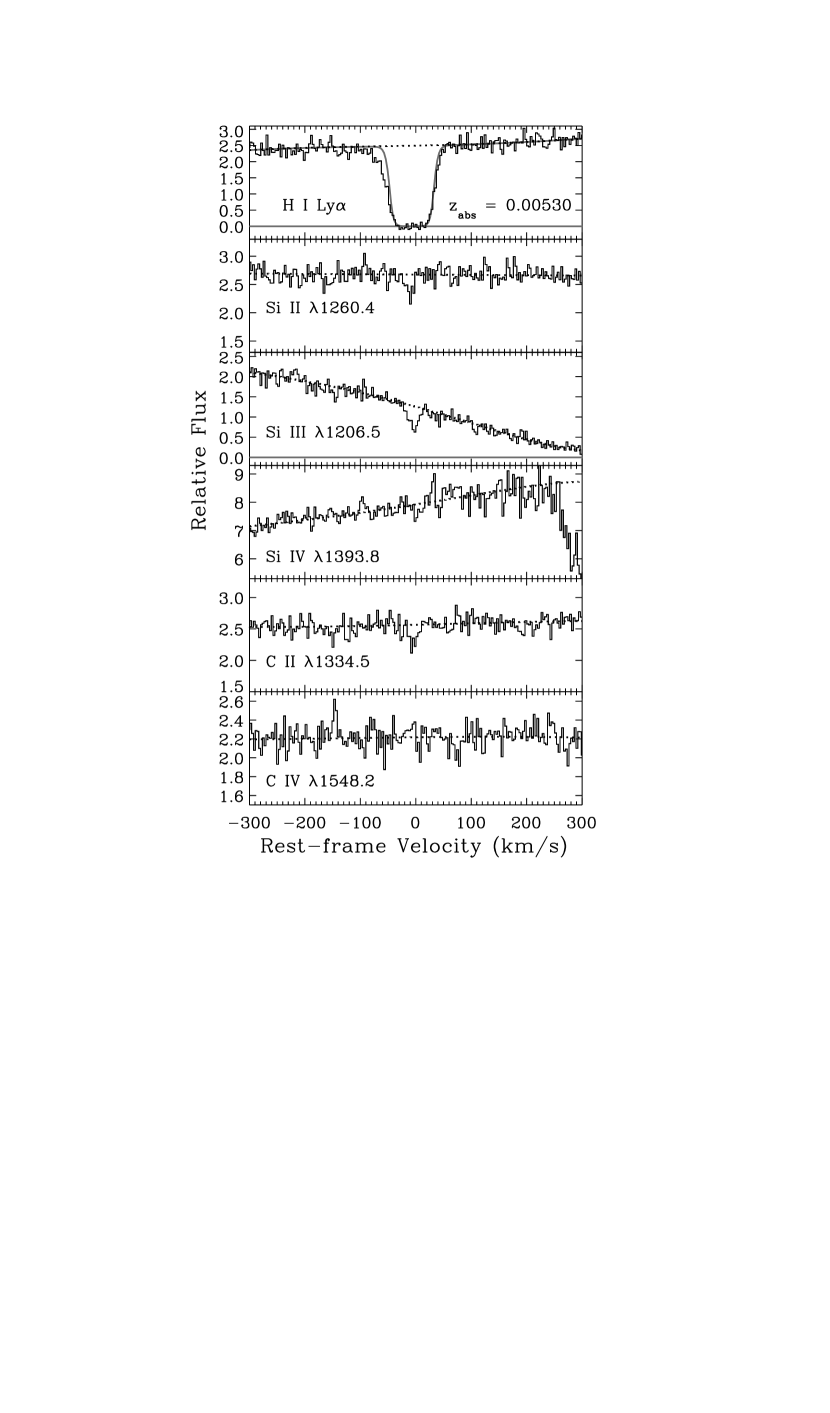

Figure 1 also indicates the expected wavelengths of Ly lines at the mean redshifts of several Virgo galaxy structures near the 3C 273 sight line. It has long been recognized that there are several large “clouds” of galaxies in the immediate vicinity of the Virgo cluster that have distinct kinematics and morphologies (e.g., de Vaucouleurs 1961). According to Binggeli, Popescu, & Tammann (1993), the 3C 273 sight line pierces the structures known as the Virgo “Southern Extension” ( km s-1, velocity dispersion km s-1) and the Virgo W cloud ( km s-1, = 356 km s-1). The Virgo W’ cloud is also in this region ( km s-1, = 301 km s-1). The relationships between these structures and the Virgo cluster proper are not entirely clear. As noted, our pencil beam to 3C 273 is at a substantial projected distance from the Virgo X-ray emission. At any rate, the sight line probes a structure that contains a large number of galaxies in the general vicinity of the Virgo cluster. For convenience, we simply refer to this region as the Virgo supercluster in this paper.
Figure 2 shows the absorption profiles of lines detected in the = 0.00530 absorber including H I Ly, Si II 1260.4, Si III 1206.5, and C II 1334.5, as well as the regions of the spectrum covering the undetected Si IV 1393.8 and C IV 1548.2 lines. We note the presence of a very weak feature near the expected wavelength of the Si IV transition. However, the significance of this feature is much less than , and furthermore this spectral region is partially obscured by the field electrode of the FUV-MAMA detector, the “repeller wire” (Woodgate et al. 1998). In the majority of the 3C 273 observations, the repeller introduces significant artifacts into the spectrum which are not adequately removed by the flat field. Sembach et al. (2001) do not report significant detection of any metals at = 0.00530 in the FUSE 3C 273 spectrum, but the stronger transition of the O VI doublet is blended with strong Milky Way absorption lines. Similarly, the strong C III 977.0 line falls close to a Galactic H2 absorption line at this redshift.
The only line detected at = 0.00337 in the STIS E140M spectrum of 3C 273 is the Ly transition. However, Sembach et al. (2001) have also detected Ly and O VI 1031.9 at this redshift in the FUSE spectrum. Figure 3 shows the Ly line at = 0.00337 as well as regions of strong metal lines that are not detected.
We have measured the absorption-line equivalent widths and integrated apparent column densities444The integrated apparent column density is given by , where is the oscillator strength, is the wavelength (the numerical coefficient in the latter expression assumes is in Å), is the observed line intensity and is the estimated continuum intensity at velocity ; see Savage & Sembach (1991) for further details. using the techniques of Sembach & Savage (1992), which include in the overall error evaluation the uncertainty in the level and curvature of the continuum and a 2% flux zero point uncertainty, as well as the usual photon-counting uncertainty. The equivalent widths and column densities of the = 0.00530 absorption system are summarized in Table 1 along with upper limits on undetected species of interest. Equivalent widths, column densities, and upper limits from the = 0.00337 absorber are listed in Table 2.
Based on previous GHRS observations of 3C 273, Sembach et al. (2000) report that the equivalent width of the Ly line at = 0.00530 is 40 mÅ stronger than predicted by their COG analysis of the Ly - Ly lines at this redshift. As shown in the top panel of Figure 2, we confirm this result with the higher resolution STIS data. The excess equivalent width in the STIS spectrum is 50 mÅ and is most evident on the blue side of the profile. While this establishes that multiple components contribute to the H I absorption, the additional component in the Ly profile is probably too weak to significantly affect the lines higher in the series, and Sembach et al. show that including or excluding Ly does not change (H I) and significantly (see their Table 4). We discuss the implications of the Ly profiles below.
| Species | bbRest-frame vacuum wavelength and oscillator strength from Morton (2002) or Morton (1991). | bbRest-frame vacuum wavelength and oscillator strength from Morton (2002) or Morton (1991). | ccRest-frame equivalent width. | ddProfile-weighted mean velocity of the line, | log | S/NeeSignal-to-noise ratio per two-pixel resolution element in the continuum near the absorption line. The Si III 1206.5 line is located in the blue wing of the Milky Way damped Ly profile. Here the steep slope of the continuum leads to rapidly decreasing S/N with increasing wavelength, so we list the S/N range within 50 km s-1 of the line. |
|---|---|---|---|---|---|---|
| (Å) | (mÅ) | (km s-1) | ||||
| H I……. | 1215.67 | 0.416 | 37712 | 23 | ||
| Si II…… | 1260.42 | 1.18 | 8.92.6 | 11.76 | 30 | |
| Si III…. | 1206.50 | 1.67 | 36.86.1 | 12.330.08 | ||
| Si IV….ffThe Si IV 1393.8 line is located in a region of the spectrum affected by the FUV MAMA repeller wire. This introduces features into the spectrum which are not adequately removed by the flatfield. Furthermore, the line is close to the order edge where spurious features are occasionally evident. | 1393.76 | 0.514 | gg upper limit. | hh upper limit derived from the equivalent width upper limit assuming the linear curve-of-growth is appropriate. | 27 | |
| C II…… | 1334.53 | 0.127 | 10.32.6 | 12.74 | 34 | |
| C IV….. | 1548.20 | 0.191 | gg upper limit. | hh upper limit derived from the equivalent width upper limit assuming the linear curve-of-growth is appropriate. | 25 | |
| Al II…… | 1670.79 | 1.83 | gg upper limit. | hh upper limit derived from the equivalent width upper limit assuming the linear curve-of-growth is appropriate. | 17 | |
| Fe II…… | 1608.45 | 0.0580 | 16 | |||
| O I…….. | 1302.17 | 0.0519 | gg upper limit. | hh upper limit derived from the equivalent width upper limit assuming the linear curve-of-growth is appropriate. | 34 |
| Species | log | S/N | ||||
|---|---|---|---|---|---|---|
| (Å) | (mÅ) | (km s-1) | ||||
| H I……… | 1215.67 | 0.416 | 38912 | |||
| Si III….. | 1206.50 | 1.67 | 34.5bb3 upper limit. | 12.2bb3 upper limit. | 20 | |
| C IV…… | 1548.20 | 0.191 | bb3 upper limit. | bb3 upper limit. | 24 | |
| O VI…… | 1031.93 | 0.0659 | 25.47.1ccEquivalent width and column density reported by Sembach et al. (2001). The equivalent width is the weighted mean of the measurements from the two FUSE channels, and the column density is from their Table 4. | ccEquivalent width and column density reported by Sembach et al. (2001). The equivalent width is the weighted mean of the measurements from the two FUSE channels, and the column density is from their Table 4. |
3 Analysis
3.1 = 0.00530
From the COG analysis of the Ly - Ly lines at = 0.00530, Sembach et al. (2001) obtain km s-1. Therefore the gas temperature 16,000 K. Even though (H I) has been dramatically revised to a larger value in this absorber, with log (H I) = 15.85 the gas is still optically thin below the Lyman limit. With this column density, the gas is likely to be substantially ionized by the UV background radiation from QSOs. Consequently, to derive abundances, ionization corrections must be applied. For this purpose, we have made use of ionization models constructed with the photoionization code CLOUDY (v94.00, Ferland et al. 1998). Collisional ionization may also be important, but collisional processes are included in CLOUDY, and as we shall see, the mean gas temperature in the best CLOUDY model is fully consistent with the upper limit implied by the value. Therefore even if collisional ionization is dominant, these models should provide reasonable estimates of the metal abundances. Throughout this section we shall restrict our attention to gas-phase abundances; we discuss how depletion onto dust grains could affect the abundances in §4.
In the photoionization models, the gas is assumed to be adequately approximated by a plane-parallel, constant density slab. We adopt the background radiation field at = 0 due to QSOs, as computed by Haardt & Madau (1996) with the mean intensity at 1 Rydberg set to ergs s-1 cm-2 Hz-1 sr-1 (see Shull et al. 1999; Davé & Tripp 2001; Weymann et al. 2001 and references therein).555Scott et al. (2002) have recently derived ergs s-1 cm-2 Hz-1 sr-1 from the proximity effect in a large number of QSO spectra obtained with the Faint Object Spectrograph at 0.03 1.0. Given the redshift range to which this applies, this is consistent with the expected evolution of and the value we have assumed for 0. The model column densities primarily depend on the ionization parameter or, equivalently, the gas density since = H ionizing photon density/total H number density, and is set by the assumed shape and intensity of the ionizing radiation field. At low metallicities, the column densities scale directly with the overall metallicity . We constrain the ionization parameter using the observed Si III/Si II ratio, but we allow the relative abundance of silicon to carbon to vary since the gas may not have a solar abundance pattern.
We begin with the most simple model, assuming that the C II, Si II, and Si III absorption lines arise in the same gas. As we discuss below, there is some evidence that these lines do not all occur in the same phase, but the evidence is not yet strong enough to rule out this possibility. With this assumption, Figure 4 shows the CLOUDY model that provides the best simultaneous fit to the observed C II, Si II, and Si III column densities. In the usual logarithmic notation,666[X/Y] = log (X/Y) log (X/Y)⊙. Solar reference abundances are taken from Holweger (2001). we obtain an excellent fit with the following abundances: [C/H] = and [Si/H] = with cm-3 (or log ). At this density, the model predicts a gas temperature of 14,000 K, which is consistent with the upper limit on from the value obtained by Sembach et al. (2001). Figure 4 also shows that the absence of detectable Si IV and C IV absorption in this system is fully consistent with the model. At log , the predicted Si IV and C IV columns are more than an order of magnitude below the observational limits. The model is consistent with the other upper limits as well, including the upper limit on (C III) set by Sembach et al. (2001). We note that the model is required to produce the observed H I column density, log (H I) = 15.85, and consequently as is increased and the gas becomes more highly ionized, the thickness of the slab is increased to match the observed H I column. This is why (Si II) and (Si III) both increase with increasing even though the ion fraction of Si II decreases with increasing over the range shown in Figure 4.
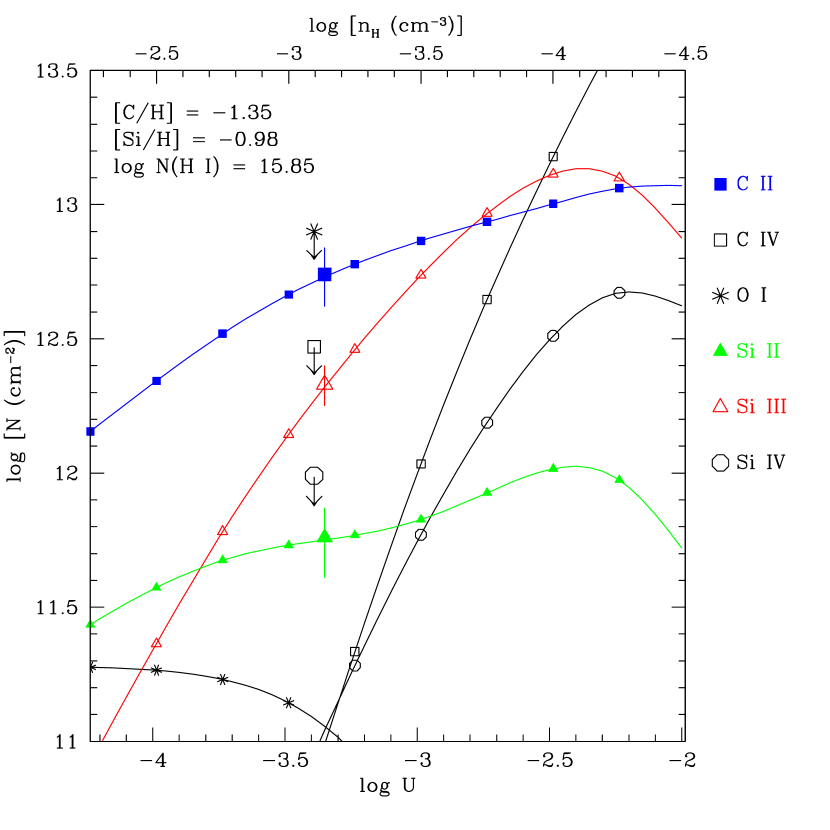
It is interesting to note that silicon, an group element, is overabundant compared to C by dex in this model. We initially attempted to reproduce the observed column densities assuming that the relative heavy element abundances in the Virgo absorber follow the solar pattern as well (i. e., [Si/C] = 0.0), but we found that this could not be done. This is apparent from a brief inspection of Figure 4: when the Si III/Si II ratio is reproduced, the model produces too much C II if [Si/C] = 0.0 (multiphase models presented below require a somewhat lower Si overabundance, but the best fit in these models still yields [Si/C] 0.2). We discuss the implications of this result in §4.
As shown by Weymann et al. (1995) with regard to H ionization, local sources of photoionization, such as X-rays from the hot gas in the Virgo cluster or UV flux escaping from nearby galaxies, are unlikely to be important compared to photoionization by the background UV flux from QSOs. We confirm that the heavy element results presented above are insensitive to these issues. For example, if we include X-ray flux from the hot gas (following §3.1.4 in Weymann et al. 1995) in the CLOUDY model, we find only miniscule changes in the column densities of interest compared to Figure 4. Similarly, if we assume that the radiation field is dominated by the UV flux from stars, we obtain very similar constraints on the heavy element abundances. Even lower Si IV and C IV column densities are predicted in this case, so the observational constraints in Table 1 are easily satisfied. However, if stellar flux were competitive with the QSO background, the gas density would be higher; the combined flux from the QSO/AGN background and the stellar sources leads to a higher photon density, so the gas density must also be higher to produce the same ionization parameter.
We next consider the possibility that the absorption occurs in a multiphase medium in which the C II, Si II, and Si III lines do not entirely come from the same gas. As shown in Figure 5, the centroids of these lines (see also column 5 in Table 1) marginally support this hypothesis: the C II and Si II lines are blueshifted by 5 km s-1 compared to the centroid of the Si III absorption. Also, the Si III profile appears to show two components with the weaker component more closely aligned with the Si II and C II lines. However, the Si II and C II lines are very weak and therefore could be misleading due to noise. Consequently, we conclude that while there are reasonable indications that this is a multiphase absorption system, this requires confirmation with higher S/N data.
Even if the absorber is a multiphase medium, we can still derive useful estimates of the heavy element abundances because the H I, C II, and Si II absorption should predominantly originate in the same, lower-ionization, phase. To show this, we plot in Figure 6 the ion fractions of H I, C II, Si II, and Si III vs. log from the same model shown in Figure 4. We also show the gas temperature predicted by the model over this range of . From this figure one can see that the ion fractions of H I, C II, and Si II show very similar trends as the gas becomes more ionized, and it is reasonable to assume that the lines of these three species arise in the same gas. Furthermore, Si III does not follow the lower ionization species, and it would not be surprising to find that there is somewhat more ionized gas that produces a Si III line that is substantially stronger than the Si II line. The bulk of the H I detected in higher Lyman series lines should be affiliated with the Si II/C II gas. However, the higher-ionization Si III-bearing gas may produce weaker H I absorption that may be detectable in the Ly transition (unless it is confined to the strongly saturated portion of the Ly profile). More importantly, it is evident from Figure 6 that some Si III arising in the Si II/C II phase is likely to be detectable, and this may explain the indications of a weaker component in the Si III profile at the velocity of the Si II and C II lines. The column density of this weaker component is poorly constrained due to blending of the two components and the S/N of the data, but fitting two components to the Si III profile with the Fitzpatrick & Spitzer (1997) profile-fitting code and the line spread functions from the STIS Handbook (Leitherer et al. 2001) yields log (Si III) for the weaker component.


Assuming the H I, C II, and Si II lines go together and adopting log (Si III) for the Si II/C II-bearing gas, we find from the photoionization models that the following abundances are consistent with the observed column densities within the uncertainties:
| (1) |
and
| (2) |
with
| (3) |
At the current S/N level, the presence of a more highly ionized phase that produces an additional Si III component (discussed in the previous paragraph) does not conflict with the upper limits on Si IV and C IV. However, at higher S/N levels, C IV and/or C II absorption associated with this more highly ionized component should be detectable. It is possible that some of the C II absorption that we have already detected is associated with the more highly ionized extra Si III component. If so, then we have overestimated [C/H] and we have underestimated [Si/C]. Decreasing [C/H] and increasing [Si/C] to compensate for this would only strengthen our interpretation of the nature of this absorber (§4).
The model has some interesting implications. With these constraints on , the model predicts K (see Figure 6), and the cloud pressure K cm-3. However, the thickness of the gas slab is only 70 pc for log . This is vastly smaller than expected for a gravitationally confined Ly cloud with an ordinary ratio of baryons to dark matter; a photoionized, self-gravitating cloud with log (H I) = 15.85, the inferred temperature, and a gas fraction would be several orders of magnitude larger (see Schaye 2001). The inferred absorber thickness is somewhat sensitive to the ionization parameter. For example, if we decrease the density to log = (i.e., log ), then the thickness increases to pc. This is still much smaller than expected for a self-gravitating cloud. The cloud mass is uncertain due to the unknown geometry and impact parameter. If spherical, the cloud has a rather small baryonic mass on the order of M⊙, but the mass could be substantially larger with other geometries. Similar properties have recently been derived for a subset of weak Mg II systems at 1 (Rigby, Charlton, & Churchill 2002).
The small line-of-sight size implied by the model indicates that either (1) the fraction of the absorber mass in the form of baryonic gas is extremely small (), (2) the absorber is pressure-confined by an external medium, or (3) the gas is out of equilibrium and will rapidly expand or evaporate. A small could arise in a small dark matter halo that expelled most of its gas in an early episode of star formation. Mac Low & Ferrara (1999) have shown that SN can expel most of the ISM from a very low-mass object. Alternatively, the baryons may have been photoevaporated from a small dark matter halo during the reionization epoch (e.g., Klypin et al. 1999; Barkana & Loeb 1999). Assuming the current gas mass is M⊙, the required would imply that the mass of the dark matter halo is M⊙. A substantial fraction of the gas can be removed from a dark matter halo in this mass range (see references above). However, the baryon removal process must be remarkably efficient, and the gas which remains in the dark matter halo must be in a relatively quiescent state (there is some evidence of component structure in the absorption lines, but the profiles are quite simple compared to many QSO absorption systems). Furthermore, the fact that the baryonic mass (and therefore the implied dark matter halo mass) could be substantially higher with other (perhaps more likely) geometries such as a filament or sheet makes baryon evacuation more difficult and the required value more improbable.
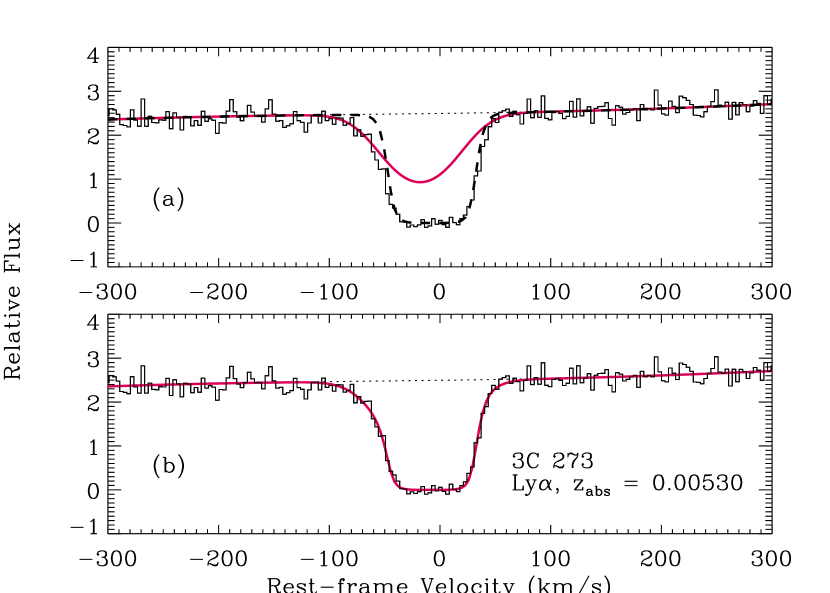
It seems more likely that the absorber is pressure confined by an external medium. For purposes of illustration, Figure 7 shows how the Ly profile at = 0.00530 can easily accomodate a broad component with a value as large as 41 km s-1. If due to the external confining medium, this broad-component Doppler parameter implies that K, and therefore the external medium would need a density cm-3 to confine the metal-bearing gas with the pressure derived above. This is a plausible density for a galaxy halo or the intracluster medium in a galaxy group. However, the fit shown in Figure 7 is not unique, and it is possible that a substantially broader H I component is present. A sufficiently broad and weak component could be hidden in the noise, particularly since the strength of such a feature could be inadvertently reduced by the continuum fitting process. Consequently, could be substantially higher and accordingly lower.
3.2 = 0.00337
We now constrain the metallicity of the 3C 273 Ly cloud at = 0.00337, first assuming the gas is collisionally ionized (§3.2.1), and then considering the possibility that it is photoionized (§3.2.2). The only detected species are H I and O VI. From a curve of growth analysis, Sembach et al. (2001) estimate that this system has log (H I) = 14.410.10 at this redshift. However, the absence of C IV provides a useful constraint for ionization models, and even with only two detected species, we can still place limits on the metallicity of the gas as follows. The logarithmic oxygen abundance is given by
| (4) |
where is the ion fraction and (O/H)⊙ is the solar oxygen abundance (we take log (O/H) from Holweger 2001). In general, it is usually possible to minimize (H I)/(O VI), and this sets a lower limit on [O/H] since the other quantities in eqn. 4 are measured. In practice, it can be difficult to ascertain the (H I) that should be assigned to the O VI-bearing gas; there is evidence that some O VI absorbers are multiphase entities (e.g., Tripp, Savage, & Jenkins 2000), and some of the H I absorption may arise in a lower-ionization phase which does not contain O VI.
3.2.1 Collisional Ionization

We first consider collisional ionization. If the O VI-bearing gas is collisionally ionized, then the lower limit on O VI/C IV at = 0.00337 provides a useful lower limit on the gas temperature. Figure 8 shows the C IV and O VI ion fractions in collisional ionization equilibrium (Sutherland & Dopita 1993) and in nonequilibrium radiatively cooling gas (Shapiro & Moore 1976) for K. We see that at K, the ionization of the gas strongly favors C IV if the gas is in equilibrium; in this case the C IV ion fraction is one to several orders of magnitude higher than the O VI ion fraction. To set a lower limit on using the lower limit on O VI/C IV observed at = 0.00337, we must make a further assumption about the intrinsic (O/C) abundance in this absorber. In general, we use the solar relative abundances of Holweger (2001). However, we presented evidence in the previous section that elements are overabundant with respect to carbon in at least one Virgo Ly cloud. Since O usually follows the element abundance patterns (McWilliam 1997), we will assume [O/C] = 0.3; this will set a more conservative lower limit on . In this way, we derive K from the O VI/C IV limit for the equilibrium case. C IV is less strongly favored at lower temperatures in the nonequilibrium model, but nevertheless the O VI/C IV ratio requires a similar lower limit on ; from the nonequilibrium model we obtain .777We note that in the nonequilibrium radiatively cooling gas calculations of Schmutzler & Tscharnuter (1993), the C IV ion fractions are substantially lower, and the O VI/C IV constraint can be satisfied in much cooler gas. The difference is evidently due to atomic data since a comparison of the equilibrium calculations of Shapiro & Moore (1976) to Schmutzler & Tscharnuter shows the same C IV discrepancy. We favor Shapiro & Moore since the C IV ion fractions from the large majority of collisional ionization equilibrium calculations (e.g., Arnaud & Rothenflug 1985; Shull & van Steenberg 1982; Sutherland & Dopita 1993; Mazzotta et al. 1998) agree with the Shapiro & Moore steady state results.
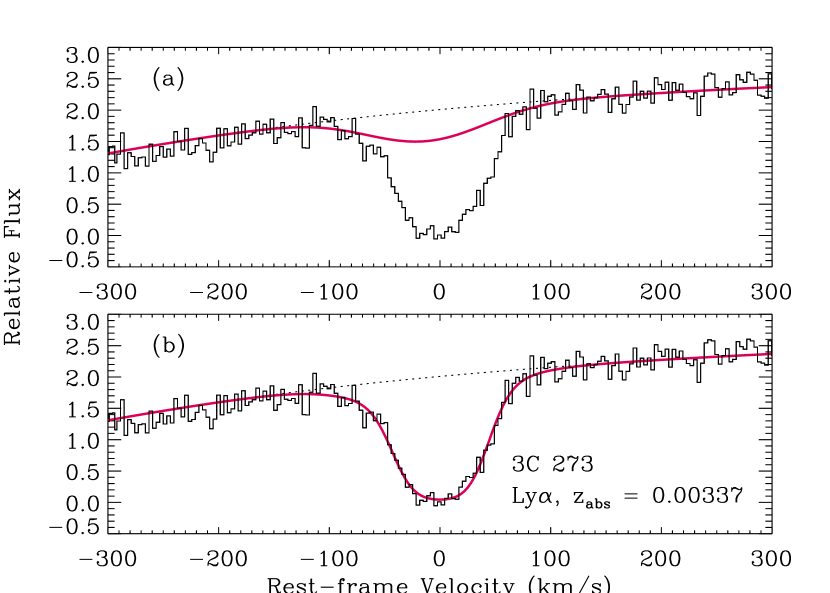
To constrain the H I column associated with the O VI gas, we turn to the Ly profile. If the O VI is due to hot, collisionally ionized gas, then the corresponding H I absorption line should be broad. We note that since the observed O VI/C IV limit requires a similar temperature in the equilibrium and non-equilibrium radiatively cooling gas models, in this absorber a broad component is expected even if the gas was suddenly shock-heated and subsequently cooled faster than it could recombine (as modeled by Shapiro & Moore 1976). The H I value derived by Sembach et al. (2001) from the COG analysis, km s-1, is not compatible with the limits on from O VI/C IV; this implies a temperature upper limit ( K) at which C IV should be substantially stronger than O VI if collisionally ionized. Even at the 3 upper limit, this value implies that C IV should be stronger than or at least comparable to the O VI (see Figure 8).
However, inspection of the top panel of Figure 3 reveals evidence of structure in the Ly profile. It is apparent that a sufficiently broad H I component associated with the O VI is allowed by the data as long as the Ly profile probes multiple phases of the gas. To set a lower limit on [O/H] at = 0.00337, we must minimize (H I)/(O VI). In collisional ionization equilibrium, this occurs at log 5.5, where log (H I)/(O VI) = (Sutherland & Dopita 1993). Figure 9 shows a fit to the Ly profile including a broad component consistent with log = 5.5 (which requires 72 km s-1). The upper panel in Figure 9 shows the broad component only, with = 72 km s-1 and log (H I) = 13.42. To obtain a good fit to the overall profile, an additional, narrower H I component due to a separate, cooler phase must be added, and the lower panel in Figure 9 shows a fit including the broad component in Figure 9a as well as a cooler component with = 33 km s-1 and log (H I) = 14.20. The two-component model shown provides an acceptable fit to the Ly profile and is compatible with the Ly profile recorded with FUSE. So, with log (H I) = 13.42, log (H I)/(O VI) , and log (O VI) = 13.32 for the hot, O VI gas, we obtain [O/H] .
Figure 8 compares the equilibrium O VI and C IV ion fractions to those from a particular non-equilibrium model. Several other non-equilibrium collisionally ionized gas models have been developed such as conductive interfaces or turbulent mixing layers between very hot gas and cool clouds (see §8 in Sembach et al. 1997 for a brief review). Some of these other models, e.g., the conductive interface model of Borkowski et al. (1990), can satisfy the O VI/C IV limit in the = 0.00337 Virgo absorber. However, we note that the turbulent mixing layer model of Slavin et al. (1993) does not produce enough O VI; all of the parameter combinations considered by Slavin et al. lead to O VI/C IV 1. Moreover, the O VI column densities from a single turbulent mixing layer are more than an order of magnitude smaller than the observed O VI column in this system, so a large number of layers would be needed to explain the observations.
3.2.2 Photoionization
We next derive constraints on the metallicity of the = 0.00337 system assuming the O VI is photoionized. In this case, we assume that all of the neutral hydrogen derived from the curve-of-growth analysis (log (H I) = 14.41) is associated with the O VI phase since this provides the most conservative lower limit on [O/H]. In this circumstance, the O VI-bearing gas is consistent with the narrow core of the Ly line because it can be much cooler than in the collisionally ionized case. We use the photoionization models from §3.1 to determine the minimum value of (H I)/(O VI), but we impose the additional stability requirement that the size of the absorbing cloud not exceed the Jeans length.888This stability requirement is easily satisfied in the best-fitting models in §3.1. With these assumptions, we find log (H I)/(O VI) with log and absorber thickness Mpc. Therefore we obtain a similar lower limit to the oxygen abundance, [O/H] . A smaller requires a higher metallicity; kpc requires [O/H] , for example. In principle, the absence of C IV provides an upper bound on the metallicity, but this is compromised by the uncertain (H I) associated with the O VI: if the absorber is multiphase and log (H I) 14.41, then this increases the lower limit on [O/H] (see eqn. 4). Consequently, we can place a firm lower limit on the oxygen abundance but we cannot place a strong upper limit on [O/H].
4 Discussion
We now offer some comments on the implications of these abundance measurements. We first discuss the = 0.00530 absorber. Using the abundance patterns observed in the Milky Way ISM as a reference, we consider whether the Si overabundance in this system could be due to depletion by dust (§4.1) or an intrinsic element overabundance (§4.2); we favor the latter. We then discuss the environment in which the absorber is found and the nature of the absorption system (§4.3). Finally, we make some brief comments on the detection of O VI at the redshift of the Virgo supercluster (§4.4).
4.1 Depletion of C and Si by Dust
We have obtained gas-phase abundance measurements for carbon and silicon at = 0.00530. In the ISM of the Milky Way, both of these elements can be depleted by incorporation into dust grains. Therefore the total abundances, i.e., gas-phase + dust-phase, could be higher than the numbers reported in §3. In the Galactic ISM, Si is usually more substantially depleted than C, which would leave little room for dust depletion in the Virgo absorber studied here. For example, toward Oph, [C/H] = while [Si/H] = (e.g., Sofia, Cardelli, & Savage 1994; Snow & Witt 1996). Before proceeding with this comparison, we note an important caveat. In §3, we modeled the ionization of the Virgo Ly absorber in order to derive the Si and C abundances in the gas. In the Milky Way ISM, such modeling is usually not applied. Instead, measurements of the column densities of ionization stages that are dominant in H I regions are taken to provide a good estimate of the elemental abundance, e.g., [C/H] = log (C II)/(H I) log (C/H)⊙. In this way, gas-phase abundances of species such as Si, Cr, and Fe are found to be substantially reduced compared to abundances of elements such as O, S, and Zn, species that are depleted lightly or not at all. This is usually assumed to be primarily due to depletion by dust. However, in some cases ionization effects may also play a role (e.g., Jenkins et al. 1998; Sofia & Jenkins 1998; Jenkins et al. 2000). In some cases, neutrals are included in the abundance estimate (e.g., both C I and C II are measured for the purpose of estimating [C/H]), but a larger error can result from the fact that (H I) can underestimate the total hydrogen density associated with a particular heavy element because the dominant ionization stage can exist in gas where the H is largely ionized. Sembach et al. (2000) have modeled the ionization of the “warm ionized medium”, but ionization corrections are often neglected in the ISM literature.999Ionization corrections are most substantial in low density clouds; in many Milky Way clouds the densities are high enough so that the corrections are likely to be small. With this in mind, we note that in interstellar gas in the disk, [Si/H] ranges from to (Sembach & Savage 1996) while Sofia et al. (1998) find [C/H] over a wide range of physical conditions. In the Galactic halo, Si depletion is reduced, e.g., Sembach & Savage (1996) find that [Si/H] ranges from to on halo sight lines. Depletion of carbon in halo gas has not been extensively studied.
The Galactic carbon and silicon abundances reported by Sofia et al. (1998) and Sembach & Savage (1996), respectively, are not derived from the same interstellar clouds, and it is not entirely clear how to combine the two samples to examine the [Si/C] abundance patterns that might result from depletion by dust. There are concerns about estimating [Si/C] trends from Si and C measurements in different clouds. For example, if dust destruction liberates silicon leading to the generally larger Si abundances in halo gas (see above), the same processes could increase the C abundances in the halo as well. Also, the overall metallicity of the ISM might not be constant, in which case the [Si/C] ranges derived by combining the results of Sofia et al. (1998) and Sembach & Savage (1996) could be misleading. To circumvent these issues, we have assembled in Table 3 a sample of interstellar clouds in which both Si II and C II have been reliably measured in the same cloud, including new measurements for two sight lines (see Appendix). We have limited this sample to measurements made with the highest resolution modes of GHRS and STIS (i.e., FWHM 3.5 km s-1) in order to minimize potential confusion due to unresolved saturation. From this table, we see that the majority of the clouds in this sample have [Si/C] 0.0. In four cases in Table 3, [Si/C] is consistent with the solar ratio or somewhat larger. However, in two of these four cases, the C II line approaches zero intensity in the line core, and (C II) could be underestimated due to unresolved saturation, as noted by Lehner et al. (2001) [all of the Si II measurements are unlikely to be underestimated due to saturation]. Increasing (C II) would decrease [Si/C]. The remaining two cases with high [Si/C] values (both from the DI 1388 sight line) are evidently uncertain; for these clouds Lehner et al. report rough measurements without error bars. It is also worth noting that there are tentative indications of element overabundances in some high-velocity clouds (e.g., Richter et al. 2001), and the high values of [Si/C] in the HVCs toward DI 1388 may be due to intrinsic Si overabundances. We conclude that the sample in Table 3 presents no compelling evidence that dust depletion could lead to a gas-phase silicon overabundance with respect to carbon. On the contrary, it seems likely that dust would produce an underabundance of Si in the gas phase.
| Sight Line | aaDistance to background star (see reference in column 8 for source). | Cloud | [Si/C]bbAll [Si/C] values from the literature have been recalculated assuming the Holweger (2001) solar abundances. Error bars include uncertainties in the solar reference abundances reported by Holweger (2001) as well as the uncertainties in the column density measurements. | CommentccComment: L = low density sight line within the “Local Bubble”, D = high density sight line, F = forbidden velocity cloud (i.e., velocity is outside of the expected range for normal Galactic rotation for this direction and background star distance), O = star is behind “Orion’s Cloak” (Cowie, Songaila, & York 1979), U = due to the substantial distance of the background star, the location of the absorption system is uncertain. Based on the observed velocities of Magellanic Bridge gas, these absorbers are more likely to be associated with the Milky Way than the Magellanic Bridge (Lehner et al. 2001). | ReferenceddColumn density measurements from: (1) Gry & Jenkins (2001), (2) Cardelli et al. (1993), (3) Cardelli et al. (1994), (4) Welty et al. (1999), (5) Howk, Savage, & Fabian (1999), (6) this paper (see Appendix), (7) Lehner, Keenan, & Sembach (2001). | ||
|---|---|---|---|---|---|---|---|
| (deg.) | (deg.) | (pc) | (km s-1) | ||||
| CMa……….. | 240 | 130 | L | 1 | |||
| Oph……….. | 6 | 24 | 138 | D | 2,3 | ||
| 23 Ori……….. | 199 | 295 | F,O | 4 | |||
| F,O | 4 | ||||||
| F,O | 4 | ||||||
| F,O | 4 | ||||||
| F,O | 4 | ||||||
| Col………… | 237 | 400 | F | 5 | |||
| 61 | eeThe C II absorption approaches the zero flux level in the core of the line, and (C II) could be underestimated due to saturation. Consequently, these measurements are most conservatively treated as upper limits. The upper limits are the nominal best values (and corresponding 1 uncertainties) from the original sources. | F | 5 | ||||
| HD116781A.. | 307 | 0 | 1900 | F | 6 | ||
| F | 6 | ||||||
| HD122879…. | 312 | 2 | 2400 | F | 6 | ||
| DI 1388……. | 291 | MBffThis star is located within the gaseous “Magellanic Bridge” between the Large Magellanic Cloud and the Small Magellanic Cloud. | 69 | eeThe C II absorption approaches the zero flux level in the core of the line, and (C II) could be underestimated due to saturation. Consequently, these measurements are most conservatively treated as upper limits. The upper limits are the nominal best values (and corresponding 1 uncertainties) from the original sources. | U | 7 | |
| 102 | +0.2ggColumn density uncertainties are not reported in the original reference. | U | 7 | ||||
| 119 | 0.0ggColumn density uncertainties are not reported in the original reference. | U | 7 |
4.2 Element Abundances
It is quite possible that silicon is intrinsically overabundant in the Virgo Ly cloud at = 0.00530, and that dust depletion affects the abundances by only a small amount if at all. This interpretation has interesting implications. It is well known that the group elements, including silicon, are overabundant relative to iron by roughly 0.3 dex in low metallicity stars in various locations in the Milky Way (Wheeler et al. 1989; McWilliam 1997, and references therein). Following Tinsley (1979), this is generally believed to indicate that the heavy element enrichment is dominated by the output from Type II supernovae (SN II). The nucleosynthetic origins of carbon are somewhat complex, and carbon abundance trends in stars are highly uncertain, but McWilliam (1997) notes that there are no compelling indications that C is overabundant (relative to Fe) in low-metallicity Galactic halo stars. Furthermore, some galactic chemical evolution models can produce overabundances of Si relative to C, with [Si/C] as high as 0.5 (e.g., Timmes et al. 1995). Therefore there is reason to expect [Si/C] 0.3 in low-metallicity objects such as this Virgo Ly cloud.
4.3 Nature of the Absorber at = 0.00530
There is also long-standing evidence that group elements are overabundant (with respect to iron) in the X-ray emitting hot intracluster medium (ICM) in several clusters including Virgo (e.g., Canizares et al. 1982; Mushotzky et al. 1996; Matsumoto et al. 1996). This has usually been ascribed to galactic winds driven predominantly by SN II (e.g., Loewenstein & Mushotzky 1996, but see the discussion of caveats in Gibson, Loewenstein, & Mushotzky 1997). More recent analyses have concluded that the Fe abundances increase in the central regions of several clusters while the group abundances remain more-or-less constant (e.g., Finoguenov, David, & Ponman 2000; Kaastra et al. 2001). This likely indicates that ejecta from Type Ia SN contribute to the ICM enrichment in the central regions where the cD and other old elliptical galaxies are located, but SN II ejecta from early “protogalactic” winds dominate the enrichment in the rest of the ICM. The sight line to 3C 273 is away (i.e., projected distance Mpc) from M87 and the X-ray emitting ICM in the Virgo cluster. Consequently, it is interesting that the Virgo Ly absorber at = 0.00530 also shows evidence of an overabundance of one of the elements. This may indicate that the early SN II winds affect a very broad region of the cluster, a region much more extended than the easily observed hot gas. This also has implications for the issues briefly noted in §1. For example, if the intergalactic gas within Virgo is enriched by dynamical processes such as ram-pressure stripping, the abundance patterns should reflect a significant contribution from SN Ia (Gunn & Gott 1972). The observation of SN II abundance patterns favors supernova driven winds as the source of enrichment. Furthermore, if the = 0.00530 absorber is a small blob entrained in the hot gas of a galactic wind, then the hotter wind gas could provide the pressure required to confine the absorber, as discussed in §3.1.
We note that analogous abundance trends have been observed in other contexts in low- and high-redshift absorption systems. For example, Richter et al. (2001) have measured abundances in the high-velocity cloud (HVC) Complex C near the Milky Way using absorption lines detected in the spectrum of PG1259+593 and a well-constrained COG. They report [O/H] = , [Si/H] = , and [Fe/H] = . It is interesting to note the overabundance (albeit marginal) of the group elements O and Si with respect to Fe in this object which, based on its large angular extent, is probably relatively close to the Galaxy ( 10 kpc; Wakker et al. 1999). In this case the abundance trends could be entirely due to dust, which depletes iron more strongly than O and Si and can thereby mimic overabundances. The Virgo absorber at = 0.00530 could be analogous to this HVC, although its H I column density is substantially lower.
There is also evidence of group overabundances in high-redshift damped Ly absorption systems (e.g., Lu et al. 1995, 1996; Prochaska & Wolfe 1999). In comparisons of this Virgo Ly absorber to higher redshift systems, it is important to note that low and high absorbers with the same (H I) are probably not dynamically equivalent. In cosmological simulations, a Ly system with a given column density at 0 has the same overdensity as a system at 3 with a larger (H I) by a factor of 50 (Davé et al. 1999). Therefore this Virgo Ly absorber may be more analogous to a Lyman limit system at high redshift.
However, damped Ly and Lyman limit absorbers are generally thought to be associated with individual galaxies. Despite its location within the Virgo supercluster (or perhaps because of this), it is difficult to attribute the = 0.00530 system to such a galaxy. After the Virgo Ly absorbers in the 3C 273 spectrum were discovered (Morris et al. 1991; Bahcall et al. 1991), several studies of the relationships between these systems and galaxies were carried out making use of galaxy redshift measurements (Salzer 1992; Morris et al. 1993; Hoffman, Lewis, & Salpeter 1995; Salpeter & Hoffman 1995; Bowen, Blades, & Pettini 1996; Grogin & Geller 1998; Impey, Petry, & Flint 1999; Penton, Stocke, & Shull 2000, 2002), deep optical imaging (Morris et al. 1993; Rauch, Weymann, & Morris 1996) and 21cm imaging (van Gorkom et al. 1993). Despite these intensive searches with good sensitivity to faint and low surface-brightness galaxies, no galaxies have been found with impact parameter less than 100 kpc near the redshift of the = 0.00530 absorber. Damped Ly and Lyman limit absorbers are generally believed to have cross sections significantly smaller than 100 kpc (e.g., Steidel 1993).
There are some known galaxies near = 0.00530 with 100 kpc (see Table 1 of Salpeter & Hoffman 1995 as well as Grogin, Geller, & Huchra 1998). For example, as noted by Salzer (1992), UGC 7549 (NGC 4420) is within 100 km s-1 of this absorption system with kpc. UGC 7549 is notable only because it is the brightest galaxy in the vicinity of 3C 273; in other respects it appears to be an ordinary spiral galaxy. However, there are at least two other galaxies at similar projected distances and velocity separations: UGC 7612 ( kpc, km s-1) and the low surface brighness galaxy UGC 7642 ( kpc, = 50 km s-1). H I 1225+01 is at a somewhat larger, but still plausible, velocity separation ( kpc, km s-1). H I 1225+01 is a large cloud of H I detected in 21cm emission (Giovanelli & Haynes 1989), part of which envelops a small dwarf galaxy (Salzer et al. 1991). This object is intriguing because the H I envelope has a complex, two-component morphology, and the dwarf galaxy shows regions of active star formation (Giovanelli, Williams, & Haynes 1991). This is the type of galaxy that may be able drive a wind with which the = 0.00530 system could be associated (see Heckman et al. 2001 for an observational example of such a wind).101010However, we note that mechanisms have been proposed (e.g., Binney 2001) which would drive winds from luminous larger galaxies such as UGC 7549. Theuns, Mo, & Schaye (2001) have suggested that dwarf galaxy winds “may break up into clouds, which coast to large distances [300 kpc] without sweeping up a significant fraction of the IGM.” The small size and mass derived for the = 0.00530 Ly cloud is qualitatively consistent with this suggestion, and as noted above, a small cloud entrained in a wind could be naturally pressure confined. However, while it is tempting to assign the gas in this absorber to one of these galaxies, we see no clear method to determine which one, if any, is the correct assignment. Given the complex velocity field within the Virgo cluster, it remains possible that some of these galaxies are interlopers, i.e., the three-dimensional distances from the Ly cloud to the galaxies are larger than implied by their velocity differences. Furthermore, there is evidence that the two 3C 273 absorbers in Virgo and their nearest galaxies are part of a large-scale filament (Penton et al. 2001), in which case the absorption line system may not be associated with any particular galaxy but rather is part of the general intragroup gas.
Lacking a specific galaxy to which this absorption system can clearly be assigned, it is interesting to consider whether this Virgo absorber might be a relatively pristine gas cloud that has only been enriched by a putative first generation of stars, i.e., the “Population III” stars (e.g., Qian, Sargent, & Wasserburg 2002). Using the Population III yields calculated by Heger & Woosley (2002), Oh et al. (2001) have argued that explosions of the first very massive stars could produce overabundances of group elements with respect to carbon, exactly as observed in the Virgo Ly cloud. However, Oh et al. (2001) have also shown that while there is evidence of Pop III enrichment in low-metallicity stars with , at higher metallicities enrichment from normal stars appears to be dominant. Therefore the metallicity derived for the Virgo absorber (see §3) appears to be too high to be consistent with this hypothesis.
4.4 Warm/Hot Gas in Virgo
In the process of constraining the oxygen abundance in the Virgo O VI/Ly absorber at = 0.00337, we have explored the physical conditions of this system (§3.2). We now briefly comment on these physical condition constraints. Based on hydrodynamic simulations of cosmological structure growth, it has been suggested that at the present epoch, 30-50% of the baryons are in low-density, shocked gas at K, the so-called “warm/hot intergalactic medium” (Cen & Ostriker 1999a; Davé et al. 2001). Lithium-like O VI is useful for probing such gas since its ion fraction is maximized at K in collisionally ionized gas (see Figure 8), and low O VI absorbers do harbor a substantial quantity of baryons (Tripp, Savage, & Jenkins 2000; Savage et al. 2002). However, the nature of O VI absorbers is not yet clear. Are these systems collisionally ionized or photoionized? Do they arise in unvirialized, large-scale filaments (as predicted by the cosmological simulations, see Cen et al. 2001; Fang & Bryan 2001), higher density galaxy groups (Mulchaey et al. 1996), individual galaxies, or galactic winds?
The 3C 273 O VI-Ly absorber at = 0.00337 provides some interesting clues. The absorption line properties are consistent with expectations for collisionally ionized, warm-hot intergalactic gas at K. As Ly systems go, this absorber is located in a region of relatively high galaxy density (Grogin & Geller 1998). Given the low O VI equivalent width, this absorber may not be located in the typical low- overdensity environment expected based on the cosmological simulations (see, e.g., Figure 4 in Cen et al. 2001), but this is only one case, and it is quite likely that analogous O VI systems can be found in the simulations. Like the = 0.00530 system, there are no galaxies very near the sight line at = 0.00337 (Hoffman et al. 1998, and references therein), and it is not clear whether or not this absorber is in a virialized region. Additional galaxy redshift measurements currently underway (K. McLin et al., in preparation) will help illuminate the nature of this absorption system. Other O VI absorbers at higher redshifts have line properties similar to the = 0.00337 system, e.g., similar lower limits on O VI/C IV and evidence of broad components in the Ly profiles (e.g., Tripp & Savage 2000; Tripp et al. 2001; Savage et al. 2002). It is interesting to note that in all of these absorbers, the broad H I lines are juxtaposed with at least one narrow H I line. This might be expected if the broad-component gas was shock-heated as high-velocity gas collided with the lower-ionization gas that gives rise to the observed narrow component. On the other hand, if the broad H I component is due to Hubble broadening over a long pathlength (as may be required if the O VI is photoionized, see Tripp et al. 2001), then there is no particular reason to expect the observed correspondence between the broad and narrow H I lines. The 3C 273 O VI system at = 0.00337 is particularly valuable for understanding these absorbers because the low redshift allows an intensive investigation of the absorber environment, and because the QSO is the brightest known.
5 Summary
We have obtained good constraints on the abundances of carbon and silicon in a Ly absorption system at = 0.00530 in the spectrum of 3C 273; this absorber is located within the southern extension of the Virgo cluster. Based on ionization modeling, we find that the carbon abundance in the gas phase is roughly 1/15 of the solar abundance, and Si, an element, is overabundant relative to C by 0.2 dex. The H density is cm-3, the absorber thickness is 70 pc, and the gas pressure 40 cm-3 K. The small line-of-sight thickness suggests that the absorber is pressure confined by an external medium or is out of equilbrium and will soon expand or evaporate (a self-gravitating cloud would require a remarkably high dark matter to baryon ratio). The Si overabundance is probably not due to dust depletion. Instead, this likely reflects an intrinsic abundance pattern. Overabundances of group elements have been observed in the hot X-ray emitting gas in the Virgo cluster, and these abundance patterns are believed to be produced by galactic winds containing predominantly SN II ejecta. We favor such an explanation for this 3C 273 absorber as well because there are no galaxies particularly nearby, as might be expected in other scenarios, but there are galaxies at projected distances of 200 kpc which could plausibly drive an escaping wind. The projected distance from the 3C 273 sight line to the region detected in X-rays is 3 Mpc, and therefore the putative SN II winds may be widespread in the Virgo cluster. If this result is found for other sight lines, SN II winds, perhaps “protogalactic” winds, may not be unique to the central regions of clusters and may in fact be a general phenomenon in galaxies. Detections of other heavy elements in this absorber will require substantial improvements in the S/N of the spectrum (at the same resolution). Perhaps the most promising transition to search for in future observations is the strongest Fe II transition at 2382.8 Å.
We have also estimated the metallicity of the Ly/O VI absorber at = 0.00337 in the 3C 273 spectrum. We obtain [O/H] from photoionized as well as collisionally ionized models. If the gas is collisionally ionized, then the lower limit on the O VI/C IV ratio requires K in the O VI phase.
Several other sight lines to QSOs behind the Virgo supercluster have recently been observed or will be observed during the next year with the STIS E140M echelle mode. For example, it will be useful to examine the sight line to RXJ1230.8+0115 (Read, Miller, & Hasinger 1998), which is only 54’ from 3C 273. These nearby sight lines will likely provide additional valuable constraints on the heavy element enrichment of the IGM.
Appendix A Measurements of (C II) and (Si II) in High-Velocity Milky Way Gas in the Directions of HD116781A and HD122879
As discussed in §4, there are relatively few Galactic interstellar clouds in which the Si II and C II column densities have both been reliably measured. This is primarily because (C II) is difficult to measure in the Milky Way ISM; the C II resonance transitions are usually very badly saturated, and when the spin-changing C II] 2325 line is detectable, the corresponding Si II resonance transitions are strongly saturated. There is a spin-changing Si II] transition at 2335 Å that can be observed when the C II] 2325 line is detected. However, detection of these semiforbidden transitions is challenging, and they have mainly been observed in sight lines such as Oph through relatively dense clouds.
The recent high-resolution survey of interstellar C I absorption lines carried out by Jenkins & Tripp (2001) has fortuitously revealed a few additional high-velocity interstellar clouds in the spectra of two stars, HD116781A and HD122879, in which (C II) and (Si II) can both be accurately measured. The continuum-normalized C II and Si II absorption profiles of these high-velocity features are shown in Figure 10. Due to the very high resolution of the spectra (), it is unlikely that these high-velocity lines are affected by unresolved saturation. Consequently, we can obtain reliable column density measurements. In the direction of HD116781A, at least two components are readily apparent in the high velocity gas. To deblend these components and obtain their individual column densities, we have used the profile- fitting software of Fitzpatrick & Spitzer (1997) with the line-spread function for this slit from the STIS Handbook. The heliocentric velocities, Doppler parameters, and column densities obtained in this way are summarized in Table 4. Table 3 reports the [Si/C] values derived from these column densities. There may be evidence of additional components in these profiles, but these additional components are not sufficiently well-constrained to justify addition of more lines to the fits. We note that due to the weakness of the line, the wings of the Si II profile in the HD122879 spectrum might be lost in the noise. This could lead to underestimates of the value and (Si II) in this cloud. Based on apparent column density ratios and fits to the Si II line forced to take on larger values, we estimate that log (Si II) might be underestimated by 0.2 dex. The error bars in Table 3 reflect this source of uncertainty.
A full discussion of the nature of these high-velocity features is beyond the scope of this paper. However, a few comments are in order. (1) The absorption lines occur at velocities well outside the velocity range expected for normal Galactic rotation in these directions (see Table 2 in Jenkins & Tripp 2001), i.e., these are “forbidden-velocity” clouds. (2) The [Si/C] abundances derived from the two high-velocity components toward HD116781A are quite similar (and consistent with the same value within the 1 uncertainties; see Table 3), but there are large differences in [Si/C] toward HD116781A and HD122879 at km s-1 (see Table 3). It seems unlikely that these differences are due to intrinsic changes in the interstellar abundances given the spatial separation between the sight lines (190 pc at the estimated distance of HD116781A). As discussed in §4, it is possible that some of the differences in [Si/C] are driven by ionization. The differences between the HD116781A and HD122879 sight lines are dramatic; (C II) is only 0.3 dex smaller toward HD122879, but the Si II column density is reduced by an order of magnitude. Based on the modeling of Sembach et al. (2000), such large changes cannot be attributed to ionization effects if the gas is predominantly photoionized. However, this could occur if the gas is predominantly collisionally ionized (see Sutherland & Dopita 1993) and the gas temperature exceeds 15,000 K. This would not be surprising since these clouds may well be shock-heated, given their large departures from normal Galactic rotation. In addition, some of the differences in [Si/C] between the sight lines may be due to more substantial dust grain destruction in the direction of HD116781A. This could occur if silicon is incorporated into more fragile portions of dust grains while C is locked into more resilient dust components.
| Sight Line | Transition | (km s-1)a,ba,bfootnotemark: | (km s-1)aaDoppler parameter, component velocity, and column density measured using the profile-fitting software of Fitzpatrick & Spitzer (1997). Uncertainties in this table only include random errors estimated by the profile-fitting code; systematic sources of uncertainty such as continuum placement are not included in these error bars. | log aaDoppler parameter, component velocity, and column density measured using the profile-fitting software of Fitzpatrick & Spitzer (1997). Uncertainties in this table only include random errors estimated by the profile-fitting code; systematic sources of uncertainty such as continuum placement are not included in these error bars. |
|---|---|---|---|---|
| HD116781A.. | C II | 13.680.01 | ||
| Si II | 12.100.02 | |||
| C II | 13.420.02 | |||
| Si II | 11.740.03 | |||
| HD122879…. | C II | 13.400.01 | ||
| Si II | 11.120.08 |


References
- (1) Aguirre, A., Hernquist, L., Schaye, J., Katz, N., Weinberg, D. H., & Gardner, J. 2001, 561, 521
- (2) Arnaud, M., & Rothenflug, R. 1985, A&AS, 60, 425
- (3) Bahcall, J. N., Jannuzi, B. T., Schneider, D. P., Hartig, G. F., Bohlin, R., & Junkkarinen, V. 1991, ApJ, 377, L5
- (4) Barkana, R., & Loeb, A. 1999, ApJ, 523, 54
- (5) Binggeli, B., Popescu, C. C., & Tammann, G. A. 1993, A&AS, 98, 275
- (6) Binney, J. 2001, in Gas and Galaxy Evolution, ASP Conf. Proc. 240, eds. J. E. Hibbard, M. Rupen, & J. H. van Gorkom (San Fracisco: ASP), 355
- (7) Bowen, D. V., Blades, J. C., & Pettini, M. 1996, ApJ, 464, 141
- (8) Borkowski, K. J., Balbus, S. A., & Fristrom, C. C. 1990, ApJ, 355, 501
- (9) Brandt, J. C., et al. 1997, AJ, 114, 554
- (10) Canizares, C. R., Clark, G. W., Jernigan, J. G., Markert, T. H. 1982, ApJ, 262, 33
- (11) Cardelli, J. A., Mathis, J. S., Ebbets, D. C., & Savage, B. D. 1993, ApJ, 402, L17
- (12) Cardelli, J. A., Sofia, U. J., Savage, B. D., Keenan, F. P., & Dufton, P. L. 1994, ApJ, 420, L29
- (13) Cen, R., & Bryan, G. L. 2001, ApJ, 546, L81
- (14) Cen, R., & Ostriker, J. P. 1999a, ApJ, 514, 1
- (15) Cen, R., & Ostriker, J. P. 1999b, ApJ, 519, L109
- (16) Cen, R., Tripp, T. M., Ostriker, J. P., & Jenkins, E. B. 2001, ApJ, 559, L5
- (17) Cowie, L. L., Songaila, A., Kim, T.-S., & Hu, E. 1995, AJ, 109, 1522
- (18) Cowie, L. L., Songaila, A., & York, D. G. 1979, ApJ, 230, 469
- (19) Davé, R., et al. 2001, ApJ, 552, 473
- (20) Davé, R., Hernquist, L., Katz, N., & Weinberg, D. H. 1999, ApJ, 511, 521
- (21) Davé, R., & Tripp, T. M. 2001, ApJ, 553, 528
- (22) de Vaucouleurs, G. 1961, ApJS, 6, 213
- (23) Ellison, S. L., Songaila, A., Schaye, J., & Pettini, M. 2000, AJ, 120, 1175
- (24) Fang, T., & Bryan, G. L. 2001, ApJ, 561, L31
- (25) Ferland, G. J., Korista, K. T., Verner, D. A., Ferguson, J. W., Kingdon, J. B., & Verner, E. M. 1998, PASP, 110, 761
- (26) Ferrara, A., Pettini, M., Shchekinov, Y. 2000, MNRAS, 319, 539
- (27) Finoguenov, A., David, L. P., & Ponman, T. J. 2000, ApJ, 544, 188
- (28) Fitzpatrick, E. L., & Spitzer, L. 1997, ApJ, 475, 623
- (29) Gibson, B. K., Loewenstein, M., & Mushotzky, R. F. 1997, MNRAS, 290, 623
- (30) Giovanelli, R., & Haynes, M. P. 1989, ApJ, 346, L5
- (31) Giovanelli, R., Williams, J. P., & Haynes, M. P. 1991, AJ, 101, 1242
- (32) Grogin, N. A., & Geller, M. J. 1998, ApJ, 505, 506
- (33) Grogin, N. A., Geller, M. J., & Huchra, J. P. 1998, ApJS, 119, 277
- (34) Gry, C., & Jenkins, E. B. 2001, A&A, 367, 617
- (35) Gunn, J. E., & Gott, J. R. 1972, ApJ, 176, 1
- (36) Haardt, F., & Madau, P. 1996, ApJ, 461, 20
- (37) Heckman, T. M., Sembach, K. R., Meurer, G. R., Strickland, D. K., Martin, C. L., Calzetti, D., & Leitherer, C. 2001, ApJ, 554, 1021
- (38) Heger, A., & Woosley, S. E. 2002, ApJ, 567, 532
- (39) Hoffman, G. L., Lewis, B. M., & Salpeter, E. E. 1995, ApJ, 441, 28
- (40) Hoffman, G. L., Lu, N. Y., Salpeter, E. E., Connell, B. M., & Fromhold-Treu, R. 1998, ApJ, 500, 789
- (41) Holweger, H. 2001, in Joint SOHO/ACE Workshop: Solar and Galactic Composition, ed. R. F. Wimmer-Schweingruber, American Institute of Physics Conf. Proceedings 598, 23
- (42) Howk, J. C., Savage, B. D., & Fabian, D. 1999, ApJ, 525, 253
- (43) Hurwitz, M., Appenzeller, I., Barnstedt, J., et al. 1998, ApJ, 500, L61
- (44) Impey, C. D., Petry, C. E., & Flint, K. P. 1999, ApJ, 524, 536
- (45) Jenkins, E. B., et al. 1998, ApJ, 492, L147
- (46) Jenkins, E. B., et al. 2000, ApJ, 538, L81
- (47) Jenkins, E. B., & Tripp, T. M. 2001, ApJS, 137, 297
- (48) Kaastra, J. S., Ferrigno, C., Tamura, T., Paerels, F. B. S., Peterson, J. R., & Mittaz, J. P. D. 2001, A&A, 365, L99
- (49) Kaiser, N. 1991, ApJ, 383, 104
- (50) Kerr, F. J., & Lynden-Bell, D. 1986, MNRAS, 221, 1023
- (51) Kimble, R. A., et al. 1998, ApJ, 492, L83
- (52) Klypin, A., Kravtsov, A. V., Valenzuela, O., & Prada, F. 1999, ApJ, 522, 82
- (53) Lehner, N., Keenan, F. P., & Sembach, K. R. 2001, MNRAS, 323, 904
- (54) Leitherer, C., et al. 2001, STIS Instrument Handbook, Version 5.1 (Baltimore:STScI)
- (55) Loewenstein, M., & Mushotzky, R. F. 1996, ApJ, 466, 695
- (56) Lu, L., Sargent, W. L. W., Barlow, T. A., Churchill, C. W., & Vogt, S. S. 1996, ApJS, 107, 475
- (57) Lu, L., Savage, B. D., Tripp, T. M., & Meyer, D. M. 1995, ApJ, 447, 597
- (58) Mac Low, M.-M., & Ferrara, A. 1999, ApJ, 513, 142
- (59) Matsumoto, H., Koyama, K., Awaki, H., Tomida, H., Tsuru, T., Mushotzky, R., & Hatsukade, I. 1996, PASJ, 48, 201
- (60) Mazzotta, P., Mazzitelli, G., Colafrancesco, S., & Vittorio, N. 1998, A&AS, 133, 403
- (61) McWilliam, A. 1997, ARA&A, 35, 503
- (62) Morris, S. L., Weymann, R. J., Savage, B. D., & Gilliland, R. L. 1991, ApJ, 377, L21
- (63) Morris, S. L., Weymann, R. J., Dressler, A., McCarthy, P. J., Smith, B. A., Terrile, R. J., Giovanelli, R., & Irwin, M. 1993, ApJ, 419, 524
- (64) Morton, D. C. 1991, ApJS, 77, 119
- (65) Morton, D. D. 2002, in preparation
- (66) Mulchaey, J. S., Mushotzky, R. F., Burstein, D., Davis, D. S. 1996, ApJ, 456, L5
- (67) Mushotzky, R. F., Loewenstein, M., Arnaud, K. A., Tamura, T., Fukazawa, Y., Matsushita, K., & Kikuchi, K. 1996, ApJ, 466, 686
- (68) Oh, S. P., Nollett, K. M., Madau, P., & Wasserburg, G. J. 2001, ApJ, 562, L1
- (69) Penton, S. V., Stocke, J. T., & Shull, J. M. 2000, ApJS, 130, 121
- (70) Penton, S. V., Stocke, J. T., & Shull, J. M. 2002, ApJ, 565, 720
- (71) Ponman, T. J., Cannon, D. B., & Navarro, J. F. 1999, Nature, 397, 135
- (72) Prochaska, J. X., & Wolfe, A. M. 1999, ApJS, 121, 369
- (73) Qian, Y.-Z., Sargent, W. L. W., & Wasserburg, G. J. 2002, ApJL, 569, L61
- (74) Rauch, M., Weymann, R. J., & Morris, S. L. 1996, ApJ, 458, 518
- (75) Read, M. A., Miller, L., & Hasinger, G. 1998, A&A, 335, 121
- (76) Richter, P., Sembach, K. R., Wakker, B. P., Savage, B. D., Tripp, T. M., Murphy, E. B., Kalberla, P. M. W., & Jenkins, E. B. 2001, ApJ, 559, 318
- (77) Rigby, J. R., Charlton, J. C., & Churchill, C. W. 2002, ApJ, 565, 743
- (78) Salpeter, E. E., & Hoffman, G. L. 1995, ApJ, 441, 51
- (79) Salzer, J. J., di Serego Alighieri, S., Matteucci, F., Giovanelli, R., & Haynes, M. P. 1991, AJ, 101, 1258
- (80) Salzer, J. J. 1992, AJ, 103, 385
- (81) Savage, B. D., & Sembach, K. R. 1991, ApJ, 379, 245
- (82) Savage, B. D., Sembach, K. R., Tripp, T. M., & Richter, P. 2002, ApJ, 564, 631
- (83) Schaye, J. 2001, ApJ, 559, 507
- (84) Schaye, J., Rauch, M., Sargent, W. L. W., & Kim, T.-S. 2000, ApJ, 541, L1
- (85) Schmutzler, T., & Tscharnuter, W. M. 1993, A&A, 273, 318
- (86) Scott, J., Bechtold, J., Morita, M., Dobrzycki, A., & Kulkarni, V. P. 2002, ApJ, 571, 665 (astro-ph/0112229)
- (87) Sembach, K. R., Howk, J. C., Ryans, R. S. I., & Keenan, F. P. 2000, ApJ, 528, 310
- (88) Sembach, K. R., Howk, J. C., Savage, B. D., Shull, J. M., & Oegerle, W. R. 2001, ApJ, 561, 573
- (89) Sembach, K. R., & Savage, B. D. 1992, ApJS, 83, 147
- (90) Sembach, K. R., & Savage, B. D. 1996, ApJ, 457, 211
- (91) Sembach, K. R., Savage, B. D., & Tripp, T. M. 1997, ApJ, 480, 216
- (92) Shapiro, P. R., & Moore, R. T. 1976, ApJ, 207, 460
- (93) Shull, J. M., Roberts, D., Giroux, M. L., Penton, S. V., & Fardal, M. A. 1999, AJ, 118, 1450
- (94) Shull, J. M., & van Steenberg, M. 1982, ApJS, 48, 95
- (95) Slavin, J. D., Shull, J. M., & Begelman, M. C. 1993, ApJ, 407, 83
- (96) Snow, T. P., & Witt, A. N. 1996, ApJ, 468, L65
- (97) Sofia, U. J., Cardelli, J. A., & Savage, B. D. 1994, ApJ, 430, 650
- (98) Sofia, U. J., Fitzpatrick, E. L., & Meyer, D. M. 1998, ApJ, 504, L47
- (99) Sofia, U. J., & Jenkins, E. B. 1998, ApJ, 499, 951
- (100) Steidel, C. C. 1993, in The Environment and Evolution of Galaxies, ed. J. M. Shull & H. A. Thronson, Jr. (Dordrecht: Kluwer), 263
- (101) Sutherland, R. S., & Dopita, M. A. 1993, ApJS, 88, 253
- (102) Theuns, T., Mo, H. J., & Schaye, J. 2001, MNRAS, 321, 450
- (103) Timmes, F. X., Woosley, S. E., & Weaver, T. A. 1995, ApJS, 98, 617
- (104) Tripp, T. M., Giroux, M. L., Stocke, J. T., Tumlinson, J., & Oegerle, W. R. 2001, ApJ, 563, 724
- (105) Tripp, T. M., & Savage, B. D. 2000, ApJ, 542, 42
- (106) Tripp, T. M., Savage, B. D., & Jenkins, E. B. 2000, 534, L1
- (107) Tytler, D., Fan, X.-M., Burles, S., Cottrell, L., Davis, C., Kirkman, D., & Zuo, L. 1995, in QSO Absorption Lines, ed. G. Meylan (Garching: ESO), 289
- (108) van Gorkom, J. H., Bahcall, J. N., Jannuzi, B. T., & Schneider, D. P. 1993, AJ, 106, 2213
- (109) Voit, G. M., & Bryan, G. L. 2001, Nature, 414, 425
- (110) Wakker, B. P. et al. 1999, Nature, 402, 388
- (111) Welty, D. E., Hobbs, L. M., Lauroesch, J. T., Morton, D. C., Spitzer, L., & York, D. G. 1999, ApJS, 124, 465
- (112) Weymann, R., Rauch, M., Williams, R., Morris, S., & Heap, S. 1995, ApJ, 438, 650
- (113) Weymann, R. J., Vogel, S. N., Veilleux, S., & H. W. Epps 2001, ApJ, 561, 559
- (114) Wheeler, J. C., Sneden, C., & Truran, J. W. 1989, ARA&A, 27, 279
- (115) Woodgate, B. E., et al. 1998, PASP, 110, 1183