Discovery of two infrared supernovae:
a new window on the SN
search††thanks: Based on observations obtained at the ESO-NTT in
La Silla, at the ESO-VLT in Paranal and at
the Italian Telescopio
Nazionale Galileo (TNG) operated on the island of La Palma by the Centro
Galileo Galilei of the CNAA (Consorzio Nazionale per l’Astronomia e
l’Astrofisica) at the Spanish Observatorio del
Roque de los Muchachos of the Instituto de Astrofisica de Canarias.
We report the discovery of two supernovae (SN 1999gw and SN 2001db) obtained within the framework of an infrared (2.1m) monitoring campaign of Luminous Infrared Galaxies, aimed at detecting obscured supernovae. SN 2001db, extinguished by mag, is the first supernova discovered in the infrared which has received the spectroscopic confirmation. This result highlights the power of infrared monitoring in detecting obscured SNe and indicates that optical surveys are probably missing a significant fraction of SNe, especially in obscured systems such as starburst galaxies. The preliminary estimate of SN rate in LIRG galaxies is about an order of magnitude higher than that expected from optical surveys.
Key Words.:
supernovae: general – supernovae: individual: SN2001db, SN1999gw – Galaxies: starburst – Infrared: galaxies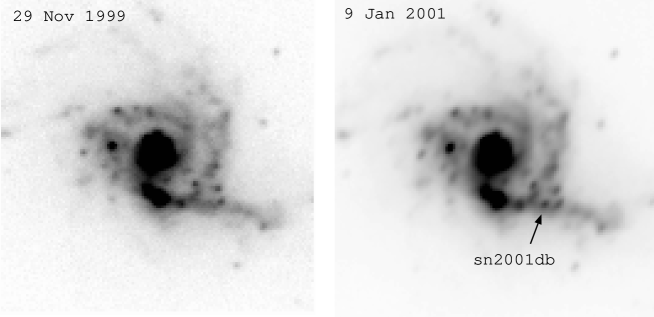

1 Introduction
Some recent surveys aimed at detecting SNe (in the optical) have found that starburst galaxies do not show evidence for an enhanced SN rate, when the rate is normalized to the B luminosity of the galaxies, i.e. starburst and quiescent have the same SN rate in terms of SNu111 (Richmond et al. richmond (1998)). This result is puzzling, since the presence of a burst of star formation should boost the SN rate much more than the optical luminosity (in addition to the fact that the optical luminosity is diluted by the quiescent, evolved stellar population). One possible explanation for the shortage of SNe in star forming galaxies is that most SNe are obscured by the large amount of dust which generally affects starburst systems. In the following we will focus on the latter scenario.
A survey for SNe in the infrared, where dust extinction is greatly reduced, would allow one to detect the obscured SNe which are possibly missed in optical monitoring campaigns. This strategy was first proposed by Van Buren & Norman (vanb89 (1989)) and discussed more recently also by Mattila & Meikle (mattila (2000)). The first K-band (2.2m) monitoring campaign was attempted by Van Buren et al. (vanb94 (1994)). They discovered SN1992bu by comparing four near-IR images of NGC3690 (this SN was not confirmed spectroscopically). More recently, a search in the K′-band was attempted by Grossan et al. (grossan (1999)); they failed in detecting any new SN and they ascribe their negative result to the poor resolution of their camera.
We started a K′-band (m) monitoring campaign of a sample of Luminous Infrared Galaxies (LIRGs) aimed at detecting obscured SNe elusive in optical surveys. LIRGs are galaxies characterized by far-IR (FIR) luminosities in excess of . According to optical and IR studies the main energy source of this class of objects seems to be starburst activity, at least up to luminosities of (e.g. Sanders & Mirabel sanders (1996), Genzel et al. genzel (1998)). The contribution to the IR luminosity from hidden active galactic nuclei (AGNs) is matter of debate. However, if most of their luminosity is powered by star formation, then the inferred star formation activity would imply an average rate of about one SN per year per object, within our sample (Mattila & Meikle mattila (2000)).
The survey, started in late 1999, was carried on with the NTT-ESO, TNG222The Italian Galileo National Telescope and Kuiper/Steward333University of Arizona telescopes. In this paper we report the discovery of two infrared SNe: SN2001db (Maiolino et al. maiolino01 (2001)) and SN1999gw (Cresci et al. cresci (2002)), and provide a preliminary estimate of the SN production in Luminous Infrared Galaxies. A more detailed description of our survey and more accurate estimate of SN rate will be given in a forthcoming paper (Mannucci et al. in prep.).
2 SN2001db
2.1 Observations
2.1.1 Imaging
The infrared imaging observations were obtained with SOFI, the near-IR camera (Lidman et al. lidman (2000)) at the NTT ESO telescope, in the Ks band (see Tab.1). NGC3256 was observed for the first time on January 9, 2001, and subsequently three more times: February 8, March 18, and April 1. Each observation consisted of a series of 15 images, 60 seconds each, alternated with 15 images sampling the near sky for an optimal removal of the background. The total on-source integration time was therefore 15 minutes per epoch, obtained under sub-arcsec seeing conditions. The data reduction was carried out with a “home” package developed by our team (Hunt et al. hunt94 (1994)). The images obtained during the monitoring in 2001 were compared with an archival image obtained with SOFI on November 28, 1999.
In Fig.1 we show the archival SOFI image of NGC3256 (left) and the first image obtained in 2001 (right) where SN2001db has been detected. The magnitude of the SN at the discovery epoch was Ks= 444The difference with respect to the magnitude given in Maiolino et al. (maiolino01 (2001)) is due to a better subtraction of the background light.. The SN is located at R.A.(J2000) = 10h27m50s.4, Decl.(J2000) = –43 54′ 21′′, i.e. offset 5′′.7 to the West and 5′′.7 to the South of the Ks nucleus of the galaxy (uncertainty on the relative position about 0′′.4). In Tab.2 and in Fig.2 (upper panel) we give the Ks-band light curve, both in terms of relative and absolute magnitude (assuming a distance modulus of 33.06).
Photometric measurements performed on ESO archival images (Feb 1993) and FORS images (Apr 2001, May 2001) imply m22 for the SN (Fig.2 lower panel).
2.2 Optical spectroscopy
The spectroscopic follow-up was performed both in the optical and in the infrared.
The optical spectrum was obtained with FORS1 (Szeifert szeifert (2002)) at the ESO VLT-UT1 on May 16, 2001 (i.e. when the SN was at least 4 months old) with the grism GRIS_300V and a spectral resolution of 500. The 15m exposure was split in two different integrations, to allow an optimum subtraction of cosmic rays. Background was removed by interpolating the spectrum above and below the galaxy (after standard flat-fielding and bias subtraction).
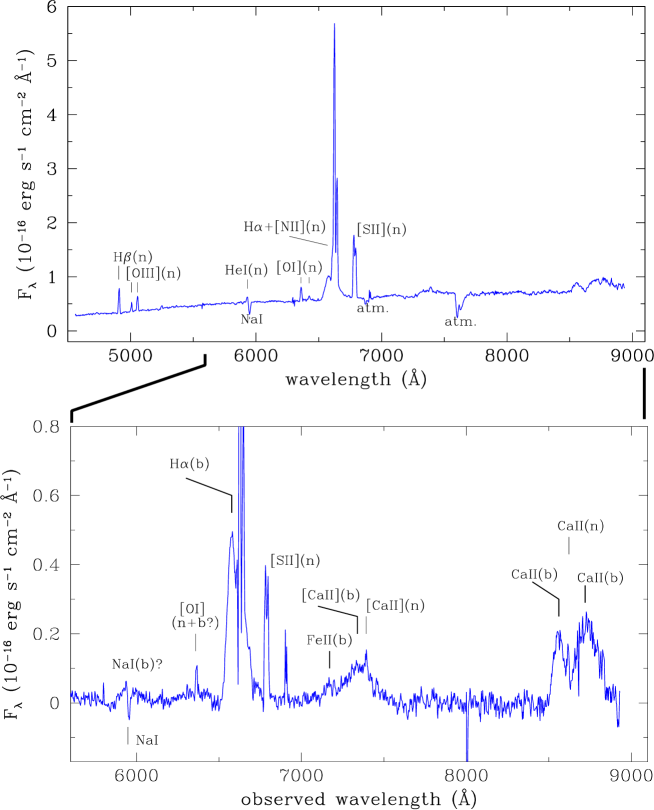
Fig.3 (upper panel) shows the optical spectrum of the SN2001db. There are several narrow emission lines most of which are probably to ascribe to HII regions and SNRs in the environment of SN2001db. As mentioned above, the continuum is not due to the SN2001db but is dominated by background emission from the host galaxy. The spectrum clearly shows a broad component of H (FWHM 5000 km/s) which is a clear signature of the SN. The signatures of the SN are better observed if the contribution of the the underlying background continuum is removed (by using as a template the contiguous regions of the galaxy intercepted by the slit and properly re-scaled). The resulting spectrum is shown in Fig.3 (lower panel). The H has a strongly asymmetric profile, whose peak is blueshifted by about 2000 km/s with respect to the parent galaxy (see Schlegel schlegel (1990) for a discussion on the blueshift), but it also has a prominent red tail, a profile similar to that observed in type IIL and IIP SNe (Filippenko filippenko (1997)). No other SN signatures are found in the blue part of the spectrum. A summary of the properties of all the broad lines associated to the SN is given in Tab. 2. We note that the profile of the broad component of [Ca II] 7324Å and CaII 8662Å is not as asymmetric as the other broad lines. At the same redshift of the peak of the broad H we have also detected the FeII 7155Å line.
2.3 Infrared spectroscopy
The infrared spectrum was obtained in the J band with ISAAC (Cuby et al. cuby (2002)) at the ESO VLT-UT1 on April 21, 2001. Observations were performed with the slit and with the low resolution grating (set at the 4th order), giving a spectral resolution of 500. The observations were obtained with a set of single integrations of 30 seconds each (10 times 3 sec), by moving the object along the slit to obtain an optimal sky subtraction, for a total of 45 minutes of integration. Finally, the spectra obtained at different positions along the slit, were subtracted from each other to remove the background, then flat fielded, aligned, co-added and calibrated. The atmospheric trasmission features were corrected as described in Maiolino et al. (maiolino96 (1996)).
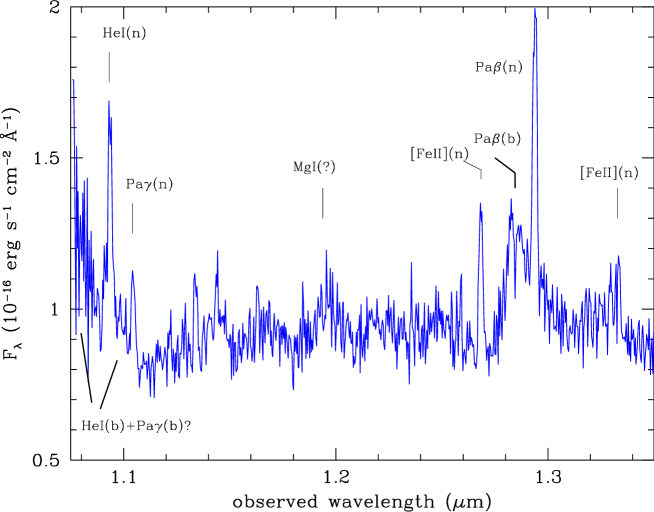
Fig.4 shows the infrared ISAAC spectrum extracted from an aperture of 1′′. Here the broad component of Pa is more prominent, relative to the narrow component, with respect to H. The profile of the broad component of Pa is nearly identical to that of H. There are also indications of a broad component of Pa and HeI 1.0083m, but assessing the reality of these features is difficult because it is at the edge of the spectrum. Pa might be characterized by an absorption on the blue side (i.e. a P-Cygni profile) which might be filled by the [FeII] line. However, the flux of the latter line is a factor of 3 higher than the companion [FeII]1.3206m, as expected by atomic constants, thus it is unlikely that [FeII]1.2567m is affected by a significant absorption feature beneath its profile. Most likely Pa does not have a P-Cygni signature, similarly to H. It is worth noting that the strong [FeII] emission relative to Pa (narrow) indicates that the underlying emission is not simply due to HII regions, but must be contributed significantly also by SN remnants.
2.4 Extinction
The Balmer decrement for the narrow components of H and H is . This implies, for a Galactic extinction curve, an equivalent screen extinction mag. If dust is mixed with the emitting gas the real optical depth is even higher555Note that the “pure” mixed case would give a maximum H/H ratio of , implying that at least part of the absorption is ascribed to a simple foreground screen of dust.. The Na I interstellar absorption doublet at 5890Å has an equivalent width of 5.87 Å. However we note that due to the blending with the near HeI 5876Å emission line, the equivalent width of Na D has been underestimated. According to the relations of Barbon et al. (barbon90 (1990)) and Benetti (priv. comm.), and after assuming a Galactic extinction curve, EW(Na D)5.87Å implies an equivalent screen extinction mag.
We can exploit the ratio of the broad component of Pa and H to constrain directly the reddening affecting the SN. We will assume that during 25 days elapsed between the infrared and the optical spectrum the line flux has not changed significantly (e.g. Danziger et al. danziger (1991), Xu et al. xu (1992), Benetti et al. benetti (1998)); afterwards we will discuss the case of rapid line variability. The observed ratio between the broad components of Pa and H is 1.73. The case B recombination gives an intrinsic ratio Pa/H, which would imply an extinction of mag. Yet, in type II SNe the intrinsic ratio Pa/H appears to be lower than in the case B, although only a few simultaneous observations of Pa and H are available for type II SNe. The Pa/H ratio observed in 1987A was about 0.12 (Xu et al. xu (1992)). By interpolating the data obtained by Fassia et al. (fassia00 (2000)) at different epochs we obtain a similar ratio Pa/H, once corrected for foreground reddening. If we conservatively assume Pa/H, the observed value in SN2001db gives an extinction toward the SN of mag.
To discuss the quick variability case we assume that the hydrogen line flux has decreased at the same rate of the continuum. In this case the line flux cannot have changed by more than 40%, which gives a lower limit on the inferred optical extinction of mag or mag for an intrinsic ratio of 0.12 and 0.06 (case B) respectively.
Summarizing, we derive that the optical extinction toward the SN is larger than (lower limit inferred above from the Na D absorption and narrow Balmer decrement) and most likely in the range 4.6 to 6.7 mag. In the following we assume mag, with an uncertainty of about 1 mag.
Note that the upper limit on the V magnitude of the SN also provides a constraint on the extinction when compared with the light curve of SN templates (Fig. 2). With an extinction mag the SN would have been detected in the optical image of April 17. This lower limit on the extinction is fully consistent with the value inferred above.
In this section we have adopted a Galactic “standard” extinction curve, but there are indications that starbust galaxies might have different extinction curves. Calzetti et al. (calzetti (2000)) estimated the extinction curves for a sample of starburst galaxies. These extinction curves apply mostly for the ”mixed” case and, therefore, are probably inappropriate for our SN. However, aware of this caveat, we have also tried to estimate the extinction by using the extinction curves given in Calzetti et al. (calzetti (2000)) and obtained (accounting also the uncertainties in the reddening curves) a visual extinction ranging from 4.1 to 8.4 mag.
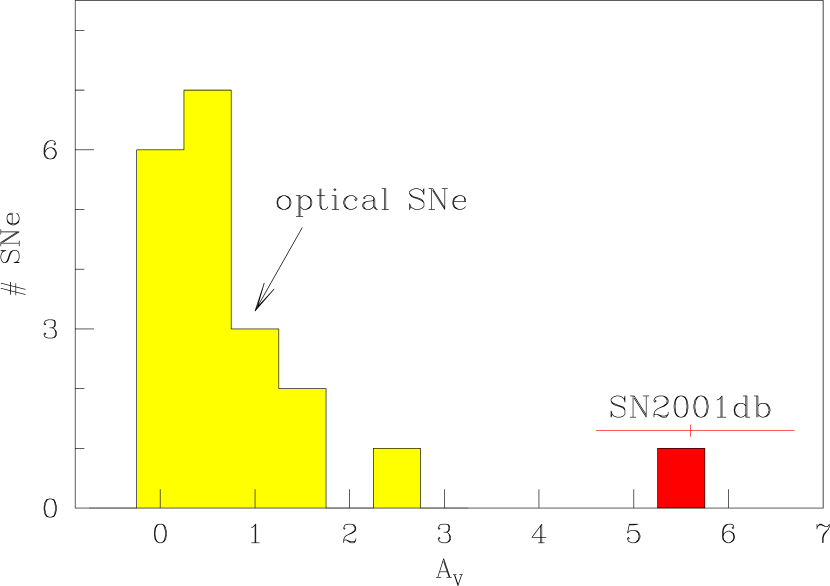
In the compilation given in Mattila & Meikle (mattila (2000)) and in Schmidt et al. (schmidt (1994)) the extinction AV of core collapsed SNe is generally lower than mag, with the exception of SN 1973R for which Schmidt et al. estimate mag. The distribution of extinctions in these two compilations is shown in Fig. 5. If these compilations are representative, then the extinction inferred for the IR SN 2001db is probably the highest among the SNe so far discovered (Fig. 5).
2.5 Supernova type and age
The lack of any absorption blueward of the line peak (i.e. the typical P-Cygni profile) may dis-favor a type IIP. However, since the continuum is dominated by the background emission of the parent galaxy, the lack of P-Cygni absorption is more difficult to assess. Based on Fig.3 (lower panel), we cannot exclude the presence of an absorption feature blueward of the H with an EW less than 2Å. The shape of the broad hydrogen lines (strongly asymmetric and with blueshifted peak) does not favor a type IIn. The available photometric points also do not discriminate between type IIL and IIP. In Fig.2 we report the light curves of SN1980k and SN1999em taken as representative of type IIL and type IIP, respectively (data from Dwek et al. dwek (1983), Barbon et al. barbon82 (1982), Hamuy et al. hamuy (2001)). Both the optical and infrared light curves have been extinguished by an A (i.e. ), as obtained in the former section. The infrared observations can be roughly fit both with the light curve of SN1980k offset by 65 days, and with the light curve of the SN1999em offset by 90 days and 1.0 mag. The average K-band light curve for type II SNe obtained by Mattila & Meikle (mattila (2000)) is nearly identical to the SN1980k light curve in Fig.2, but offset by 55 days.
It is interesting to note that, in any case, the V-band magnitude of the SN was most likely fainter than 20 at its maximum (see Fig.2) and, therefore, it would have been missed by most of the optical SN search programs (e.g. Richmond et al. richmond (1998)).
3 SN1999gw
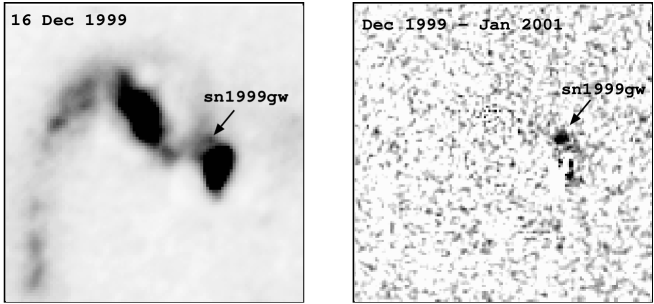
The infrared imaging observations were obtained with the ARNICA near-IR camera (Hunt et al. hunt96 (1996)) at TNG telescope in the Ks band (see Tab.1). UGC4881 was observed for the first time on December 16, 1999 and subsequently three more times: January 12 and February 12, 2000 and on February 8, 2001 with the NICS camera (Baffa et al. baffa (2001)).
The observing strategy and data reduction were analogous to SN2001db. The total on–source integration time for each epoch was 15 min. In Fig.6 (left) we show the ARNICA image of UGC4881, where the SN was detected. The right panel of Fig.6 shows the difference between the image of December 1999 and the image of February 2001, after properly matching the PSF of the two images by means of the ISIS software (Alard alard (2000)). SN1999gw is clearly detected in emission. Some residuals are observed on the nucleus south of the SN (i.e. UGC4881A), where the steeply rising surface brightness prevents an accurate subtraction of the PSF. The magnitude of the SN on December 1999 was Ks=. The SN was located at R.A.(J2000) = 09h15m54.7s, Decl(J2000) = +44 19′ 55′′, being offset 3.5′′ to the North of the Ks nucleus of UGC4881A. In Tab.1 and in Fig. 7 we give the Ks-band light curve (the absolute magnitude is derived by assuming a distance modulus of 36.22).
In Fig. 7 we overplot the average light curve derived by Mattila & Meikle (mattila (2000)), which fits fairly well the photometric points of SN1999gw if the date of discovery is close to the maximum.

4 The infrared SN rate
Our monitoring program is still in progress. A final, detailed summary of our survey and its implications on the SN rate will be provided in a forthcoming paper (Mannucci et al. in prep.). Here we compare the number of SNe detected during our survey with the number of SNe expected by applying the current estimates of SN rates, expressed in SNu (Cappellaro et al. cappellaro (1999)), to our sample of galaxies. So far, our program has detected 4 SNe. One of these is a type Ia (SN1999gd, Li li (1999)), which was also detected in the optical. Another SN was a type II (SN2000bg, Sato & Li sato (2000)), also detected in the optical. The other two SNe, SN1999gw and SN2001db, were discussed in this paper.
By assuming the conversion from blue luminosity to SN rate (all types) given in Cappellaro et al. (cappellaro (1999)), i.e. , we would have expected to detect SNe. Since we have detected 4 SNe, we roughly infer a SN production which is about an order of magnitude higher than estimated by conventional optical surveys.
This high SN rate reflects both the higher extinction affecting the B light of LIRGs (which is the normalizing factor of SNu) and the enhanced star formation in the galaxies of our sample. The enhanced SN rate obtained by our IR survey partly reconciles the contractictory results on starbursts obtained by optical surveys, which were discussed in the Introduction.
Note that a SN rate higher than expected by the blue luminosity is also obtained by the two SNe detected in the optical, implying that the high SN rate inferred by our study is not only due to obscuration. An important difference of our study, with respect to previous surveys, is that our sample is characterized by a much stronger starbursting activity; more specifically, if the star formation is estimated through the far-IR luminosity, the galaxies in our sample are characterized by a star formation rate which is about one order of magnitude higher than in the sample of Richmond et al. (richmond (1998)). Probably, the failure of previous studies in detecting an enhanced SN rate in starburst galaxies is partly to ascribe also to the selected sample, which consisted mostly of “mild” starbursts.
Altough higher than found in optical surveys, the SN rate measured by us is still not as high as expected by the large staformation rate inferred from the far-IR luminosity of the galaxies in our sample. Indeed, if most of the far-IR luminosity is due to star formation, and we adopt the conversion from LFIR to SN rate given in Mattila & Meikle (mattila (2000)), i.e. , we find that our survey has detected only about 20% of the expected SNe.
There are various possible scenarios which could explain the shortage of SN detections. One possibility is that most SNe are so embedded into the dust to be significantly obscured even in the near-IR. More specifically, in order to reduce the expected number of SNe by a factor of 5 (i.e. the fraction of missing SNe) they should be, on average, fainter by 3.0 magnitudes in K, implying that they should be absorbed by , or . Another possibility is that most SNe occur in the nucleus (i.e. within the central 2′′); in this case our limited angular resolution would have prevented disentangleing them from the peaked nuclear surface brightness of these galaxies, even when the PSF between multi-epoch images are optimally matched. In support to this scenario recent mid-IR studies have found growing evidence that a large fraction of the starburst activity occurs in the nuclear region (Soifer et al. soifer (2001)). The possibility that most SNe occur in the nuclear region can be tested through near-IR monitoring from space (e.g. NICMOS on HST), which would provide higher angular resolution and more stable PSF. Alternatively, nuclear SNe could be disentangled spectroscopically through the detection of the broad hydrogen lines characteristics of type II SNe, by periodically monitoring the (near-IR) spectra of the nuclei of the galaxies in our sample. The discovery of a nuclear SN by Aretxaga et al. (aretxaga (1999)) through the detection of broad hydrogen lines has shown the feasibility of the latter approach in the optical.
Finally, the assumption that the high far-IR luminosity is tracing an enhanced star formation rate might be incorrect. In particular, obscured AGNs may contribute substantially to the IR luminosity of these galaxies (Sanders & Mirabel sanders (1996)). Note that heavily obscured AGNs may be present even if not identified spectroscopically and may be totally obscured even in the X-rays (Marconi et al. marconi (2000), Maiolino et al. maiolino98 (1998)).
5 Conclusions
We have presented the discovery of SN 1999gw and SN 2001db obtained within the framework of a near-IR (m) search for obscured SNe in Luminous Infrared Galaxies. The spectroscopic follow-up of SN2001db indicates that this was a type II SN, extinguished by A. Interesting enough this SN, the first one to be discovered in IR and spectroscopically confirmed, would have been missed by ordinary optical surveys.
Preliminary estimates of the SN rate indicate that the SN production in Luminous Infrared Galaxies is , about an order of magnitude higher than expected by the relation between LB and SN rate found in optical studies. This result confirms that optical surveys miss a significant fraction of the SNe, especially in obscured systems such as starburst galaxies. However, simple first order estimates, based on the far-IR luminosity, indicate that our near-IR survey is still largely incomplete, and that 80% of the SNe are missed. Some possible explanations for this issue are: 1) most SN are more obscured than mag; 2) the number of expected SNe as inferred from the LFIR is overestimated because hidden AGNs dominated the luminosity; 3) most of the SNe occur in the nuclear region and the limited angular resolution prevents their discovery.
Acknowledgements.
We are grateful to S. Mattila, P. Meikle and N. Panagia for useful comments. The near-IR survey partly presented in this paper is the result of the efforts of a larger collaboration which also includes V. Ivanov, A. Alonso-Herrero and N. Nagar. We thank the ESO staff, on La Silla and on Paranal, as well as the TNG staff for their help during the observations. We thank the ESO General Director for allocating Director Discretionary Time to this project. M. Della Valle and R. Maiolino are grateful to the Paranal and La Silla ESO observatories and to the ESO Santiago Science Office for their kind hospitality during this research program, within the framework of the Visiting Scientist Program. This work was partially supported by the the Italian Space Agency (ASI).References
- (1) Alard, C. 2000, A&AS, 144, 363
- (2) Aretxaga, I., Joguet, B., Kunth, D., Melnick, J., & Terlevich, R. J. 1999, ApJ, 519, L123
- (3) Baffa, C., Comoretto, G., Gennari, S., et al. 2001, A&A, 378, 722
- (4) Calzetti, D., Armus, L., Bohlin, R. C., Kinney, A. L., Koornneef, J., & Storchi-Bergmann, T. 2000, ApJ, 533, 682
- (5) Cuby, J. G., Lidman, C., Moutou, C., & Johnson, R. 2002, ISAAC User Manual, ESO
- (6) Barbon, R., Benetti, S., Rosino, L., Cappellaro, E., & Turatto, M., 1990, A&A, 237, 79
- (7) Barbon, et al., 1982, A&A, 116, 35
- (8) Benetti, S., Cappellaro, E., Danziger, I. J., Turatto, M., Patat, F., della Valle, M., 1998, MNRAS, 294, 448
- (9) Cappellaro, E., Evans, R., & Turatto, M., 1999, A&A, 351, 459
- (10) Cresci, G., Mannucci, F., Maiolino, R., Della Valle, M., Ghinassi, F., 2002, IAUC
- (11) Danziger, I. J., Lucy, L. B., Bouchet, P., & Gouiffes, C., 1991, in Supernovae, S.E. Woosley ed. (Springer-Verlag), p.69
- (12) Dwek, et al., 1983, ApJ, 274, 168
- (13) Fassia, A., Meikle, W. P. S., Vacca, W. D., et al., 2000, MNRAS, 318, 1093
- (14) Filippenko, A. V., 1997, ARA&A, 35, 309
- (15) Genzel, R., Lutz, D., Sturm, E., et al., 1998, ApJ, 498, 579
- (16) Grossan, B., Spillar, E., Tripp, R., Pirzkal, N., Sutin, B. M., Johnson, P., Barnaby, D., 1999, AJ, 118, 705
- (17) Hamuy, M., Pinto, P. A., Maza, J., et al., 2001, ApJ, 558, 615
- (18) Hunt, L. K., Lisi, F., Testi, L., et al., 1996, A&AS, 115, 181
- (19) Hunt, L. K., Testi, L., Borelli, S., Maiolino, R., & Moriondo, G. 1994, Arcetri Technical Report, 4/94
- (20) Lidman, C., Cuby, J.-G., & Vanzi, L. 2000, SOFI User’s Manual, ESO
- (21) Li, W. D. 1999, IAUC, 7319, 1
- (22) Maiolino, R., Rieke, G. H., Rieke, M. J., 1996, AJ, 111, 537
- (23) Maiolino, R., Salvati, M., Bassani, L., et al. 1998, A&A, 338, 781
- (24) Maiolino, R., Della Valle, M., Vanzi, L., Mannucci, F., 2001, IAUC, 7661, 2
- (25) Marconi, A., Oliva, E., van der Werf, P. P., 2000, A&A, 357, 24
- (26) Mattila, S., & Meikle, W. P. S., 2000, MNRAS, 324, 325
- (27) Richmond, M. W., Filippenko, A. V., Galisky, J., 1998, PASP, 110, 553
- (28) Sanders, D. B., & Mirabel, I. F., 1996, ARA&A, 34, 749
- (29) Sato, Y., & Li, W. D. 2000, IAUC, 7392, 1
- (30) Schmidt, B. P., Kirshner, R. P.,
- (31) Schlegel, E. M. 1990, MNRAS, 244, 269
- (32) Soifer, B. T., Neugebauer, G., Matthews, K., et al, 2001, ApJ, 559, 201
- (33) Szeifert, T. 2002, FORS User Manual, ESO
- (34) Van Buren, D., & Norman, C. A., 1989, ApJ, 336, L67
- (35) Van Buren, D., Jarrett, T., Terebey, S., Beichman, C., Shure, M., Kaminski, C., 1994, IAUC, 5960, 2
- (36) Xu, Y., McCray, R., Oliva, E., & Randich, S., 1992, A&A, 386, 181
| SN2001db | ||||
|---|---|---|---|---|
| Date | Tel./Instr. | type | band/ | mag |
| 09 Jan 2001 | NTT/SOFI | imag. | Ks | 16.030.20 |
| 08 Feb 2001 | NTT/SOFI | imag. | Ks | 16.930.20 |
| 18 Mar 2001 | NTT/SOFI | imag. | Ks | 17.330.25 |
| 01 Apr 2001 | NTT/SOFI | imag. | Ks | 17.740.30 |
| 17 Apr 2001 | VLT/FORS1 | imag. | open | V22 |
| 21 Apr 2001 | VLT/ISAAC | spec. | 1.08–1.35m | |
| 16 May 2001 | VLT/FORS1 | spec. | 4500–9100Å | |
| 16 May 2001 | VLT/FORS1 | imag. | open | V22 |
| SN1999gw | ||||
| Date | Tel./Instr. | type | band/ | |
| 16 Dec 1999 | TNG/ARNICA | imag. | Ks | 17.450.20 |
| 26 Jan 2000 | TNG/ARNICA | imag. | Ks | 18.410.30 |
| 12 Feb 2000 | TNG/ARNICA | imag. | Ks | 18.6 |
| 08 Feb 2001 | TNG/NICS | imag. | Ks | 18.6 |
| Line | Flux | FWHMa | V | |
|---|---|---|---|---|
| NaIc | 5893Å | 0.340.07 | 65401000 | 340800 |
| OI | 6300Å | 0.100.03 | 95002000 | 320900 |
| H | 6562Å | 4.400.40 | 5200600 | –2140250 |
| FeII | 7155Å | 0.170.05 | –d | –2290500 |
| CaII | 7324Å | 1.050.1 | 8416500 | –1820500 |
| CaII | 8542Å | 0.940.1 | 3000800 | –2310300 |
| CaII | 8662Å | 1.500.15 | 6500700 | –370300 |
| Pa | 12818Å | 7.610.7 | 4900700 | –2570300 |