The Growth and Structure of Dark Matter Haloes
Abstract
In this paper, we analyse in detail the mass-accretion histories and structural properties of dark haloes in high-resolution N-body simulations. We model the density distribution in individual haloes using the NFW profile. For a given halo, there is a tight correlation between its inner scale radius and the mass within it, , for all its main progenitors. Using this correlation, one can predict quite well the structural properties of a dark halo at any time in its history from its mass accretion history, implying that the structure properties and the mass accretion history are closely correlated. The predicted growing rate of concentration with time tends to increase with decreasing mass accretion rate. The build-up of dark haloes in CDM models generally consists of an early phase of fast accretion [where the halo mass increases with time much faster than the expansion rate of the universe] and a late phase of slow accretion [where increases with time approximately as the expansion rate]. These two phases are separated at a time when and the typical binding energy of the halo is approximately equal to that of a singular isothermal sphere with the same circular velocity. Haloes in the two accretion phases show systematically different properties, for example, the circular velocity increases rapidly with time in the fast accretion phase but remain almost constant in the slow accretion phase, the inner properties of a halo, such as and increase rapidly with time in the fast accretion phase but change only slowly in the slow accretion phase, the inner circular velocity is approximately equal to in the fast accretion phase but is larger in the slow accretion phase. The potential well associated with a halo is built up mainly in the fast accretion phase, while a large amount of mass can be accreted in the slow accretion phase without changing significantly the potential well. We discuss our results in connection to the formation of dark haloes and galaxies in hierarchical models.
keywords:
galaxies: formation - galaxies: clusters - large-scale structure - cosmology: theory - dark matter1 Introduction
The Cold Dark Matter (CDM) cosmogony (Peebles 1982; Blumenthal et al. 1984; Davis et al. 1985) has now been proved to be a remarkably successful framework for understanding the structure formation in the universe. In the CDM scenario, a key concept in the build-up of structure is the formation of dark matter haloes, which are quasi-equilibrium systems of dark matter particles formed through non-linear gravitational collapse. In a hierarchical scenario like the CDM, most mass in the Universe at any time is in dark haloes; galaxies and other luminous objects are assumed to form by cooling and condensation of baryons within these haloes (White & Rees 1978). In this case, a detailed understanding of the formation and structure of dark matter haloes is of fundamental importance for predicting the properties of luminous objects.
One of the most important properties of the halo population is their density profiles. Based on N-body simulations, Navarro, Frenk, & White (1997; hereafter NFW), found that CDM haloes can be fitted by a two-parameter profile:
| (1) |
where is a characteristic “inner” radius at which the logarithmic density slope is , and is the density at . A halo is often defined so that the mean density within the halo radius is a constant (, will be defined in Section 2) times the mean density of the universe () at the redshift () in consideration. The halo mass can then be written as
| (2) |
We define the circular velocity of a halo as , and so
| (3) |
where is the Hubble constant, and the mass density parameter, at redshift . NFW introduced an alternative parameter, the concentration parameter , defined as , to describe the shape of the halo profile. It is then easy to show that
| (4) |
We denote the mass within by , and the circular velocity at by . These quantities are related to and as
| (5) |
In general, the structure of a halo is expected to depend not only on cosmology and power spectrum, but also on its formation history. There are therefore attempts to relate halo concentration to other quantities characterizing the formation of a halo. In their original paper, NFW suggested that the characteristic density of a halo, , should be a constant () times the mean density of the universe, , at the redshift (referred as the formation time of the halo by NFW) when half of the halo’s mass was first in progenitors more massive than times the halo mass. NFW used the extended Press-Schechter formula to calculate and found that the anti-correlation between and observed in their simulations can be reproduced with a proper choice of the values for the constants and .
Subsequent analyses showed that additional complexities may be involved in halo structure. First, it has been shown that haloes of fixed mass have significant scatter in their values (Jing 2000), although there is a mean trend of with . If this trend is indeed due to a correlation between concentration and formation time, the scatter in may reflect the expected scatter in the formation time for haloes of a given mass. Second, Bullock et al. (2001, hereafter B01) found that the halo concentration (at fixed mass) is systematically lower at higher redshift, with a trend much stronger than that predicted by the NFW model. They presented an empirical model that can reproduce the concentration in the LCDM model better than the original model proposed by NFW. Using the same simulations as B01, Wechsler et al. (2002; hereafter W02) found that, over a large mass range the mass accretion histories of individual haloes are reasonably well described by a one-parameter exponential form, . They defined the formation time of a halo to be . Assuming that equals to at the formation time and grows proportionally to the scale factor , W02 proposed a recipe to predict the concentration for individual haloes through their mass-accretion histories. This recipe can reproduce the dependences of on both mass and redshift found in B01.
Semi-analytical modeling of galaxy formation becomes a powerful tool to predict observational properties of galaxies in hierarchical clustering models (e.g. Kauffmann et al. 1993; Cole et al. 1994; Mo, Mao, & White 1998; Somerville & Primack 1999; Mo & Mao 2002). In the theory, one needs to know both the mass accretion history and the structure properties of the host halo, as they critically influence many observable properties of the galaxy formed within it. The mass accretion history is understood relatively well, and can be modeled accurately either in analytical methods (e.g. extended Press-Schechter theory, EPS) or in N-body simulations. The internal structure of a halo at higher redshift (i.e. its main progenitor) is modeled much more poorly, since the EPS theory tells nothing about halo internal structure, and a high resolution is required to resolve the halo internal structure in N-body simulations (especially for conventional cosmological simulations). It is therefore very important to find a way (analytical or empirical) to predict the structural history of a halo.
The result of W02 is encouraging, because it implies that halo structure is closely correlated with mass-accretion history. This correlation is important not only for predicting the halo concentration , but also for understanding the formation of dark matter haloes in hierarchical models. However, as noticed by W02 themselves, not all mass-accretion histories are smooth and have the same form; the fit to the analytical form may be sensitive to the presence of major mergers. Moreover, the assumption that is not expected to be universally true, because in general should depend on the mass-accretion history even after the formation time. Furthermore, Jing & Suto (2002) found that for the standard CDM model with , grows much faster for a fixed mass, , and indeed a scaling, [where is the Hubble constant at redshift ] may work better. For the flat universe considered here, , where is the current Hubble constant.
In this paper, we analyse in detail the mass-accretion histories and structural properties of a few high-resolution dark haloes of galactic masses. We find that, for a given halo, there is a tight correlation between the scale radius and the mass within it for all its main progenitors (see Section 2 for definition). We show that this relation can be used to predict the structural properties (such as ) of haloes at any given time from their mass-accretion histories. We also find several interesting properties of the mass accretion process, which can help us to understand the formation of dark haloes in hierarchical models. Compared with the work of W02, we will focus on our new finding of the scaling relation between and , and emphasize how to use this relation to predict the structure properties of halos from their merger history. Our halo sample is small but has a higher mass resolution, compared with the halo sample of W02. We will use the GIF simulations (Kauffmann et al. 1999), which are similar to the simulations of W02, to verify our conclusions drawn from the small set of high-resolution simulations. The arrangement of the paper is as follows. We describe the simulations used in this paper and the analyses performed on them in Section 2. The mass-accretion histories and their relations to halo internal properties are analysed in Section 3. In Section 4 we propose a recipe to predict halo structural properties through halo mass-accretion histories and test it against various simulation results. Finally, in Section 5 we discuss the implication of our results for galaxy formation and summarize our main conclusions. We use physical lengths instead of comoving lengths throughout the paper unless otherwise specified.
2 Simulations and analyses
In this paper, we first analyze a set of five high-resolution halo simulations. The haloes were selected from a cosmological P3M N-body simulation for a CDM model with , , and . This simulation uses particles in a comoving cube, and the particle mass is . The selected haloes consist of 1000 particles, have a mass of , and are relatively isolated [i.e. there is no companion of larger mass within a distance of , where and are the virial radii of the halo and the companion, respectively, and the definition for the virial radius will be given shortly]. These haloes are then resimulated with the multiple-grid code of Jing and Suto (2000). We use particles, each of mass , for the high-resolution region, and particles (whose mass increase with the distance from the boundary of the high-resolution region) for the coarse region. The simulations are evolved by 5000 time steps with a comoving softening length . At the end, each halo contains particles within their virial radius. The contamination of the coarse particles, measured by the ratio of the mass of the coarse particles within the virial radius to the total virial mass, is small, about for these galactic haloes. These haloes have been used by Chen & Jing (2002) for studying the angular momentum distribution in dark haloes. Because it is difficult to resimulate halos when there are more massive close neighbours, the haloes selected here are the 20 percent most isolated haloes (other authors also used similar selections when resimulating haloes of a galactic mass). This selection however does not guarantee that the halo sample is complete and typical. To make sure that our results derived from this sample are valid for haloes in general, we will use the GIF simulations (Kauffmann et al. 1999) to verify our conclusions.
We use the spherical overdensity algorithm (hereafter SO) of Lacey & Cole (1994) to identify groups in the halo simulations. This algorithm selects spherical regions whose average density is equal to times the mean cosmic density . Here we adopt the fitting formula of Bryan & Norman (1998) for , where and is the cosmic mass density parameter at redshift . The value of ranges from at high redshift to at the present for our CDM cosmology. We selected groups at a total of 20 outputs for each simulation. The outputs are logarithmically spaced in the cosmic scale factor from to .
Because we will study how a halo grows with time, we need to construct the main branch of the merging tree for each halo. Given a group of dark matter particles at a given output time (which we refer to as group 2), we trace all its particles back to an earlier output time. A group (group 1) at the earlier output is selected as the “main progenitor”of group 2 if it contributes the largest number of particles to group 2 among all groups at this earlier output. We found that more than half of the particles of group 1 is contained in group 2. We refer to group 2 as the “main offspring” of group 1. For each of the five haloes, we use this method to construct the main branch of the merging tree from to .
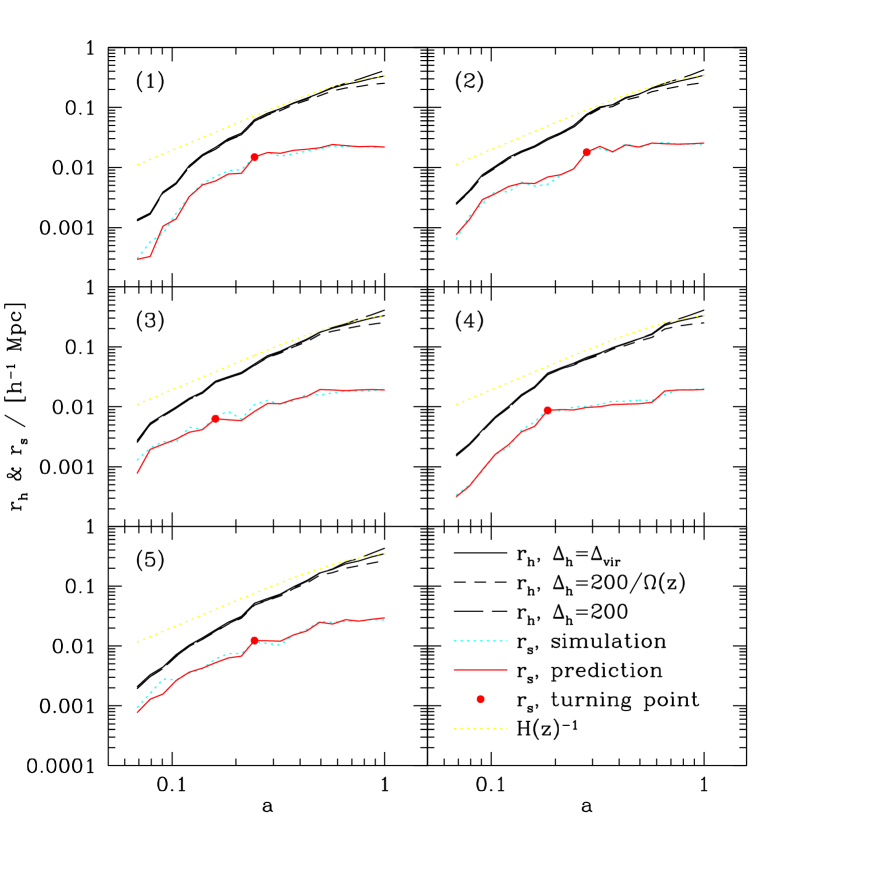
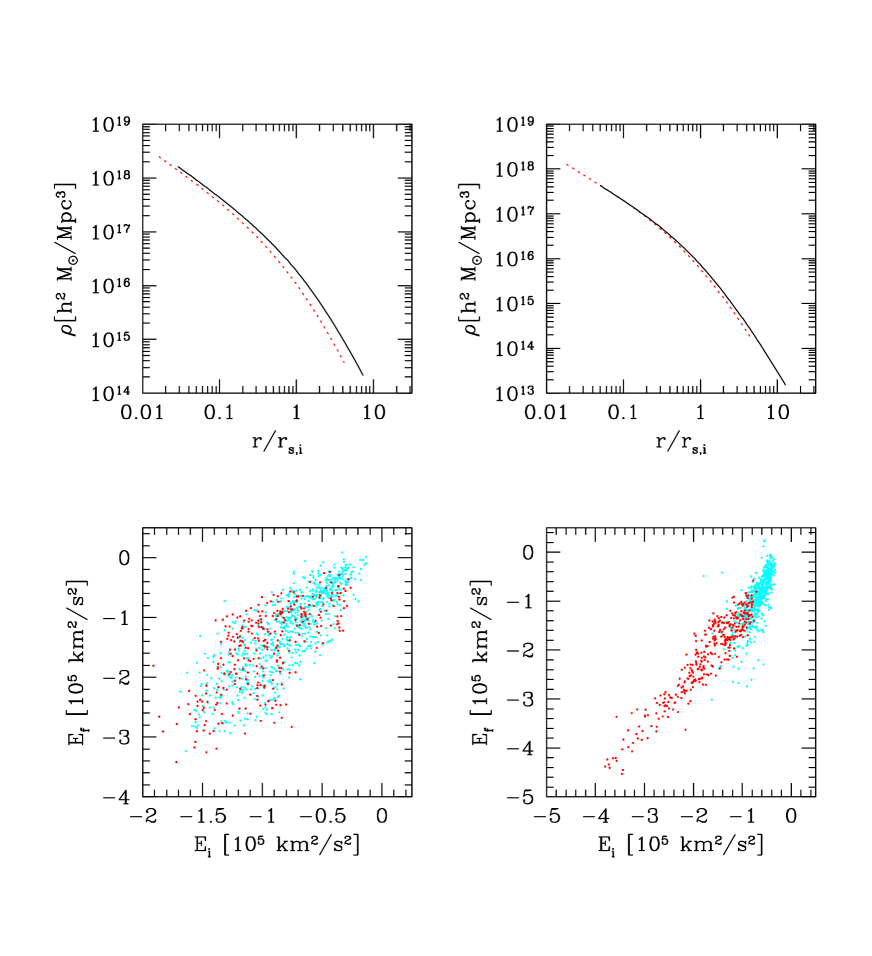
The center of each progenitor group is chosen to be the particle within the group which possesses the most negative gravitational potential energy. The potential is calculated using only the group particles. We then inflate a sphere around this center until the enclosed density drops below . The selected region is called a virialized halo, and the corresponding radius and the mass it encloses define and for the halo. When constructing the halo density profile, we include not only the particles assigned to the group but also other surrounding particles. Then we fit the density profile of each halo using the NFW form (Eq. 1) and determine the best fitting value of . The radial bins are logarithmically spaced from to . If any bin includes less than 5 particles we decrease the number of bins by one until this is no longer the case. The fitted value of is insensitive to the choice of for the outer boundary. As an example, we show in Fig. 1 the density profiles and the corresponding NFW fit results of the main progenitors of one (the second) of the five haloes.
In the literature, the concentration parameter is often used to characterize the shape of the density profile, and is defined as the ratio of the outer radius of the halo to (cf. equation 4). The definition for is still quite arbitrary in the community; some authors opt to use (e.g. Jenkins et al 2001) or (e.g. B01; Jing & Suto 2002), while others choose the halo mean overdensity to be 200 times the critical density of the universe, i.e. (NFW). These different definitions of can lead to sizable difference in for a given halo, and the difference depends on cosmological parameters. Although the difference in for the different definitions is only a constant factor and can be corrected (see Jing & Suto 2002), we think it better to use to characterize the inner halo profile. In our following discussion, we will use all three definitions when showing results for .
3 Mass accretion history and halo structure
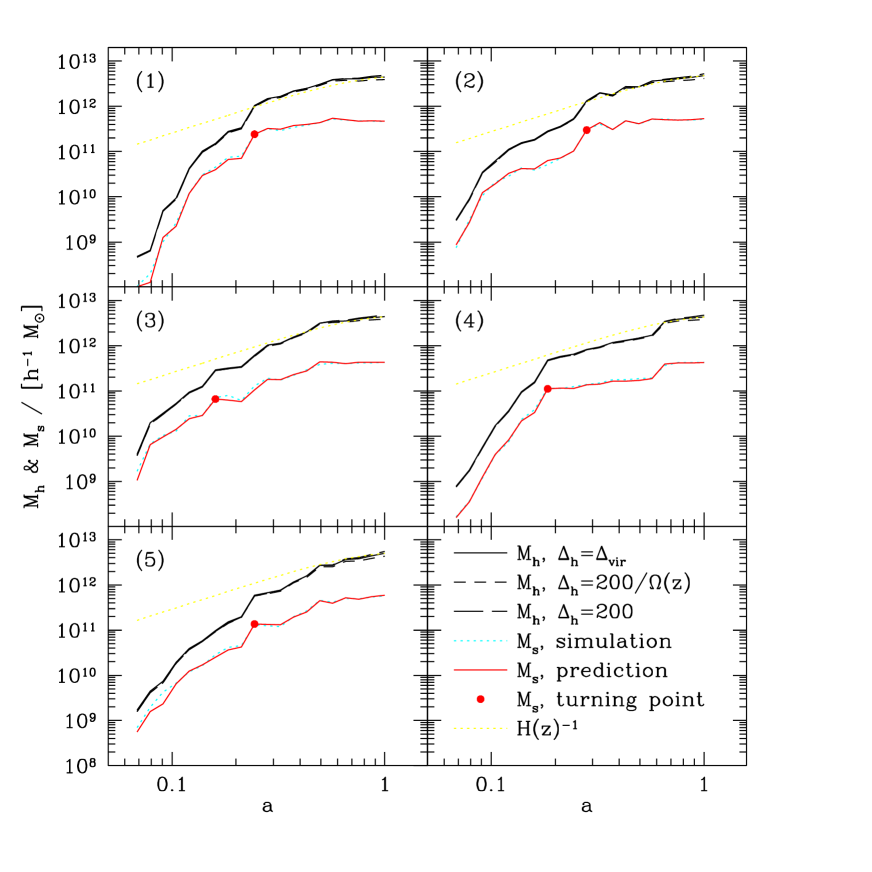
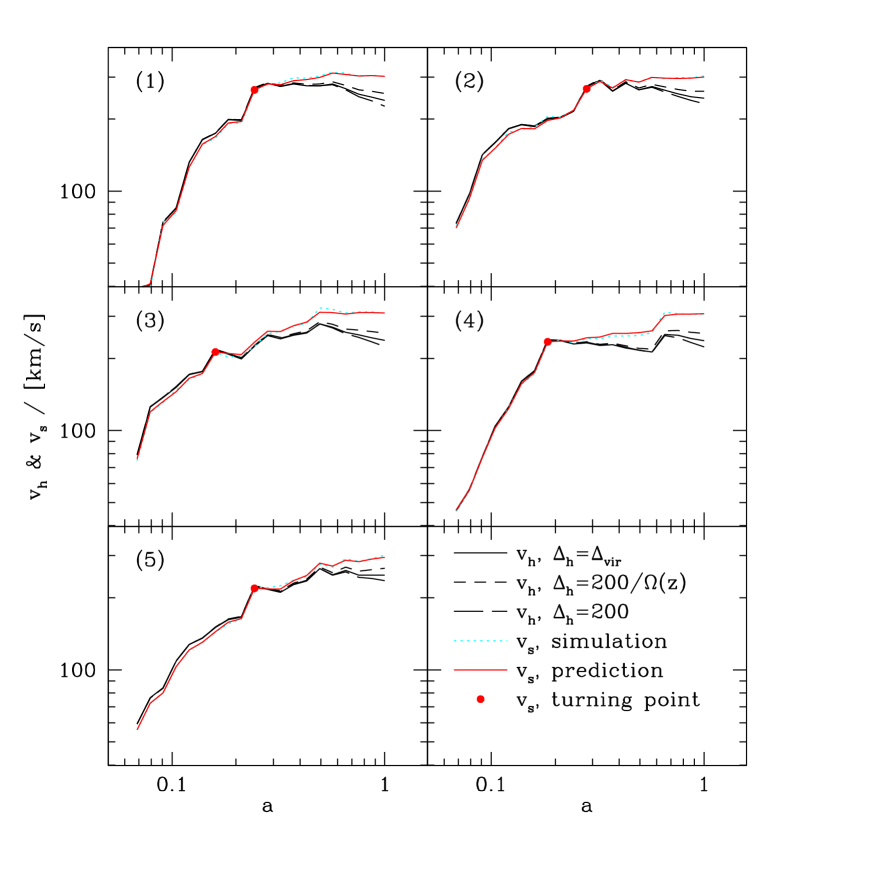
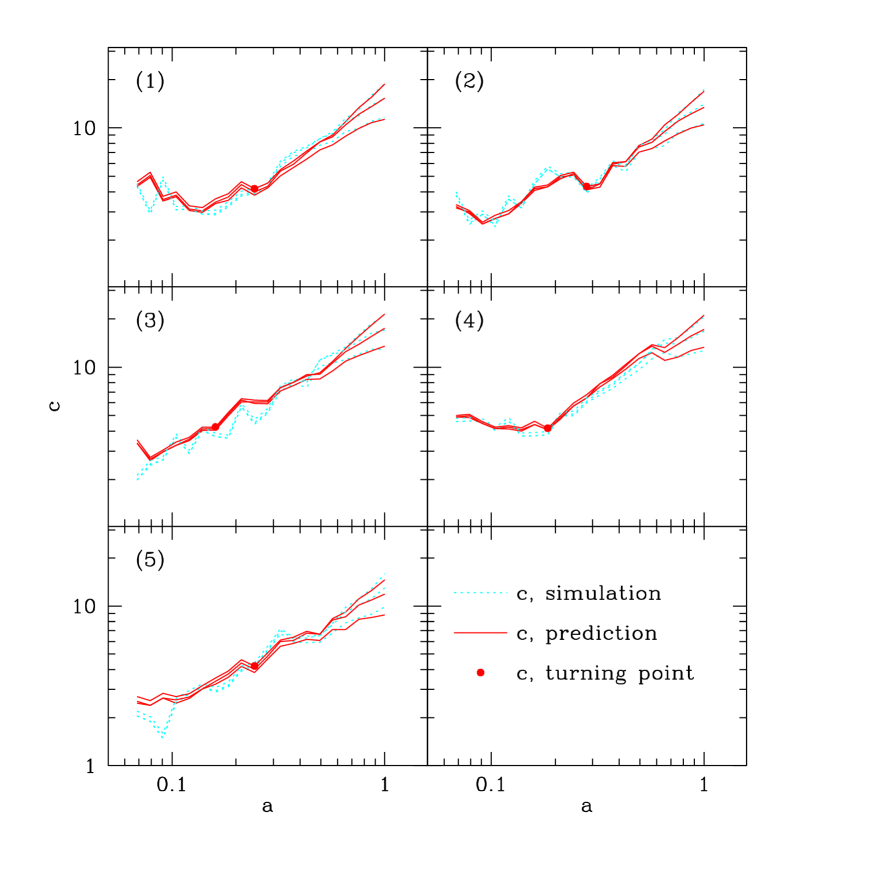
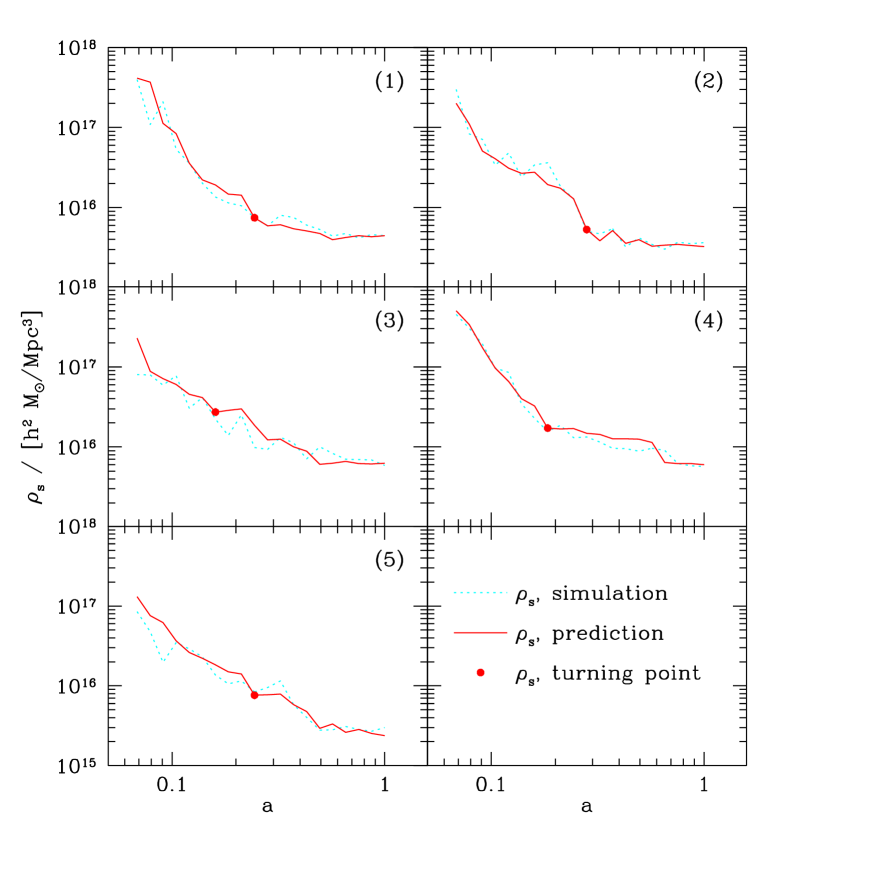
In Fig. 2, we show the mass-accretion histories, i.e. the increase in mass of the main progenitors, for the five haloes. As one can see, the build-up of a present-day galactic halo consists of an early phase of fast accretion, where the halo mass increases with time much faster than , and a late phase of slow accretion, where increases with time approximately as . The redshift (called the turning point in the following) which separates these two phases is roughly 3 for the haloes considered here. On average, major mergers dominate the halo formation at high redshift, and minor mergers dominate the slow accretion phase. For the 5 haloes considered here, about 4/5 of the haloes undergo a major merger (with mass ratio larger than ) within a Hubble time in the fast accretion phase, while this fraction decreases to 1/4 in the slow accretion phase. In Figs. 2 – 6 we also show the evolution histories for other halo properties (inner mass , halo radius , inner radius , halo circular velocity , inner circular velocity , inner density and concentration ). These figures show that haloes in the two accretion phases show systematically different properties. For example, in the slow accretion phase, both the inner scale radius () and the density at it () change slowly, while in the fast accretion phase increases, and decreases, rapidly with the Hubble expansion. In the slow accretion phase, and increase slowly and is higher than , while in the fast accretion phase, both and increase rapidly with the Hubble expansion, and is slightly higher than . The halo concentration increases rapidly with the Hubble expansion in the slow accretion phase, but has a slower change in the fast accretion phase. For haloes 1 and 4, where the early mass accretion is much faster than , is almost a constant.
For an NFW halo with concentration , the mean specific binding energy is
| (6) |
(see Mo, Mao & White 1998). If changes from 5 to 15 (the typical range for CDM haloes in the slow accretion phase), changes from to . Thus, in the slow accretion phase where is almost a constant, the specific binding energy changes only slowly as increases, while in the fast accretion phase the potential well builds up rapidly as increases. This suggests that the potential well associated with a halo is built up mainly during the early phase of rapid accretion. Note that for the five haloes considered here, the total mass increases by a factor of 3 to 10 while changes only a little during the slow accretion phase. Apparently, such slow accretion does not affect much the potential well, although it can cause a large increase in halo mass.
From equation (6) we see that for (so that ) the mean specific binding energy of an NFW halo is the same as that of a singular isothermal sphere with the same circular velocity. For an NFW halo, this occurs at a time when ( for ). As one can see from Figs. 5 and 4, this time follows closely the epoch when the accretion makes the transition from the fast to the slow phase. This transition defines a characteristic time for the mass-accretion history of a halo, as we will see in the following.
4 Predicting halo structural properties from mass-accretion histories
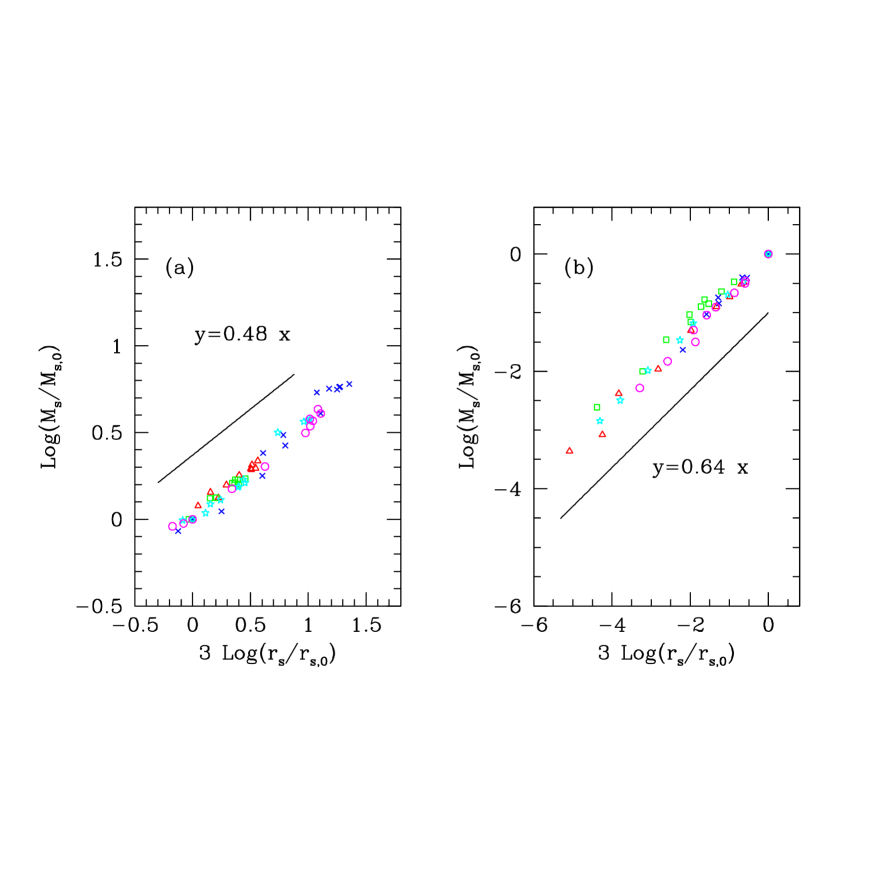
As one of the main results of this work, we find that the scale radius is tightly correlated with the scale mass (as shown in Fig. 7), which can be well represented by a simple power law:
| (7) |
where and are the scale mass and scale radius at some chosen epoch, say the turning point . The slope remains about during the whole evolution histories of the haloes. More precisely, we find that the slope is slightly different in the two phases separated by . For the slow accretion phase (), , while for the rapid accretion phase (), (see Fig. 7). During the evolution of a halo, the mass and have typically grown by a factor of about 3 and 10 respectively from to , and more than 1000 times from the first output to . Over the entire redshift span, both the initial power spectrum at the mass scale of the progenitors and the cosmological parameters [ and ] change substantially, and so the tight correlation between and we find should be valid quite universally for CDM-class models. Further test of this scaling relation will be made below by comparing its predictions with the results obtained from another set of -body simulations.
An immediate application of the scaling relation is to use it to predict the evolution of the density profile of a halo from its mass-accretion history. This can be done as follows. For the NFW profile we have
| (8) |
Combining equations (7) and (8), we get
| (9) |
Thus, for a given halo definition, which relates and , and a given calibration, which specifies and , the scale radius is uniquely determined by the halo mass through the above equation. We can therefore obtain as a function of time, once the mass-accretion history is known. Equivalently, in terms of we have
| (10) |
Again, once a calibration is adopted to specify and , we can predict as a function of redshift for a given mass-accretion history . From this equation, one can see that if the increase of the second term dominates the decrease of the first term on the right hand side, i.e. the log mass accretion rate is higher than for (as in the fast accretion phase), the predicted will decrease rather than increase.
The existence of the tight relation between and means that the structural properties of a halo can be related to its mass-accretion history. The scaling relation obtained here is different from that assumed in W02, . For large , equation (10) gives , which is the same as the scaling proposed by W02 only if . Since , equation (10) implies that also depends on the mass accretion [i.e. on the form of ]. As we will show later in this section, our scaling relation leads to more accurate predictions for halo structural properties than the assumption of W02 does.
In order to use equation (9) or (10) to predict and , one has to specify the concentration (or the scale radius ) at some fiducial time (i.e. to calibrate the zero-point of the scaling relation). If the mass-accretion history of a halo is given by an -body simulation, the zero-point calibration can be made at the final output time of the simulation, and our formulae can be used to predict the halo concentration along the main branch of the merging tree at any other time. Since the determination of the mass-accretion histories of dark haloes does not require the resolution of density profiles of small objects at high redshift, our model allows one to assign concentration parameters to high-redshift haloes even in simulations with moderate resolutions.
There is another calibration scheme which can be implemented in semi-analytical models of halo merger histories (obtained via, e.g., the extended Press-Schechter theory). As shown in Fig. 2, the growth rate of halo mass changes dramatically around . This epoch marks a turning point in the mass accretion history, and may be chosen to calibrate the zero point. We will propose an objective recipe to find out the characteristic time. As shown in Figs. 2 and 4, even though the mass-accretion history differs substantially from halo to halo, all haloes have similar asymptotic behavior: and at the early fast accretion phase, and and constant in the late slow accretion phase. After some trials, we found a good approximation to the characteristic time () which is given by the epoch when reaches its maximum, where is a constant. We will use , but our results are robust to the change of from to 111We have tested this by changing from to . There are only small systematic changes () in the results which can be eliminated by adjusting the value of , the reason may be that the turning is sharp.. The typical concentration at the turning point is . The zero-point calibration can then be made by setting and equal to the mass of the main progenitor at . This calibration method is used for prediction throughout the paper.
The basic idea in the above calibration of is the same as that of W02, based on the simulation results that the halo concentration at the end of a fast accretion phase is approximately at a constant value. In the recipe proposed by W02, the time at which mass accretion changes from the fast phase to the slow phase is obtained by fitting the mass accretion history by an exponential form. Here we do not assume any universal form for the mass accretion history.
Once the mass-accretion history is known, the calibrated relation (10) can be used to predict the structural quantities of a halo, such as , , , , and . The predictions for these quantities are shown in Figs. 2 – 6. We have used for and for , as derived from the simulations. The predictions are compared with quantities measured directly from the simulations. As one can see, our recipe works pretty well even when the halo mass and the inner mass grow by factors of several hundreds.
Since our model is based only on simulations of five present-day galaxy haloes, it is necessary to test its validity against other simulations. Here we use the GIF, a set of cosmological N-body simulations carried out at the MPA (e.g. Kauffmann et al. 1999). The GIF simulation we use here was performed with particles in a comoving box, and so the particle mass is . The comoving softening length , and the cosmogony is the same as that of our halo simulations except that . Dark matter particles are grouped using the standard friend-of-friend algorithm with a linking length 0.2 times the mean separation of particles. The halo mass within and the merger tree information at 44 output times (logarithmically spaced in from to ) are provided . We use this tree information to trace the main progenitors of a halo backwards step by step to , re-locate the halo center to the most bound particle, and calculate the halo mass using the three halo definitions discussed in Section 2.
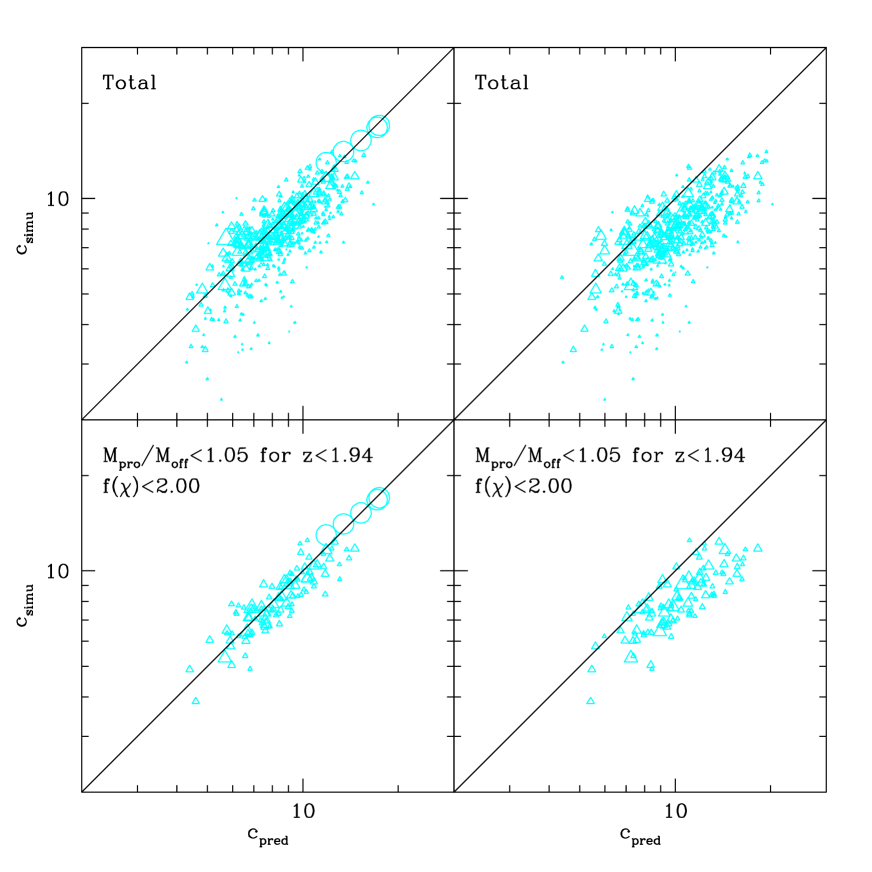
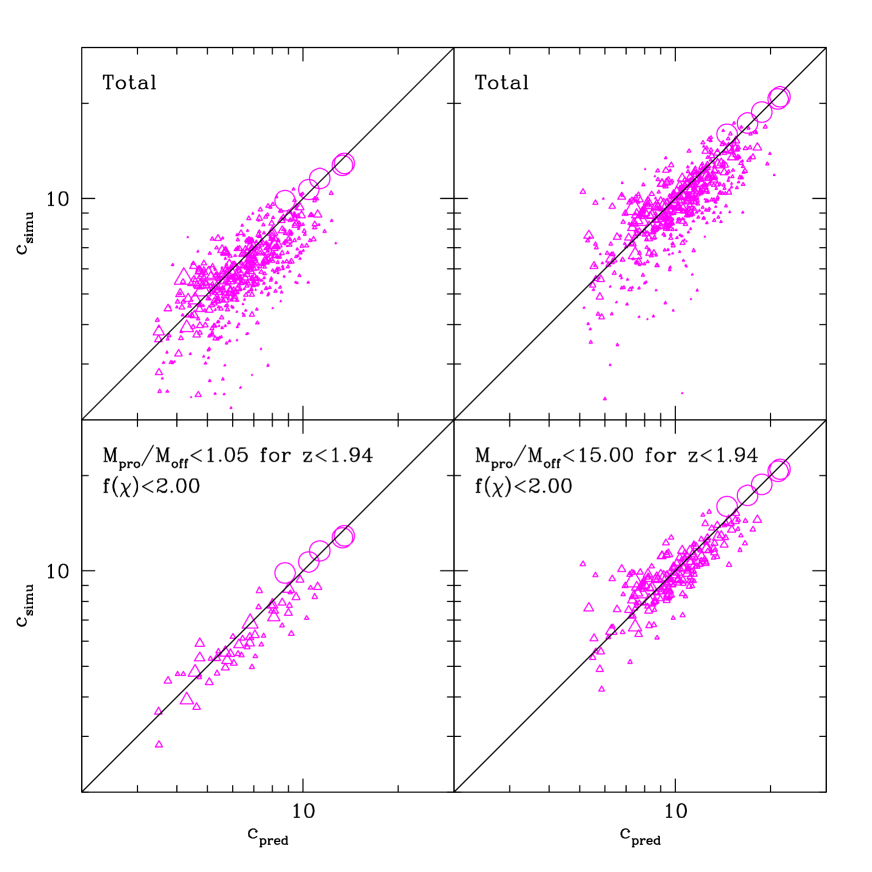
We predict the final halo concentrations for haloes more massive than (i.e. those containing more than particles) using our recipe, and compare them with the results of direct NFW fitting to the simulation data. Our recipe is not applicable to a small fraction () of haloes for which the mass growth has always been fast and so cannot be determined. Note that even for these cases a calibration can still be made in semi-analytical models by extending the merger tree further in time. For the five haloes considered above, [and so and ] and so all the three definitions of give essentially the same concentration, at . However, for the more massive haloes in the GIF simulation, the values of for some haloes are close to zero and the value of depends on halo definition. We have tested the calibration for all the three definitions, and found that the calibration at holds best for the definition . For the other two definitions, one has to adjust the value of , but this can be done straightforward since the difference of halo density among different definitions is known at any given redshift222Actually this has already been included in the prediction for the above 5 haloes. The predictions based on this calibration are compared with the simulation results in the upper left panel of Fig. 8 and upper panels of Fig. 9 for all the three definitions. The scatter of the correlation between the model predictions and the simulation results (i.e. around ) is , and respectively. Several sources can cause this scatter: (i) the inaccuracy of the scaling relation (Eq. 7) and the error in its calibration; (ii) the error of halo identification and mass counting from simulation; and (iii) the error in the NFW fitting of halo profiles due to the finite number of particles. To demonstrate these effects, we show in the lower panels of these figures the results for about of the haloes which have better qualities in NFW fitting and better defined halo mass. The quality of NFW fitting is represented by , which gives the relative fitting chi-square, while the quality of a mass accretion history is defined as the maximum of the ratio , where and are, respectively, the masses of the progenitor and offspring at any adjacent outputs. An accretion history with progenitors much more massive than the offsprings is not well defined, because accretion should increase, rather than decrease the halo mass under normal circumstances. The scatter for the high-quality data is , and correspondingly. The reduction in the scatters suggests that part of the scatters is due to the inaccuracy in the NFW fitting and in the counting of halo mass.
It is worth repeating that the GIF haloes analyzed here have masses larger than , and are formed recently. This means that with these haloes we are actually probing quite different scales, formation times and cosmological models [ and ] from those in our high-resolution halo simulations. A very good agreement of our predictions with the GIF simulations reinforces the conclusion that our recipe is valid for both galaxy and cluster haloes, independent of the halo definitions and cosmological parameters. In a forthcoming paper (Zhao et al. 2002, in preparation), these conclusions are confirmed by new results from simulations with much higher mass resolution and in different cosmogonies.
As pointed out in the introduction, W02 have used a similar recipe to predict halo concentrations from mass-accretion histories. For comparison, we show the results using their method in the right panels of Fig. 8. The scatter around for the total sample and the high qaulity haloes is and respectively. The predicted based on the W02’s recipe is about 20 percent higher than the simulation results. We noted that the calibration of W02 was done for haloes of mass , while the haloes considered here are at least ten times more massive. The systematic offset may be caused by the different ranges of halo mass considered. After submitting this paper, we have analyzed several high-resolution simulations of particles in different boxsizes and different cosmogonies (Zhao et al. 2002, in preparation), where we not only have confirmed that the W02’s prediction is accurate for LCDM haloes of but also have found that the W02’s prediction is systematically higher for cluster haloes but lower for dwarf galactic haloes. Therefore, simply adjusting the calibration by multiplying a constant in the W02’s recipe does not work for haloes over a wide range of mass. The reason might be that, even in the late slow accretion phase, isn’t simply proportional to as W02 assumed. In fact, W02 also noticed that the increasing rate of is different for different halo populations, but they didn’t include it in their model, since otherwise a series of assumption about the increasing rate of should be made.
For the small fraction () of haloes where our calibration is not applicable (as mentioned earlier in this section), an exponential fit to the mass-accretion history can still return a value for the formation time, and so the calibration of W02 is still applicable. However, the formation times obtained for such cases are very uncertain, because they are obtained by the extrapolation of a small segment of the mass-accretion history.
5 Discussion
In this paper we have studied how the structural properties of CDM haloes are correlated with their mass-accretion histories. We have found a tight scaling relation between the inner mass and the inner scale radius and used this scaling relation to build a model to predict the structural properties of dark haloes from their mass-accretion histories. Comparing the model predictions with results from -body simulations show that our model is more accurate than related models proposed earlier based on simpler assumptions. Combined with halo merging trees constructed either from moderate resolution simulations or semi-analytical models, our recipe allows one to trace the evolution of the structural properties of dark haloes, and so is useful for constructing model realizations of galaxy formation in dark matter haloes.
Our results also provide important insights into the formation process of dark matter haloes in the CDM cosmogony, and so can help us to understand the structural properties of dark matter haloes. In agreement with W02, the formation of a dark halo are found to consist of an early phase of fast mass accretion, and a late phase of slow mass accretion. We have found that this two phases are separated at a time when the circular velocity at the inner radius is about equal to the halo circular velocity at the virial radius. We have shown that the formation process in these two phases have different properties. In particular, the inner structure and the potential associated with a halo are built up mainly in the fast accretion phase, even through large amount of mass can be accreted to the system in the slow accretion phase. Above all, we found that isn’t uniquely proportional to , and it grows more slowly when accretion is faster. This is quite different from the W02 recipe’s assumption.
It has been long speculated that the universal density profile of dark haloes may be due to violent relaxation in gravitational collapse (e.g. Lyden-Bell 1967; White 1996). Our results show that although violent relaxation may have played an important role in the formation of a dark halo in the fast accretion phase, the density profile in the slow mass-accretion phase cannot be attributed to this process. This is illustrated in Fig. 10, where we plot, for both the fast and slow accretion phases, the change in particle specific binding energy and the halo density structure over a time interval in which the halo mass increases by a factor of 3. As one can see, there is a tight correlation between the initial and final specific binding energies in the slow accretion phase. Furthermore, in the slow accretion phase, the accreted material retains its low binding energy (), and is added in the outer part of the halo without altering much the internal structure (see the upper right panel). In contrast, in the fast accretion phase, the accreted material is well mixed with the main progenitor in energy space (the low left panel), and the inner halo profile is significantly altered (the upper left panel). Note that even in the fast accretion phase which involves major mergers, there is still a significant correlation between the initial and final binding energies, suggesting that the violent relaxation is incomplete (see also Quinn & Zurek 1988; Zaroubi & Hoffman 1993). These results suggest that the universal density profile found for CDM haloes in -body simulations is not completely due to violent relaxation. Although violent relaxation may be responsible for the build-up of the inner structure of a halo, gentle accretion due to secondary infall also gives rise to an outer profile which matches the universal form. The reason for this is still unclear, but our results suggest that the universal profile should be understood at least in terms of violent relaxation and slow secondary infall.
Since in the standard model of structure formation, galaxies are assumed to form by gas cooling and condensation in dark matter haloes, our results also have important implications for galaxy formation. For a given halo, the free-fall time is roughly proportional to . Thus, in the fast accretion phase where the mass accretion rate is faster than the free-fall time, dark haloes can hardly establish dynamical equilibrium before another major merger occurs. If the merger progenitors contain gas, the cold gas component will not be able to settle into an equilibrium thin disk in the fast accretion phase, but rather is constantly disturbed and compressed by the merger. The situation resembles closely that in merger-driven starbursts observed in the local universe (see Sanders & Mirabel 1996 and references therein). Thus, associated with the early fast accretion phase may be an episode of rigorous star formation, which may be responsible for the formation of stars in galaxy bulges. The formation of galaxy disks may then be associated with the late slow accretion phase. The state of the gas in a protogalactic region may be significantly affected by the early star formation, and so the subsequent disk formation by secondary infall is expected to be influenced by the formation of bulge stars (see Mo & Mao 2002 for a detailed discussion).
As we have seen, the halo concentration parameter increases significantly with time in the slow accretion phase, and so haloes at high redshifts are expected to be less concentrated. This may have important consequence for the formation of disk galaxies in dark haloes. As shown in Mo, Mao & White (1998), for a galaxy disk formed in a NFW halo, the central surface density of the disk can be written as , where is the circular velocity of the halo, is the spin, is given by equation (6) and is a factor taking into account disk action. If were a constant, would decrease rapidly with time. This is not natural, because it requires the disk to re-adjust its structure in the inner region during the formation. If, on the other hand, halo concentration increases with time, as is found for haloes in the slow accretion phase, the change in the central structure of the disk is reduced.
Our results have also important implications for the understanding of the observed Tully-Fisher (TF) relation. Recent observations show that galaxy disks at modest redshifts () obey a TF relation similar to that for the disk galaxies in the local universe (e.g. Vogt et al. 1997; Ziegler et al. 2002). This would be difficult to understand in current theory, if the halo concentration parameter remained constant, because galactic haloes with a given circular velocity have masses proportional to , and so disks formed at higher redshifts are expected to be lighter (i.e. have lower TF zero point). However, as shown in Mo & Mao (2000), if galaxy haloes at high redshifts have lower concentrations, the boost of the maximum rotation velocity of the disk relative to the halo circular velocity is smaller. This can compensate for the decrease in the disk mass, and ensure that disks formed at different redshifts obey roughly the same TF relation [see Mo & Mao (2000) for a more detailed discussion].
acknowledgments
We thank the GIF group and the VIRGO consortium for the public release of their -body simulation data. We thank Frank van den Bosch and Saleem Zaroubi for stimulating discussions. DHZ thanks the CAS-MPG exchange program for support. The research work was supported in part by the One-Hundred-Talent Program, by NKBRSF (G19990754) and by NSFC (No.10125314).
References
- [] Blumenthal, G. R., Faber, S. M., Primack, J. R., & Rees, M. J. 1984, Nature, 311, 517
- [] Bryan, G. L. & Norman, M. L. 1998, ApJ, 495, 80
- [Bullock et al.(2001)] Bullock, J. S., Kolatt, T. S., Sigad, Y., Somerville, R. S., Kravtsov, A. V., Klypin, A. A., Primack, J. R., & Dekel, A. 2001, MNRAS, 321, 559
- [] Chen, D. N. & Jing, Y. P. 2002, MNRAS, in press (astro-ph/0201520)
- [Cole et al. 1994] Cole S., Aragon-Salamanca A., Frenk C. S., Navarro J. F., Zepf S. E., 1994, MNRAS, 271, 781
- [Davis et al.(1985)] Davis M., Efstathiou G., Frenk C. S., & White S. D. M. 1985, ApJ, 292, 371
- [Jing (2000)] Jing, Y. P. 2000, ApJ, 535, 30
- [Jing & Suto (2000)] Jing, Y. P. & Suto Y. 2000, ApJ, 529L, 69
- [Jing & Suto (2002)] Jing, Y. P. & Suto Y. 2002, ApJ, in press (astro-ph/0202064)
- [Jenkins et al.(2001)] Jenkins, A., Frenk, C.S., White, S.D.M., Colberg, J.M., Cole, S., Evrard, A.E., Couchman, H.M.P. & Yoshida, N. 2001, MNRAS, 321, 372
- [] Kauffmann, G., Colberg, J. M., Diaferio, A., & White, S. D. M. 1999, MNRAS, 303, 188
- [Kauffmann et al. 1993] Kauffmann G., White S. D. M., Guiderdoni B., 1993, MNRAS, 264, 201
- [Lacey & Cole(1994)] Lacey, C. & Cole, S. 1994, MNRAS, 271, 676
- [] Lyden-Bell D. 1967, MNRAS, 136, 101
- [] Mo, H. J., & Mao, S. 2000, MNRAS, 318, 163
- [] Mo, H. J., & Mao, S. 2002, MNRAS, in press
- [] Mo, H. J., Mao, S., & White, S. D. M. 1998, MNRAS, 295, 319
- [Navarro, Frenk, & White(1997)] Navarro, J. F., Frenk, C.S., & White, S. D. M. 1997, ApJ, 490, 493
- [] Peebles, P. J. E. 1982, ApJ, 263, L1
- [] Quinn, P. J., & Zurek, W. H. 1988, ApJ, 331, 1
- [] Sanders D.B., Mirabel I.F., 1996, ARA&A, 34, 749
- [Somerville & Primack 1999] Somerville R. S., Primack J. R., 1999, MNRAS, 310, 1087
- [] Vogt N.P., Phillips A.C., Faber S.M., et al., 1997, ApJ, 479, L121
- [Wechsler et al. (2002)] Wechser R. H., Bullock J. S., Primack J. R., Kravtsov A. V. & Dekel A. 2002, ApJ, 568, 52
- [] White, S. D. M., & Rees, M. 1978, MNRAS, 183, 341
- [] White S.D.M. 1996, astro-ph/9602021
- [] Zaroubi S., & Hoffman Y. 1993, ApJ, 416, 410
- [] Ziegler B.L., Böhm A., Fricke K.J., et al., 2002, ApJ, 564, L69