Echoes in X-ray Binaries
Abstract
We present a method of analysing the correlated X-ray and optical/UV variability in X-ray binaries, using the observed time delays between the X-ray driving lightcurves and their reprocessed optical echoes. This allows us to determine the distribution of reprocessing sites within the binary. We model the time-delay transfer functions by simulating the distribution of reprocessing regions, using geometrical and binary parameters. We construct best-fit time-delay transfer functions, showing the regions in the binary responsible for the reprocessing of X-rays. We have applied this model to observations of the Soft X-ray Transient, GRO J1655-40. We find the optical variability lags the X-ray variability with a mean time delay of 19.3 seconds. This means that the outer regions of the accretion disc are the dominant reprocessing site in this system. On fitting the data to a simple geometric model, we derive a best-fit disk half-opening angle of 13.5 degrees, which is similar to that observed after the previous outburst by ?. This disk thickening has the effect of almost entirely shielding the companion star from irradiation at this stage of the outburst.
keywords:
accretion, accretion discs - binaries: close - stars: individual:Nova Sco 1994 (GRO J1655-40) - ultraviolet: stars - X-rays: stars1 Introduction
X-ray binaries (XRBs) are close binaries that contain a relatively un-evolved donor star and a neutron star or black hole that is thought to be accreting material through Roche-lobe overflow. Material passing through the inner Lagrangian point moves along a ballistic trajectory until impacting onto the outer regions of an accretion disk. This material spirals through the disk, losing angular momentum, until it accretes onto the central compact object. X-rays are emitted from inner disk regions via thermal bremsstrahlung with an effective temperature . The X-ray flux depends on the mass transfer rate, which in turn depends on the structure of the disk and it’s ability to transport angular momentum. In XRBs the structure of the accretion disc is governed by irradiation.
Much of the optical emission in XRBs arises from reprocessing of X-rays by material in regions around the central compact object. The disk is highly ionized and out-shines the donor star. Light travel times within the system are of order 10s of seconds. Optical variability may thus be delayed in time relative to the X-ray driving variability by an amount characteristic of the position of the reprocessing region in the binary and the geometry of the binary. The optical emission may be modeled as a convolution of the lightcurve of the X-ray emission with a time-delay transfer function.
This time delay is the basis of an indirect imaging technique, known as echo tomography, to probe the structure of accretion flows on scales that cannot be imaged directly, even with current interferometric techniques. Echo mapping has already been developed to interpret lightcurves of Active Galactic Nuclei (AGN), where time delays are used to resolve photoionized emission-line regions near the compact variable source of ionizing radiation in the nucleus. In AGN the timescale of detectable variations is days to weeks, giving a resolution in the transfer functions of 1-10 light days (?; ?. In XRBs the binary separation is light seconds rather than light days, requiring high-speed optical and X-ray lightcurves to probe the components of the binary in detail. The detectable X-ray and optical variations in the lightcurves of such systems are also suitably fast. Extreme examples of this rapid variability are X-ray bursts, for example from Cygnus X-2 (?), where the X-ray flux can increase by 50 with a rise time of 2-3 seconds and a duration of 5 seconds. Time-delayed optical bursts have been seen clearly in the object 4U/MXB 1636-53 (?; ?; ?). Pulsed X-ray emission from Hercules X-1 produces faint optical pulsations that are thought to be echoes from the irradiated companion star (?).
Recently, ? found correlated time-delayed X-ray and UV variability in the lightcurves of the Soft X-ray transient GRO J1655-40, using RXTE and HST. The data, centred around binary phase 0.4, shows a mean time-delay of 14 seconds and an RMS delay of 10.5 seconds. The mean time delay is consistent with reprocessing in the outer regions of the accretion disk, while the relatively large range of delays suggests that there is relatively little companion star reprocessing. This may occur if a thick outer accretion disk shields the companion star from the X-ray source.
In this paper we present a simple geometric model for the time-delay transfer functions of XRBs, using a synthetic binary code. We analyse correlated X-ray and UV variability in GRO J1655-40, using our computed transfer functions, to constrain the size, thickness and geometric shape of the accretion disk.
Section 2 describes the features seen in typical optical lightcurves of LMXBs and how these affect our analysis. Section 3 describes the reprocessing of X-rays in XRBs in more detail, including the reasons for the time delays between the X-ray and optical variability. Section 4 describes the model created to describe the time delays found, while Section 5 describes an alternative method that uses Gaussian transfer functions. Section 6 shows the results of this analysis. This is followed by a discussion of the results in Section 7.
2 Optical lightcurves
The lightcurves of X-ray binaries contain many temporal and spectral features (see ? for a review of many of these), some periodic and others purely random or quasi-periodic in nature (See ? for a review). The periodic features, such as eclipses and the minima and maxima of lightcurves are due to the orbital motion of the components of the binary around the centre of mass of the system. These periodic features are relatively easy to model and much success has been made of such models in determining the geometric parameters of binaries using the information in multi-colour lightcurves. Refinements have been made to include effects such as limb darkening, caused by an decreasing source function with projected radius from the stellar core, and gravity darkening, which causes a change in temperature of the distorted shape of the roche-lobe filling star (eg. ?).
In the case of X-ray binaries the intense X-ray flux from the regions surrounding the compact object also affect both the periodic and non-periodic features of the observed optical lightcurves. In the standard model of reprocessing, X-rays are emitted by material in the deep potential well of the compact object. These photoionize and heat the surrounding regions of gas, which later recombine and cool, producing lower energy photons. Hard X-rays that penetrate below the photosphere emerge as continuum photons, with an energy distribution characteristic of the temperature of the photosphere. Soft X-rays that are absorbed above the photosphere emerge as emission line photons from a temperature inversion layer near the surface of the disk. Such irradiation will have the effect of changing the overall form of the orbital lightcurve as the aspect of the hot, irradiated regions changes with the binary orbit, this effect is very noticeable with the changing irradiation of the inner face of the companion star in Hercules X-1, during the 35-day precession phase of the tilted accretion disc (?). While these features are all vital in interpreting the long timescale orbital lightcurves of X-ray binaries, many of them are not important in this work, which deals with a very small range of binary phases (less than 1%).
The short duration of the observations is also important when considering the effects of other transient features, such as star spots, whose lifetime is much longer than the duration of our observation and whilst it will undoubtedly make a small effect on our model fits, the uncertainties involved in including them far outweigh any benefits to the model from including them.
In our model, we have assumed that all the optical variability is in fact caused by the reprocessing of X-ray irradiation. Furthermore, we have assumed that the thermal component will dominate the reprocessed emission in our broadband observations. These assumptions are clearly not strictly true, observations of cataclysmic variables and other interacting binaries, where irradiation is no longer the dominant source of optical emission, also show non-periodic optical variability superimposed on the periodic orbital lightcurves (eg. the Nova-like AE Aquarii, ?). However, while such non-correlated features will introduce noise into out analysis, thus increasing the absolute value of the badness-of-fit of our models, they will have little effect on the relative values, which have contributions from all points in the lightcurve. Similarly, the optically thin emission is only a small fraction of the total broadband emission and for this reason is assumed to vary in phase with the thermal emission.
3 Reprocessing of X-rays
The reprocessed, optical emission seen by a distant observer is delayed in time of arrival relative to the X-rays by two mechanisms. The first is a finite reprocessing time for the X-ray photons and the second is the light travel times between the X-ray source and the reprocessing sites within the binary system.
3.1 reprocessing times
The average reprocessing time for line photons is given by the average recombination time, (?)
| (1) |
In the accretion disk the high electron density, cm-3, ensures that the time-scale for reprocessing of line photons is short compared to the overall time delay.
The continuum photons which scatter from deeper within the accretion disk undergo a ‘random walk’ before escaping through the photosphere, leading to a longer reprocessing time. The exact determination of this continuum reprocessing time is complicated, requiring detailed model atmosphere calculations, which is outside the scope of this paper. However, the short time delays between X-ray and optical bursts (?) and the observations of 1.24 second optical pulsations from Hercules X-1 (?), imply that a significant fraction of the reprocessed optical photons emerge from the reprocessing site within seconds of the absorption of the incident X-ray photons. This delay is smaller than the measured uncertainty in the mean delay for the systems and so we have treated the reprocessing as instantaneous. We have also treated the reprocessing of X-rays as “passive” reprocessing, where the absorbed X-rays do not affect the structure of the material in the binary.
3.2 light travel times
The light travel times arise from the time of flight differences for photons that are observed directly and those that are reprocessed and re-emitted before traveling to the observer. These delays can be up to twice the binary separation, obtained from Kepler’s third law,
| (2) |
where is the binary separation, and are the masses of the compact object and donor star, is the orbital period. In LMXBs the binary separation is of the order of several light seconds.
The time delay at binary phase for a reprocessing site with cylindrical coordinates (R, , Z) is
| (3) |
where is the inclination of the system and is the speed of light. This can also be expressed using the position vector, and the unit vector, , pointing toward the earth,
| (4) |
The X-ray driving lightcurve, , is described as the sum of a constant and a variable component,
| (5) |
The reprocessed lightcurve, , is similarly divided into two components. The relationship between the two is given by
| (6) |
where is the time delay transfer function. This transfer function is the strength of the reprocessed variability delayed by relative to the X-ray variability.
The dynamic response function is found by considering how a change in X-ray flux drives a change in the reprocessed flux. We can define the dynamic time delay transfer function to be,
| (7) | |||||
where is the geometric time delay of a reprocessing site at position , see Equation 3. In the next section we describe the model X-ray binary code we have been using and how we have used this to find the reprocessed flux.
4 Model X-ray Binary code
We have developed a code to model time delay transfer functions based on determining the contributions from different regions in the binary. In this section we describe the models used to construct the individual regions of the binary; the donor star, the accretion stream and the accretion disk. The code uses distances scaled to the binary separation in a right-handed Cartesian coordinate system corotating with the binary. The X-direction is along the line of centres for the binary, the Y-direction is perpendicular to this in the orbital plane of the binary, so that the X-ray source is at (0,0,0) and the centre of mass of the donor star is at (1,0,0). Each surface element is a triangles, characterized by its area , orientation , position and temperature .
We calculate the total monochromatic flux by summing up contributions from all visible elements. The area and the normal vector for the triangular panel are calculated and then the projected area of the panel is calculated using the projected earth vector e̱(,). The effects of occultations by regions in the binary are also considered. Therefore the observability, , is given by,
| (8) |
which is the foreshortened area of pixel , observable at phase . This is related to the solid angle of the observed pixel, by the relation
| (9) |
where is the distance to the source. If then the panel is not visible to the observer and does not contribute to the flux. The monochromatic intensity is calculated using the Planck function,
| (10) |
This is scaled using the projected area of the panel , as seen by the observer. The standard linear limb-darkening law is assumed,
| (11) |
where is the linear limb-darkening coefficient, assumed to be 0.6, and is the angle between the normal vector and the earth vector e̱(,),
| (12) |
The response curve for a given detector, , is combined with the limb-darkened Planck function to create the synthetic reprocessed flux from each visible triangular element. The total detected flux due to reprocessed X-rays from a single panel, , is given by,
| (13) |
where and are the expressions for the limb-darkening and the solid angle of the exposed panel, see equations 11 and 9 respectively. In the next sections we describe the geometric model used to calculate the time delay for a given panel and the effects of irradiation which are used to determine the contribution of each panel to the final transfer function.
4.1 Donor Star
The donor star is modeled assuming it fills its critical Roche potential, so that mass transfer occurs via Roche lobe overflow through the inner Lagrangian point. Optically thick panels are placed over the surface of the Roche potential. The panels are triangular so that the curved surfaces of the binary are mapped more accurately than is possible using 4-sided shapes (?). These panels are equally spaced in longitude and latitude across the surface of the star. In order to correctly specify the temperature of each panel on the face of the tidally distorted star, one must take into account the degree of gravity darkening. Using von Zeipel’s theorem (?), for the relationship between the local gravity and the local emergent flux one finds that the relationship between the local temperature, , and the gravity, , is
| (14) |
As a consequence the temperature at any point on the star is given by
| (15) |
where and are the temperature and gravity of the pole of the star. The “gravity darkening exponent” is 0.25 for stars with fully radiative envelopes (?; as is the case in our models) and 0.08 for stars with fully convective envelopes (?). is taken to be the effective temperature of a field star with a similar spectral type to the donor star.
4.2 Accretion stream
The accretion stream is modeled by following the ballistic trajectories of 4 test particles. The thickness (w) of the stream defines the initial positions of the test particles. These test particles determine the ‘width’ of the stream (Its deviation from the line of centres of the binary, in the plane of the binary, or y-direction) and the ‘height’ of the stream (it’s extent in the direction normal to the plane of the binary, the z-direction), assuming the stream is symmetric about the x-y plane.
The particles start at the L1 point with a small velocity in the direction of the compact object (-v,0,0), from positions (R(L1),0,0), (R(L1),w,0), (R(L1),-w,0) and (R(L1),0,w). The trajectory is cut into discrete steps, with the step size as a parameter of the code. The velocity and position of each particle are determined from the Roche potential after each step. The stream is curtailed when one of two criteria are reached; (1) the stream has collapsed vertically, or (2) the core trajectory is moving outwards, ie. the stream has passed the compact object without collapsing vertically.
The unirradiated accretion stream is assumed to have a constant temperature along it’s length and the effects of irradiation are considered in the same way as those of the donor star in Section 4.4.
4.3 Accretion disk
The disk thickness is assumed to increase with radius from 0 at to H at , with the form,
| (16) |
where the parameters are the inner and outer disk radii, and in units of R(L1), the half thickness of the outer disk and the exponent which describes the overall shape of the disk. The temperature structure of the un-irradiated disk is that of a steady state disk, in the absence of irradiation,
| (17) |
where is the temperature at the outer disk and is the temperature of the inner disk.
The disk is divided radially and azimuthally, into and sections. The monochromatic intensity is again calculated using the Planck function, corrected for limb-darkening using a linear limb-darkening law, with a constant coefficient. The intensity is again scaled using the projected area of the panel, for the given values of binary phase and inclination .
4.4 Irradiation model
The effective temperature of a region at a distance R from the X-ray source, assumed in our model to be a point source located at the centre of the accretion disk, is found from the accretion luminosity for a typical LMXB,
| (18) |
and
| (19) |
where is the temperature, A is the albedo, is the efficiency, , the mass of the compact object, the accretion rate onto the compact object, is the size of the compact object and R is the distance between the compact object and the irradiated element. This is normalised using the binary separation, a, the distance between the centres of mass of the stars, as is the coordinate system for the binary. In the case of Scorpius X-1, this gives for a 1.4 neutron star () accreting , with an efficiency , an albedo of 0.5, at a distance equal to the binary separation of 3.4 x cm.
The irradiation of the binary takes place in three stages. The first stage is to calculate the temperature structure of the binary in the absence of any irradiation. This is done with characteristic temperatures for the donor star (from it’s spectral type) and the accretion stream and disk. The temperature structure of the disk is assumed to that for an unirradiated disk as given in equation 17. The surface elements of the binary exposed to X-rays are determined by projecting the binary surfaces onto a spherical polar representation of the sky, as it appears from the X-ray source. Each triangular element is mapped to the sky starting with the one furthest from the source and ending with the triangle closest. Those elements remaining visible and unocculted on the sky map are irradiated. The change in effective temperature of an element is scaled by the projected area with respect to the X-ray source at a distance R from the source. Hence the temperature after irradiation is given by,
| (20) |
where is the temperature of the panel, the angle between the line of sight from the central source and the normal to the surface of the element and is the unirradiated effective temperature of the panel.
Since we are interested in finding the correlation between the variable component of the X-ray and reprocessed fluxes, we split the X-ray flux into constant and time-dependent components. These components of the flux are converted into components of temperature,
| (21) |
where
| (22) |
The second stage is to irradiate the binary with the constant component of the X-ray flux. This component of the X-ray flux is equated to the mean effective temperature of the X-ray source, as given in equation 20, where . The third and final stage is to repeat stage two with , which represents irradiating the binary with a time varying component. The difference between stages two and three represents the temperature change of the elements due to the time varying component of the X-ray flux alone, .
Thus the response of a panel to the variable component of the irradiating X-ray flux is given by,
| (23) | |||||
This response is substituted into the expression for the dynamic response given in equation 7.
4.5 Transfer functions
In order to transform the reprocessed flux into a time delay transfer function, we define iso-delay surfaces. These surfaces are nested paraboloids around the line of sight to the X-ray source, defined by the earth vector, e̱(,). The parabolic surfaces have a mean time delay and a width . The mean time delay in seconds between the directly observed X-ray flux from the central source and the reprocessed signal from a point with cylindrical coordinates (R,,Z) is
| (24) |
where is the inclination of the system, is the binary phase and is the angle from the line of centres of the binary.
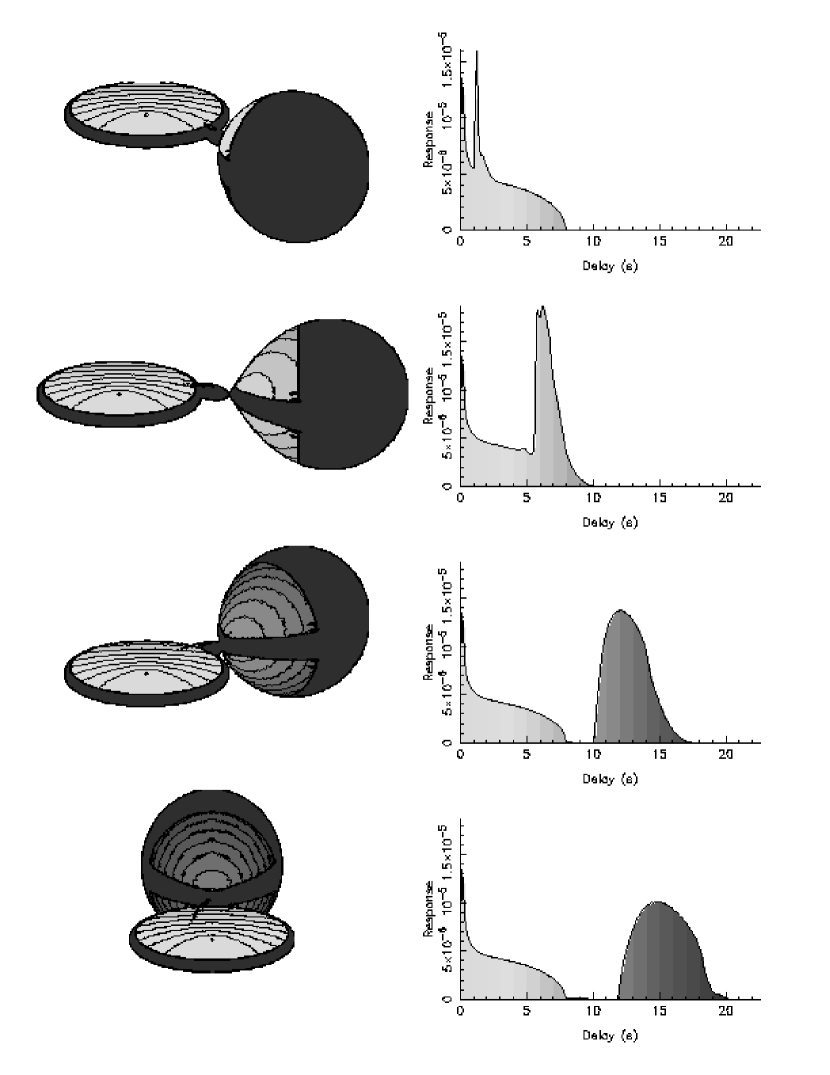
We consider models with reprocessing taking place in the accretion disk, accretion stream and companion star. Each of these regions makes a contribution to the transfer function for the system, see Figure 1 for a diagram of the results of our code and the calculated transfer functions.
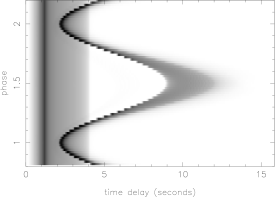
The phase dependence of allows us to create time-delay transfer functions as a function of binary phase, allowing us to produce phase-delay diagrams for the system, see figure 2. X-rays reprocessed at the companion star have a time delay that varies sinusoidally in phase with semi-amplitude around a mean value . X-rays reprocessed by a circular disk appear as a phase independent contribution to the delay distribution between the inner and outer radii of the disk. The accretion stream shows up as a non-symmetric contribution that varies roughly sinusoidally with the orbital motion of the companion star and can be seen faintly in Figure 2 as the contribution near superior conjunction between the outer rim of the disk and the inner-face of the companion star.
The relative intensities of the contributions, represented by the area under the transfer function, constrain the geometric parameters of the system, especially the contribution from the accretion disk, which is probably the most important region for reprocessing of X-rays in interacting binaries.
Thus the shape of the iso-delay surfaces when projected onto the plane of the binary depends on the inclination of the system. For a face-on disk () the projected iso-delay surfaces are simple circles on the disk. As the inclination of the system increases these surfaces become elongated along the line of sight to the X-ray source, until finally they form parabolae if viewed from edge-on (). This inclination dependence is shown in the transfer functions in Figure 3.
The peak in these transfer functions is also a function of inclination, with the peak occurring with the time delay of the largest iso-delay surface that is contained entirely within the disk,
| (25) |
where is the opening angle at the edge of the disk, .

The disk shape, characterized by the exponent , also affects the position and shape of the peak in the transfer function. The contribution is scaled with the projected area of the surface element, therefore as increases the peak should move to longer time delay, as the edge of the disk becomes steeper and the projected area decreases. This can be seen in figure 4, where time-delay transfer functions are plotted as a function of with values between 1.01 and 3. (Note: When =1, the surface of the disk is flat, whose thickness goes to zero at the position of the compact object, therefore the projected area of the disk as seen from the compact object is zero, except on the inner edge. For this reason is given a value just greater than 1 to show the limit as tends towards the case of an un-flared disk.)

5 Gaussian transfer functions
In paper I Gaussian time delay transfer functions were used to create synthetic reprocessed lightcurves for the SXT GRO J1655-40. This is a relatively simple form of transfer function as it assumes nothing about the geometry of the system. These transfer functions have the form,
| (26) |
Thus the transfer functions have three parameters, the mean time delay , it’s variance and the strength of the response . These transfer functions were convolved with the X-ray driving lightcurve in the same way as the model transfer function and the badness of fit between the synthetic and real reprocessed lightcurves calculated.
The equivalent parameters and can be determined for any transfer function, by calculating the first and second moments.
| (27) |
| (28) |
| GRO | |||
| Parameter | symbol | unit | J1655-40 |
| Distance | D | kpc | 3.2 |
| Period | P | days | 2.6 |
| Inclination | deg. | 69.5 | |
| Mass ratio | q | 0.3344 | |
| Primary mass | 7.02 | ||
| Binary sep. | a | cm | 12 |
| Star Temp | K | 6500 | |
| Stream Temp | K | 5000 | |
| Outer Disk | K | 6000 | |
| Inner Disk | K | 100000 | |
| Irrad Temp | K | 105 | |
| Inner radius | R() | 10-4 | |
| Outer radius | R() | free | |
| Disk thickness | H/R | free | |
| disk exponent | free |
6 Observation and data reduction
The Soft X-ray Transient (SXT) GRO J1655-40 was discovered in 1994 July when the Burst and Transient Source Experiment (BATSE) on GRO observed it in outburst at a level of 1.1 Crab in the 20–200 keV energy band (?). After a period of apparent quiescence from late 1995 to early 1996, GRO J1655-40 went into outburst again in late 1996 April (?), and remained active until 1997 August. During the early stages of this outburst we carried out a series of simultaneous HST and RXTE visits. One of the primary goals of this project was to search for correlated variability in the two wavebands. The long-term evolution of this outburst argued against significant reprocessing, as the seemingly anticorrelated optical and X-ray fluxes observed (?) are not to be expected if the optical flux is reprocessed X-rays. Nonetheless, significant short term correlations were detected. In our previous paper (?) we have analyzed these correlations using both acausal and causal Gaussian transfer functions. We were able to put constraints on the possible regions responsible for X-ray reprocessing. In this paper we summarize this previous analysis and develop it further, using our synthetic binary model to create more physical transfer functions.
6.1 observations
The HST and RXTE observations used in this paper were first presented, along with similar exposures, in [Hynes et al. 1998b]. In paper I we fitted causal and acausal Gaussian transfer functions to 4 similar exposures in a similar analysis as used in the previous section. The time-delay distribution based on all the observations is 14.6 1.4 seconds, with a dispersion of 10.5 1.9 seconds.
6.1.1 HST
The HST observations are shown in figure 1(b) of paper I, along with a detailed description of the data reduction techniques used. In this paper we have used one of the observations, referred to as exposure 6, shown in Figure 1(b) in [Hynes et al. 1998b] and reproduced in this paper as figure 5. This observation took place during the June 8 1996 visits, using The Faint Object Spectrograph in RAPID mode with the PRISM and blue detectors (PRISM/BL), covering the spectral range Å. The resulting lightcurve has a time resolution of seconds, the absolute time accuracy of this data is limited to 0.255 seconds.
6.1.2 RXTE
The X-ray data was taken with the PCA onboard RXTE on June 8 1996, simultaneous with the HST data. The lightcurve was created from the standard-1 EDS mode data, using the saextrct task in the ftools software package. This mode has a maximum time-resolution of 0.125s, but with no spectral resolution. It is desirable for echo-mapping for the driving X-ray lightcurve to have a higher time resolution than the reprocessed one, so that the time delay transfer function can have a time resolution greater than the time resolution of the reprocessed lightcurve. A lightcurve with a time resolution of 1s and an absolute timing accuracy of about 8 s was extracted. For a full description of the data, see paper I.

6.2 results of modeling
6.2.1 Gaussian transfer functions
The results for the fits to the acausal Gaussian transfer functions are described in depth in paper I and summarized in this paper in Table 2, together with their 1-parameter 1-sigma confidence regions, in order to compare them to the results from our modeling of the X-ray binary. The mean and rms values for the delay in the Gaussian transfer function represent the first and second moments expected for the model transfer functions. The best fit Gaussian transfer function for exposure 6 has a mean delay of 19.3s with an rms delay 10.8s. ? interpreted this result as evidence for reprocessing in the outer regions of a thick accretion disk that could be thick enough to shield the companion star from significant irradiation. If this were not the case and we had considerable disk and companion star reprocessing we would expect the variance of the transfer function to be much higher.
| Dataset | Exp. 6 |
|---|---|
| 0.42 | |
| N | 782 |
| /(N-3) | 1.230 |
| 19.3 2.2 | |
6.2.2 synthetic binary transfer functions
| Dataset | Exp. 6 |
|---|---|
| 0.42 | |
| N | 782 |
| /(N-4) | 1.230 |
| H/R | |

The transfer functions created by our X-ray binary model, using the binary parameters determined by ? and summarized in Table 1 were used to create synthetic HST lightcurves by convolving them with the RXTE lightcurves. The badness of fit between this synthetic reprocessed lightcurve and the real reprocessed lightcurve, from the HST observations was calculated. The fitting again contained 3 parameters, which were optimized as before. The best-fit parameters, together with their 1-parameter 1-sigma confidence regions are given in Table 3. We find that the disc extends to 67 percent of the distance to the inner Lagrangian point, with an opening angle of 14 degrees and an exponent of 3.8.
6.2.3 comparison of the two models
This best-fit solution from our modeling is shown along with the best-fit solution from the acausal Gaussian fitting in Figure 6. The best-fit solution for this modeling shows a similar to the Gaussian fitting, which shows that our modeling of the binary system and simple Gaussian fits are both good fits to the data. The first and second moments from the model transfer function are, as expected, similar to the best fit parameters from the Gaussian fitting. The opening angle for the disc from our synthetic transfer functions, whilst being surprisingly large is comparable with that derived by ? from lightcurve fitting shortly after the previous outburst in March 1995. They found that the opening angle of the disc was 11∘(see Table 6 from ?) compared to our value of 14∘.
7 discussion
We have used the correlated X-ray and optical variability seen in Low Mass X-ray Binaries to determine geometric parameters for the binary system GRO J1655-40. These parameters are principally the size and shape of the accretion disk. This is inferred from the relative contributions to the time delay transfer function of the different regions of the binary. We have used time delay transfer functions, along with the known binary parameters to find best fit solutions to the data along with their corresponding confidence regions.
There is evidence for a larger fraction of disk reprocessing. The geometric parameters determined from our fit give an opening angle of 19 degrees and a very flared geometric shape, implying that most of the reprocessing is taking place in the outer regions of the disc. This means that the companion star is almost entirely shielded from X-rays, which in turn reduces the mass accretion rate, which is driven by irradiation. The observations of GRO J1655-40 took place during outburst, which could explain the flared shape of the outer disk. Another possible interpretation is that there is a localized region of enhanced reprocessing in the outer disk that is non-axisymmetric that is adding a large component from the outer disc region to the transfer function but is difficult to distinguish from reprocessing from a thick disk. This would explain the high value of observed, as the model attempts to move all the reprocessing to the outer disk. The most likely site for this reprocessing would be at the disk-stream interaction point, where the rim of the disk swells greatly. This inhomogeneity is observed in GRO J1655-40 as X-ray dips around binary phase 0.8. This is the site proposed for the reprocessing of the X-ray bursts seen in 4U/MXB 1636-53 (?).
The effect of reprocessing timescales in different regions of the binary also needs to be studied in more detail, with detailed radiative transfer models. The incidence angle of the X-rays to the atmosphere may cause large variations in the timescale. Normally incident X-ray photons may be reprocessed deeper within the companion star and hence take longer to diffuse to the surface, than those with a grazing incidence angle. This would also affect the ratio of disk to companion star reprocessing, as the incidence angles for the disk will be predominantly grazing.
In order to distinguish between these scenarios and determine the importance of reprocessing timescales it is necessary to have data with better phase coverage to observe a change in the time delay of this enhanced region as a function of binary phase and any reprocessing timescale effects. It is clear from our analysis that the companion star is responsible for a small fraction of the instantaneously reprocessed flux, see figure 6.
This is the first data showing correlated X-ray and optical variability with sufficient time resolution and a long enough base-line to do this form of echo-tomography. We have used the time delayed optical variability observed from GRO J1655-40 to constrain the binary parameters of these systems and find that both the accretion disk and companion star can be important regions for reprocessing in XRBs.
Acknowledgments
KOB was supported by a PPARC Research Studentship during much of this work. Support for this work was also provided by NASA through grant numbers GO-6017-01-94A from the Space Telescope Science Institute, which is operated by the Association of Universities for Research in Astronomy, Incorporated, under NASA contract NAS5-26555 and NAS5-32490 for the RXTE project. This work made use of the RXTE Science Center at the NASA Goddard Space Flight Center and has benefitted from the NASA Astrophysics Data System Abstract Service. We would also like to thank the anonymous referee for many useful comments and suggestions.
References
- Boynton et al. 1973 Boynton P. E., Canterna R., Crosa L., Deeter J., Gerend D., 1973, ApJ, 186, 617+
- Chester 1979 Chester T. J., 1979, ApJ, 227, 569
- Harmon et al. 1995 Harmon B. A. et al., 1995, Nat, 374, 703+
- Horne, Welsh & Peterson 1991 Horne K., Welsh W. F., Peterson B. M., 1991, ApJ, 367, L5
- Hummer & Seaton 1963 Hummer D. G., Seaton M. J., 1963, MNRAS, 125, 437
- Hynes et al. 1998a Hynes R. I. et al., 1998, MNRAS, 300, 64
- Hynes et al. 1998b Hynes R. I., O’Brien K., Horne K., Chen W., Haswell C., 1998b, MNRAS, 299, L37, Paper I
- Krolik et al. 1991 Krolik J. H., Horne K., Kallman T. R., Malkan M. A., Edelson R. A., Kriss G. A., 1991, ApJ, 371, 541
- Kuulkers, van der Klis & van Paradijs 1995 Kuulkers E., van der Klis M., van Paradijs J., 1995, ApJ, 450, 748
- Lawrence et al. 1983 Lawrence A. et al., 1983, ApJ, 271, 793
- Lucy 1966 Lucy L. B., 1966, Zeitschrift Astrophysics, 65
- Matsuoka et al. 1984 Matsuoka M. et al., 1984, ApJ, 283, 774
- Middleditch & Nelson 1976 Middleditch J., Nelson J., 1976, ApJ, 208, 567
- Orosz & Bailyn 1997 Orosz J. A., Bailyn C. D., 1997, ApJ, 477, 876
- Pedersen et al. 1982 Pedersen H. et al., 1982, ApJ, 263, 325
- Remillard et al. 1996 Remillard R., Bradt H., Cui W., Levine A., Morgan E., Shirey B., Smith D., 1996, IAU Circ, 6393, 1+
- Rutten & Dhillon 1994 Rutten R., Dhillon V., 1994, A&A, 288, 773
- van der Klis 2000 van der Klis M., 2000, ARA&A, 38, 717
- van Paradijs & McClintock 1995 van Paradijs J., McClintock J. E. X-ray binaries, chapter 2, Cambridge University Press, 1995
- Welsh, Horne & Oke 1993 Welsh W. F., Horne K., Oke J. B., 1993, ApJ, 406, 229
- Zeipel 1924 Zeipel H. V., 1924, MNRAS, 84, 665+