XMM-Newton observations of the spiral galaxy M 74 (NGC 628)
Abstract
The face-on spiral galaxy M 74 (NGC 628) was observed by XMM-Newton on 2002 February 2. In total, 21 sources are found in the inner 5′ from the nucleus (after rejection of a few sources associated to foreground stars). Hardness ratios suggest that about half of them belong to the galaxy. The higher-luminosity end of the luminosity function is fitted by a power-law of slope . This can be interpreted as evidence of ongoing star formation, in analogy with the distributions found in disks of other late-type galaxies. A comparison with previous Chandra observations reveals a new ultraluminous X-ray transient ( in the 0.3–8 keV band) about 4′ North of the nucleus. We find another transient black-hole candidate ( ) about 5′ North-West of the nucleus. The UV and X-ray counterparts of SN 2002ap are also found in this XMM-Newton observation.
1 Introduction
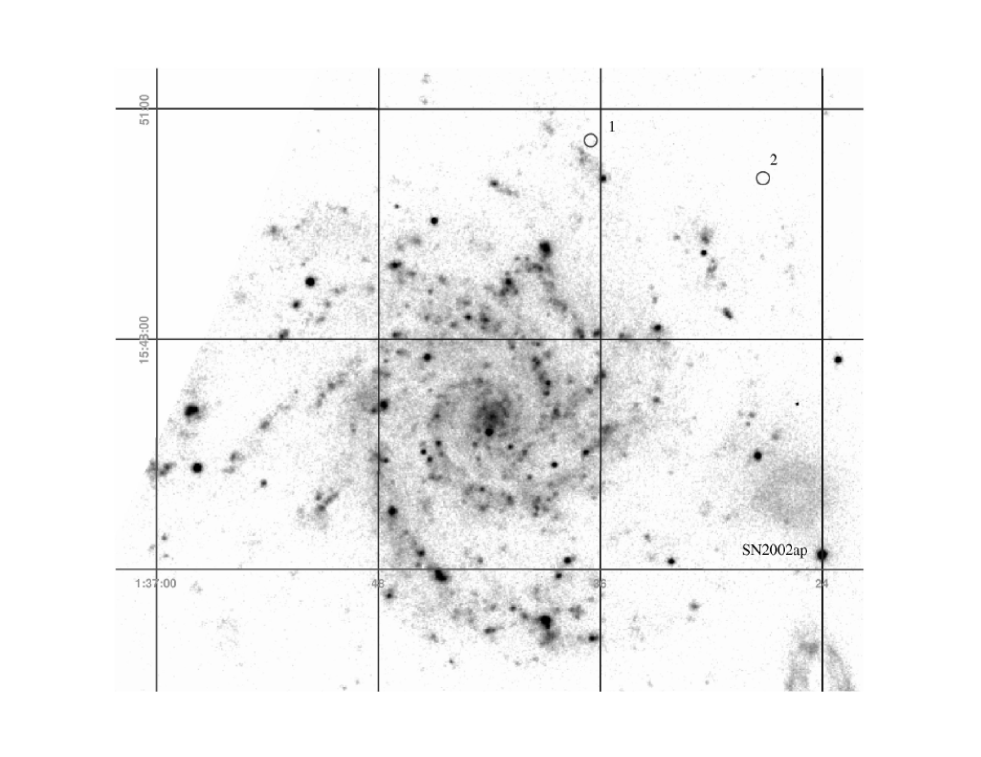
M 74 (NGC 628) is an SA(s)c galaxy, seen almost face-on (inclination angle –, Shostak and van der Kruit 1984) at a distance of 9.7 Mpc (Tully 1988). It was observed by XMM-Newton on 2002 February 2, four days after the discovery of SN 2002ap (Nakano 2002) in the galaxy. In this Letter, we present the first results (including the luminosity function of X-ray sources, discovery of several luminous X-ray transients and the UV and X-ray counterparts of SN 2002ap) from this observation.
2 Observations and Data Reductions
The XMM-Newton instrument modes were full-frame, thin filter for the three EPIC cameras, and the UVW1 filter for the OM. The full time interval of the EPIC exposure is 34 ks. After rejecting intervals with a high background level, we considered a good time interval of 28 ks for our study. The exposure time for OM is 2.5 ks. The data were extracted and analyzed with the SAS version 5.2. We also compared our XMM-Newton observations with two Chandra observations taken on 2001 June 19 and 2001 October 19. The exposure time of both Chandra observations is about 47 ks. A full analysis of the Chandra data will be presented in a paper currently in preparation.
3 Luminosity distribution of the X-ray sources
Twenty-one sources are detected by XMM-Newton/PN within 5′ from the galactic nucleus (not including a couple of sources coincident with foreground stars.) Eighteen of those sources were also found by Chandra in 2001 (one of them is in fact resolved into a close pair of sources by Chandra). However, three sources were not, and are likely to be transient. The completeness limit for the PN sources is cts s-1 in the 0.2–14 keV band. Assuming a power-law spectrum with and column density cm-2, this corresponds to a flux of , and an emitted luminosity of .
Some of the 21 sources found inside the inner 5′ may be background AGN, seen through the disk of the galaxy, and therefore highly extincted. We can estimate the relative contribution of background sources by using the number counts from the Chandra Deep Field North survey (Brandt et al. 2001) in the 2–8 keV band (where absorption is not important). We obtain that about half of the sources should be attributed to the background, at the completeness limit for the PN in the 2–8 keV band (flux of ).
We can estimate the minimum total column density of hydrogen that would be between us and a background AGN, and use the observed hardness ratios to decide which sources are more likely to belong to the galaxy. By combining H I (Shostak & van der Kruit 1984) and CO (Adler & Liszt 1989) radio observations, and using a standard CO-to-H2 conversion factor (Bloemen et al. 1986), we infer that the total column density H I goes from cm-2 in the inner 30″ to cm-2 at a distance of 4′, and cm-2 at 5′. To this, we need to add a foreground Galactic H I column density cm-2 (Dickey & Lockman 1990). Hence, we expect that background AGN would be seen through a total column density cm-2.
Defining as S and H the PN count rates in the (0.2–1.5) and (1.5–14) keV bands respectively, we obtain hardness ratios HR (HS)/(HS) for the detected sources. For a source with a power-law spectrum with , typical of an AGN, HR if cm-2, and HR if cm-2. We have therefore taken HR as an empirical criterion to identify sources very likely to belong to M 74, while we cannot tell whether harder sources are background AGN or highly absorbed M 74 objects.
Nine of the 12 brightest sources detected with PN have HR , hence we conclude that they are genuine M 74 objects. Figure 1 shows the cumulative luminosity function log[N(S)]–log S for all the sources, and for the 9 sources with a most likely galactic origin. The latter curve can be fitted with a simple power law of index . This is similar to the slope at the high-luminosity end of the luminosity function for the disk population in spiral galaxies such as M 81 (Tennant et al. 2001) and M 101 (Pence et al. 2001). We shall present a detailed discussion of the position, luminosity and hardness ratios of all XMM-Newton and Chandra sources in a forthcoming paper.
4 Spectral Analysis of Individual Sources
4.1 A new Ultraluminous X-ray Transient
The brightest source in the field of M 74, located at R.A. 1h 36m 36s.5, Dec. 15∘ 50′ 36″ (J2000), is one of the three sources found by XMM-Newton but clearly below the detection limit ( ) of both Chandra observations. Energy spectra were extracted with the SAS task xmmselect and were analyzed with XSPEC version 11. We extracted data in PN from a circle of ″ centered on the source, and the background from an annulus with inner and outer radii of ″ and ″, respectively. For the MOS images, in which the source is near the chip boundary, we took two source-free regions (″ radius each) near the source for the background. In order to allow statistics to be used, all the spectra were binned such that the signal-to-noise ratio . We fitted the PN and MOS2 data simultaneously with several spectral models: power-law, black-body power-law, thermal bremsstrahlung, disk blackbody, and the bmc comptonisation model, in all cases with interstellar absorption.
All models provide statistically acceptable fits to the data ( 1; Table 1). The single power-law model yields a somewhat high column density compared to the values (foreground Galactic plus intrinsic) expected at that galactic radius. In contrast, the disk blackbody model (Mitsuda et al. 1984), and the bmc model (Shrader & Titarchuk 1999) provide lower values of . Physically, the comptonization model represents a two-component spectrum, with a soft blackbody component from the accretion disk and a power-law tail at higher energies, produced by inverse-Compton scattering of the soft photons by high-energy electrons. The best-fitting bmc model is shown in Figure 2. Neither the bmc nor the blackbody power-law fits can simultaneously constrain the column density and the temperature of the thermal component.
The X-ray luminosity of XMMU J013636.5155036 is significantly above the Eddington limit for a accreting neutron star ( ). With the disk-blackbody model, the best-fitting parameters of keV and km imply a 0.3–8 keV luminosity of about . The bmc model yields an emitted luminosity of .
4.2 Other individual sources
There is another bright X-ray transient at R.A. 1h 36m 27s.2, Dec. 15∘ 50′ 05″ (J2000); it was not seen in either Chandra observations. Its spectrum can be well fitted with a simple power law with photon index of , cm-2. The emitted 0.3–8 keV luminosity is about , which makes it a likely stellar-mass black hole (BH) candidate. Compared to Galactic X-ray transients during outbursts, the spectrum of this source is relatively hard, although the errors are too large to constrain the exact spectral shape. Hard X-ray transients are seen in other external galaxies such as M 31 (Trudolyubov, Borozdin, & Priedhorsky 2001; Kong et al. 2002) and M 81 (Ghosh et al. 2001).
A third possible transient, detected by XMM-Newton but not Chandra, is located at R.A. 1h 36m 38s.6, Dec. 15∘ 44′ 20″ (J2000). With a PN count rate of cts s-1, it is too faint for a spectral analysis. Assuming a power-law spectrum with , and column density cm-2, its emitted luminosity is in the 0.2–14 keV band. The nucleus of the galaxy is detected at a count rate of cts s-1, which corresponds to a luminosity of for the assumed spectral model.
Finally, the X-ray counterpart of SN 2002ap (Nakano 2002) is detected at a count rate of cts s-1. (Count rates in the two bands: S cts s-1; H cts s-1). This corresponds to for thermal plasma emission at 0.5 keV, or for a thermal Bremsstrahlung at 2 keV. SN 2002ap is also clearly detected in the OM image (Figure 3). We measure a flux Å-1, at an effective wavelength of 291 nm, on MJD 52307.0153.
5 Discussion
5.1 X-ray luminosity function in galactic disks
The cumulative luminosity function is a useful tool for studying populations of X-ray sources in galaxies. In some cases, it is a broken power-law, with a change in slope at luminosities varying between a few times and a few times . In other galactic environments, the slope is constant from the detection limit to the high-luminosity end. A relation between the star-formation history of a galaxy and the evolution of its X-ray luminosity function has been proposed by Wu (2001) and Kilgard et al. (2002). Assuming that the brightest X-ray sources also have the shortest life, the luminosity function develops a break at its bright end in the absence of ongoing star formation. This is usually the case in elliptical galaxies and in the bulges of spiral galaxies. The break evolves towards lower luminosities over time. An unbroken power-law shape can instead be sustained if the X-ray source population is continuously replenished by star formation processes, as is the case for example in the arms of spiral galaxies.
In this scenario, the unbroken power-law luminosity function observed in the late-type spiral M 74 is consistent with recent or ongoing star formation. Previous optical and UV studies (Cornett et al. 1994) have shown evidence for recent star formation in this galaxy, probably not uniformly across the disk. They have also shown that the optical/UV colors of M 74 are intermediate between those of M 33 (bluest, with more recent star formation) and of the M 81 bulge (with an older stellar population). A comparison between the luminosity functions of these three galaxies is left to a work in preparation.
5.2 The nature of XMMU J013636.5155036
Objects with an X-ray luminosity – are often called ultraluminous X-ray sources (ULXs; e.g., Makishima et al. 2000; Kaaret et al. 2001; Matsumoto et al. 2001). The X-ray spectra of ULXs are well described by a disk blackbody model (see however Strickland et al. 2001) with – keV and – km. Our disk-blackbody fit to the XMM-Newton spectrum of XMMU J013636.5155036 is in good agreement with these values. Although some ULXs are highly variable on timescales of months or years (e.g., Kubota et al. 2001; Strickland et al. 2001; La Parola et al. 2001), they always remain at a high luminosity state ( ). However, XMMU J013636.5155036 is undetectable in the two deep Chandra observations few months before our XMM-Newton observations, suggesting that the source was then below . The only transient ULX found so far is CXOU J112015.8133514 in NGC 3628 (Strickland et al. 2001), while XMMU J013636.5155036 is the only example of an off-center ( or kpc from the galactic center) transient ULX.
The nature of ULXs is still a subject of debate. One common interpretation is that they are powered by accretion onto an intermediate-mass BH (–; Colbert & Mushotzky 1999). If the fitted spectral parameter (color temperature of the disk-blackbody) corresponds to the effective temperature at the inner boundary of a Shakura-Sunyaev disk, values of 1 keV would be inconsistent with an intermediate-mass Schwarzschild BH. Either a rapidly-spinning BH (Makishima et al. 2000) or non-standard disk models (e.g., a “slim disk”; Watarai, Mizuno, & Mineshige 2001) would be required instead. However, it is more generally , where the “hardening factor” in some Galactic microquasars (Ebisawa et al. 2001; Titarchuk & Shrader 2002). Therefore, observed values keV do not rule out an intermediate-mass, non-rotating BH. An alternative scenario for persistent ULXs is based on anisotropic emission from more common intermediate- or high-mass X-ray binaries. Emission beamed towards us can produce the high X-ray fluxes observed in those systems (King et al. 2001) without the need for an intermediate-mass BH. For a transient system such as XMMU J013636.5155036, further observations will tell us whether the brightening is due to a short-lived phase of super-Eddington accretion, or to a state transition like those observed in some Galactic microquasars (GRO J1655–40 and GRS 1915+105), which share similar spectral properties (e.g., Makishima et al. 2000).
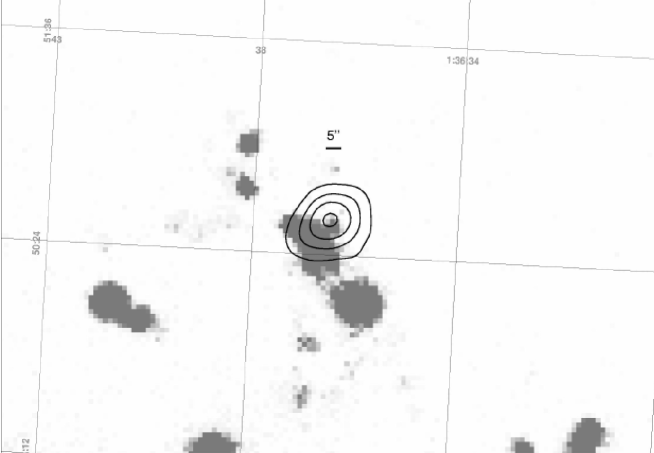
We tried to ascertain whether the ULX can be associated with a supernova remnant (SNR) or a photoionized H II region, as found in some cases (Wang 2002). From archival H images taken by the 1.0 m telescope at Mount Laguna Observatory (Marcum et al. 2001), XMMU J013636.5155036 is ″ North-West of an extended H II region, and a point-like object is within the X-ray error circle (see Figure 4). The point-like source appears more or less the same in both continuum-subtracted H images taken in 1991 and 1995. Optical spectroscopy of the extended H II region yields a ratio [S II]/H (van Zee et al. 1998), significantly lower than the typical value () measured in SNR (e.g., Blair, Kirshner, & Chevalier 1981). Therefore, the extended H feature near XMMU J013636.5155036 is likely a photoionized H II region associated with star formation.
We inspected the UV image taken with OM, simultaneously with the X-ray images. There is no obvious object within the X-ray error circle, to a limiting specific flux of Å-1, at an effective wavelength of 291 nm. As a comparison, the specific flux from a single B0 V star in M 74 would be times fainter at the same effective wavelength. If the point-like source in the H image at the position of XMMU J013636.5155036 corresponds to an OB star cluster, the lack of UV detection may be due to high extinction, typical of a very young star-forming cluster (Marcum et al. 2001). The larger H II region South-East of the transient is instead well visible in the OM image (Figure 3).
The association with a young stellar population suggests that XMMU J013636.5155036 is related to a high-mass X-ray binary. In addition, its strong variability () indicates that it is an accreting compact object rather than a SNR. Further observations at different wavelengths will be necessary to shed light on the nature and timing properties of the source.
6 Conclusions
We have studied the spiral galaxy M 74 with XMM-Newton. The luminosity function above is well fitted by a single power law of slope , similar to the values found for the source population in the disks of other spiral galaxies. We interpret it as evidence of ongoing star formation in the disk. The brightest source, located ′ from the nucleus, is a transient, undetected by Chandra a few months earlier. It has a luminosity in the 0.3–8 keV band, and spectral features similar to those observed in ULXs in other galaxies. The source appears to be associated with a photoionized H II region. Another bright transient BH ( ) is found at ′ from the nucleus. The nuclear source itself is weaker ( ). We have also measured the luminosity of the X-ray and UV counterparts of SN 2002ap, 4 days after its optical discovery.
References
- (1)
- (2) Adler, D. S., & Liszt, H. S. 1989, ApJ, 339, 836
- (3)
- (4) Blair, W. P., Kirshner, R. P., & Chevalier, R. A. 1981, ApJ, 247, 879
- (5)
- (6) Bloemen, J. B. G. M., et al. 1986, A&A, 154, 25
- (7)
- (8) Brandt, J. C., et al. 2001, AJ, 122, 2810
- (9)
- (10) Colbert, E., & Mushotzky, R. 1999, ApJ, 517, 89
- (11)
- (12) Cornett, R. H., et al. 1994, ApJ, 426, 553
- (13)
- (14) Dickey, J. M., & Lockman, F. J. 1990, ARA&A 28, 215
- (15)
- (16) Ebisawa, K., Kubota, A., Muzuno, T., & Zycki, P. 2001, in Proc. 3rd Microquasar Workshop, ed. A. Castro-Tirado, J. Greiner, & J. M. Paredes (Dordrecht: Kluwer)
- (17)
- (18) Ghosh, K. K., Swartz, D. A., Tennant, A. F., & Wu, K. 2001, A&A, 380, 251
- (19)
- (20) La Parola, V., Peres, G., Fabbiano, G., Kim, D. W., Bocchino, F. 2001, ApJ, 556, L47
- (21)
- (22) Kaaret, P., Prestwich, A. H., Zezas, A., Murray, S. S., Kim, D.-W., Kilgard, R. E., Schlegel, E. M., Ward, M. J. 2001, 321, L29
- (23)
- (24) Kilgard, R.E., Kaaret, P., Krauss, M.I., Prestwich, A.H., Raley, M.T., Zezas, A. 2002, ApJ, in press (astro-ph/0203190)
- (25)
- (26) King, A.R., Davies, M.B., Ward, M.J., Fabbiano, G., & Elvis, M. 2001, ApJ, 552, L109
- (27)
- (28) Kong, A. K. H., Garcia, M. R., Primini, F. A., Murray, S. S., Di Stefano, R., & McClintock, J. E. 2002, ApJ, submitted (astro-ph/0203243)
- (29)
- (30) Kubota, A., Mizuno, T., Makishima, K., Fulazawa, Y., Kotoku, J., Ohnishi, T., & Tashiro, M. 2001, ApJ, 547, L119
- (31)
- (32) Makishima, K., et al. 2000, ApJ, 535, 632
- (33)
- (34) Marcum, P.M., et al. 2001, ApJS, 132, 129
- (35)
- (36) Matsumoto, H., Tsuru, T. G., Koyama, K., Awaki, H., Canizares, C. R., Kawai, N., Matsushita, S., Kawabe, R. 2001, ApJ, 547, L25
- (37)
- (38) Mitsuda, K., et al. 1984, PASJ, 36, 741
- (39)
- (40) Nakano, S. 2002, IAUC 7810
- (41)
- (42) Pence, W. D., Snowden, S. L., Mukai, K., & Kuntz, K. D. 2001, ApJ, 561, 189
- (43)
- (44) Shrader, C. R., & Titarchuk, L. G. 1999, ApJ, 521, L21
- (45)
- (46) Shostak, G. S., & van der Kruit, P. C. 1984, A&A, 132, 20
- (47)
- (48) Strickland, D. K., Colbert, E. J. M., Heckman, T. M., Weaver, K. A., Dahlem, M., & Stevens, I. R. 2001, ApJ, 560, 707
- (49)
- (50) Tennant, A. F., Wu, K., Ghosh, K. K., Kolodziejczak, J. J., & Swartz, D. A. 2001, ApJ, 549, L43
- (51)
- (52) Titarchuk, L. G., & Shrader, C. R. 2002, ApJ, 567, 1057
- (53)
- (54) Trudolyubov, S. P., Borozdin, K. N., & Priedhorsky, W.C. 2001, ApJ, 563, L119
- (55)
- (56) Tully, R. B. 1988, Nearby Galaxies Catalogue, Cambridge University Press
- (57)
- (58) van Zee, L., Salzer, J. J., Haynes, M. P., O’Donoghue, A. A., & Balonek, T. J. 1998, AJ, 116, 2805
- (59)
- (60) Wang, Q.D. 2002, MNRAS, in press (astro-ph/0201230)
- (61)
- (62) Watarai, K., Mizuno, T., & Mineshige, S. 2001, ApJ, 549, L77
- (63)
- (64) Wu, K. 2001, PASA, 18, 443
- (65)
| Model | /dof | FluxaaUnabsorbed flux in 0.3–8 keV ( ergs cm-2 s-1). | ||||
|---|---|---|---|---|---|---|
| ( cm-2) | (keV) | (km) | ||||
| power-law | 0.85/56 | 1.95 | ||||
| bremsstrahlung | 0.91/56 | 1.53 | ||||
| disk blackbody | bbColor temperature . | 1.14/56 | 1.26 | |||
| bmc | 0.86/54 | 1.49 | ||||
| bbpower-law | 0.86/54 | 1.89 |
Note. — All quoted uncertainties are 90% confidence.