The BeppoSAX broad-band spectrum and variability of the Seyfert 1 NGC 3783
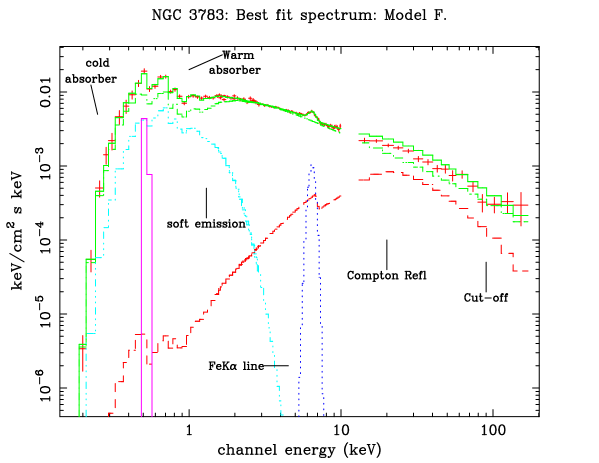
BeppoSAX observed the Seyfert 1 galaxy NGC 3783 for 5 days from 1998 June 6 to 1998 June 10. The average flux during the observation was F. The long exposure provided a very high quality spectrum that exhibits all the typical features of Seyfert 1s. The high energy cut-off of the intrinsic continuum, at E keV, was detected for the first time in this object. During the observation the source showed modest flux variations ( 20% in 2-10 keV) and spectral variability that can be completely explained by a change of the intrinsic slope 0.1. NGC 3783 is one of the few Seyfert 1s that exhibits a soft emission component in the BeppoSAX spectrum. This soft excess is well reproduced by a black body component with temperature kT0.2 keV. A warm absorber is also required to fit the soft X-ray spectrum. Both reprocessing features, the Compton reflection hump and the Fe emission line, were detected in our observation. In addition to a narrow iron line (as observed by Chandra) a broad component with keV and EW=11576 eV, is required to fit the line. The observed Compton hump and the Fe line are well reproduced with the ionized () disc reflection model of Ross & Fabian. In this case the soft excess observed below 2 keV can be accounted for by the disc emissivity and no additional soft X-rays component is required to fit the spectrum.
Key Words.:
Galaxies: individual: NGC 3783 - Galaxies: Seyfert; X-rays: galaxies1 Introduction
Intrinsic spectral variability has been observed in several Seyfert 1 galaxies: NGC 5548 (Nicastro et al. (2000)), NGC 4151 (Piro et al. 2002), IC 4329A (Done et al. (2000)), NGC 7469 (Nandra et al. 2000), MCG-6-30-15 (Vaughan & Edelson 2001). The usual behaviour is a steepening of the primary power law when the source brightens. The favoured model for the X-ray emission observed in AGN comprises a hot, optically-thin plasma (the corona) which up-scatters to X-ray energies the soft photons produced in a cold, optically-thick accretion disc (Haardt & Maraschi (1991)). In addition the optically thick disc reprocesses and re–emits part of the Comptonized flux producing the characteristic reprocessing features (the Compton reflection hump and the K Fe line). In a disc+corona emission model the intrinsic variability has to be associated with a change of some properties either of the emitting corona (temperature kTe, optical depth or geometry, see Haardt, Maraschi & Ghisellini (1997)) or the accretion disc (flares) with the X-ray flux. A detailed Comptonization model applied to the BeppoSAX long look of NGC 5548 (Petrucci et al. 2000) showed that the steepening of the spectrum during a flare in the central part of the observation was probably associated with an increase of the soft photon luminosity, the hard photon luminosity remaining constant.
The presence of a broad iron line in the X-ray spectra of Seyfert galaxies (Fabian et al. 2000) is suggested by ASCA (Nandra et al. (1997), Tanaka et al. (1995), Yaqoob et al. (2002)), BeppoSAX (Guainazzi et al. 1999) and XMM (Wilms et al. 2001) observations. Nevertheless a narrow iron line component is clearly detected in the Chandra (Kaspi et al. (2001), Yaqoob et al. 2001) and XMM observations (Reeves et al. 2001, Pounds et al. 2001). This narrow component could be attributed either to an optically thin medium (like the BLR), and in this case no Compton reflection should be associated to it, or to an optically thick medium with Ncm-2 (as the molecular torus like that observed in the Sy2 s, Matt 2001a ), which should contribute to the observed Compton reflection (Ghisellini et al. (1994)). At least in the case of NGC 4051 (Guainazzi et al. 1998) it is possible to associate the narrow iron line component to a distant Compton-thick matter.
The Broad band spectral variability in bright Seyfert 1 galaxies program, carried out by BeppoSAX in the last 3 years, exploits the unique capability of BeppoSAX to provide spectral informations up to 200 keV. The primary goals of this program are to investigate the correlation of the intrinsic parameters ( and ) with the luminosity and to characterize the diverse components of Seyfert 1 spectra from 0.1 to 200 keV, by studying their response to changes of the intrinsic luminosity.
The bright Seyfert 1 galaxy NGC 3783 was selected as a target in the cited
BeppoSAX program because:
a) it is bright enough that the spectrum up to
about 100 keV ( erg cm-2 s-1
could be measured;
b) it is characterized by variations of a factor of two or more on the time
scale of days. This time scale is appropriate to check possible
correlations in the variations of the spectral components.
The extensively studied X-ray spectrum of this object is characterized by
narrow and broad features in addition to the intrinsic continuum.
Deep Oxygen absorption edges (between 0.5 and 1 keV) were detected by ROSAT
(Turner et al. (1993)) and ASCA
(George et al. 1998a , George et al. 1998b ) which also observed a variable warm absorbing gas
along the line of sight. An OVII emission line, likely originating in
the same warm gas, was also detected in the first ASCA
observation (in 1993).
The Chandra high energy resolution
observation (Kaspi et al. (2000)) identified, in addition to many narrow
absorption lines, several weak emission lines mainly from O and Ne,
suggesting the presence of two absorption components (outflowing by the
central source), that differ by an order of magnitude in their ionization
parameters.
A Compton reflection hump and a Fe K emission line were
detected by GINGA (Nandra & Pounds (1994)).
A Chandra observation (Kaspi et al. (2001)) detected a
narrow and unresolved iron line, with an upper limit to the FWHM of
3250 km s-1. These data could not constrain any broad iron line, though
they are consistent with the broad line found in previous ASCA observations.
In this paper we present the analysis of a BeppoSAX observation of NGC 3783. In section 2 we describe the observation and the data reduction. In section 3 we report the spectral analysis of the data integrated over the total observation while in section 4 the spectral variability analysis is presented. The results are discussed in section 5. A summary is given in section 6.
2 Observations and data analysis
NGC 3783 was observed by BeppoSAX (Boella et al. (1997), Piro, Scarsi & Butler (1995)) for 5 days ( ks) from 1998 June 6 to 1998 June 10. The LECS, MECS and PDS data reduction followed the standard procedure (Fiore, Guainazzi & Grandi (1999)). The PDS spectra were filtered with fixed rise time. We extracted the spectrum within a circular region centered on the source with a radius of 4’ and 6’ for MECS and LECS respectively. The background was extracted from event files of source-free regions (“blank fields”). Spectral models were fitted to the data using the XSPEC package. All quoted uncertainties correspond to 90% confidence interval for one interesting parameter (=2.71). The models included a normalization factor for each instrument to take into account possible miscalibrations. We allowed the PDS/MECS normalization to vary between 0.77 and 0.95, while the LECS/MECS normalization ratio was running between 0.7 and 1 (Fiore, Guainazzi & Grandi (1999)). The journal of the BeppoSAX observation of NGC 3783 is shown in Table 1.
| State | Exposure (ks) | ⋄Count Rate (cts/s) | †S/N | ∙C | (dof) | ∗P | |
|---|---|---|---|---|---|---|---|
| TOT | 153870 | 0.758 0.002 | 341 | ||||
| L1 | 27403 | 0.586 0.005 | 127 | ||||
| H1 | 35630 | 0.823 0.005 | 171 | ||||
| M1 | 64257 | 0.709 0.003 | 213 | ||||
| M2 | 13311 | 0.720 0.007 | 99 | ||||
| H2 | 26791 | 0.851 0.006 | 151 | ||||
| H = H1+H2 | 62421 | 0.835 0.004 | 228 | 1.02 | 89.63(82) | 0.26 | |
| L=M1+M2 | 77568 | 0.713 0.003 | 235 | 1.07 | 109.5(82) | 0.02 | |
| ratio H/L | 1.254 | 222.3(82) |
⋄ In 1.5-10 .
† Signal to noise ratio in 1.5-10 .
∙ best fit value when the ratio of the two spectra is modeled
with a constant
⋆ value for a constant model with const=C
∗ Probability of exceeding .
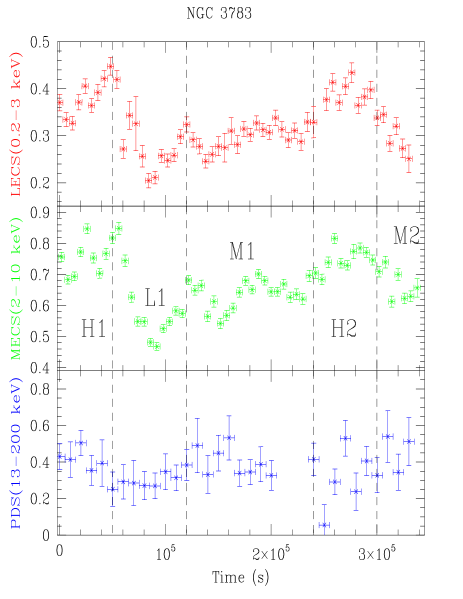
In Figure 1 we show the LECS (0.2-3 keV), MECS (2-10 keV) and PDS (13-200 keV) light curves. The source showed rapid variability both in the soft (0.2-3 keV) and medium (2-10 keV) energy ranges, with the larger amplitude at low energies. The 2-10 keV and 0.2-3 keV flux variations were up to a factor 1.6 and 2, respectively, on a time scale of about half a day.
3 The broad band spectral analysis: 0.1-200 keV
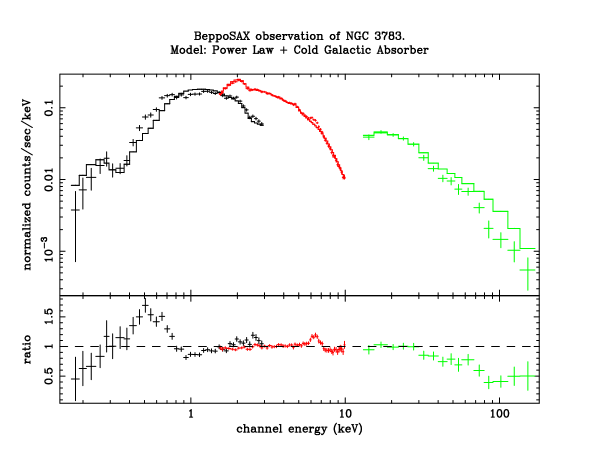
In this section we present the spectral analysis of the data integrated over the total observation of NGC 3783 (t 154 ks). We fitted the LECS, MECS and PDS data in the energy range 0.15-3 keV, 1.5-10 keV and 13-200 keV respectively. In Figure 2 we show the LECS, MECS and PDS spectra and the data/model ratio after fitting with (model A) a power law absorbed by the Galactic hydrogen column density ( cm-2, Murphy et al. (1996)). The fit is very bad (/dof=818.6/114, with =1.580.06). Several deviations of the data from the model are apparent: an excess of counts at 0.6 keV, a deficit below 2 keV, an emission line at 6.4 keV and another deficit above 100 keV.
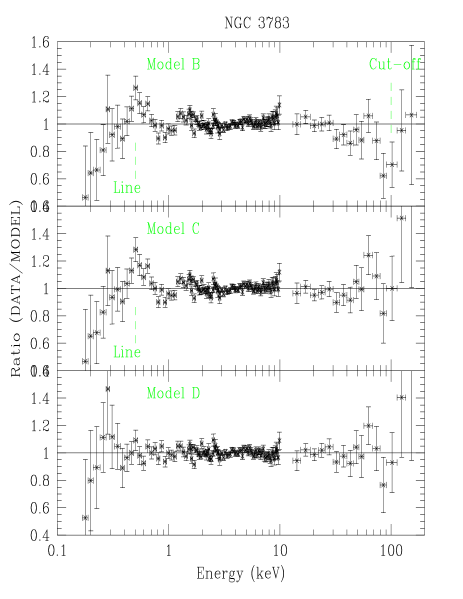
We then fitted the data with a model (B) including the known spectral components already detected in NGC 3783: a warm absorber (Turner et al. (1993)), a Compton reflection hump and an iron emission line (modeled with a gaussian) at 6.4 keV (Nandra & Pounds (1994)). The warm gas, assumed to be in photoionization equilibrium, is characterized by two parameters: the ionization parameter , defined as the ratio of the number density of ionizing photons to hydrogen nuclei, and the hydrogen column density NH. The description and discussion of the photoionization code we employed will be given in Sect. 5.2. To fit the Compton hump we use here a cold disc reflection model (PEXRAV in XSPEC, Magdziarz & Zdziarski (1995)). The reprocessed spectrum is characterized by the reflection fraction i.e. the solid angle subtended by the reflecting medium. The inclination angle between the line of sight and the reflector is assumed i=30∘. For the moment neither ionization nor smearing effects (gravitationals and kinematic) are taken into account to fit the reprocessed features. We will discuss these cases in Sect. 5.3. All the line parameters (energy, intrinsic width and intensity) are free to vary. The effects of including a narrow line component - as observed by Chandra (Kaspi et al. (2001)) - will be discussed in Sect. 5.3. The result of the fit with the model B is still unacceptable (/dof=189.6/108. See Table 2). The ratio data/model B is shown in the upper plot of the left panel of Figure 3. This plot shows still some deviations of the model from the data: a deficit of counts above 100 keV and an excess at energy less than 1 keV. We therefore added to the primary power law in the model B an exponential cut-off (Model C). The statistical significance of this new spectral component is larger than 99% (following a F-test probability for the addition of 1 interesting parameter we find F=8.14, see Table 2).
The excess at low energies may correspond to OVII emission line. As suggested by the ASCA observation (George et al. 1998a ), we fitted this excess with a gaussian emission line. The model is indicated with D and the best fit parameters with the statistical significance of the new spectral component is shown in the second column in Table 2. The ratio data/model D is shown in the lower plot of the left panel in Figure 3.
| Moel B | Model C | Model D | Model E | Model F | ||
| Warm | (U) | 1.54 | 1.60 | 1.29 | 1.29 | |
| Absorber | 22.32 | 22.31 | 21.85 | 22.28 | ||
| Intrinsic | Ec (keV) | - | 299 | 143 | 307 | 340 |
| Continuum | 1.900.04 | 1.89 | 1.69 | 1.860.03 | 1.87 | |
| ⋄Norm. | 2.20.1 | 2.10.1 | 1.60.1 | 2.10.1 | 2.10.1 | |
| Reflection | ⋆R | 0.75 | 0.95 | 0.31 | 0.71 | 0.70 |
| and | EL (keV) | 6.41 0.04 | 6.41 0.04 | 6.40 0.04 | ||
| Iron Line | (keV) | 0.53 | 0.49 | 0.39 | 0.38 | |
| EWL (eV) | 300 45 | 270 60 | 216 50 | 21045 | 19047 | |
| OVII | EO (keV) | - | - | 0.51 0.02 | - | 0.520.06 |
| Line | (keV) | - | - | 0.13 | - | 0.2 |
| EWO (eV) | - | - | 240 27 | - | 10 (frozen) | |
| Soft | kT (keV) | - | - | - | 0.21 0.01 | 0.220.03 |
| Emission | ††Norm. | - | - | - | ||
| /dof | 189.6/108 | 176.2/107 | 111.2/104 | 104.7/105 | 101.7/103 | |
| †F value | 59.7 (99.9%) | 8.14 (99.5%) | 20.3(99.9%) | 35.9(99.99%) | 1.5(77%) |
⋄ In 10-2 photons keV-1 cm-2 s-1,
a 1 keV.
⋆ is the ,
the solid angle subtended by the reflecting medium. The inclination
angle between the line of sight and the reflector is assumed
i=30∘.
†† In 10, where L39 is
the source luminosity in units of ergs/sec and D10 is
the distance to the source in units of 10 kpc.
† In respect to model A (see text) for model B,
in respect to model B for model C, in respect to model C for model D,
in respect to model C for model E, in respect to model E for the model F.
Despite the good , there is a problem with model D regarding the origin of the emission line at low energy. We measure EWoxygen=24027 eV (see Table 2). Can this spectral feature be produced in the same gas which produces the O edges at E 1 keV (the warm absorber)? We suppose the warm absorber to be ionized by the central source and in photoionization equilibrium. The value of the equivalent width for the OVII emission line produced in a gas characterized by and (as that observed by BeppoSAX), should not exceed 10 eV (Nicastro et al. (1999)). If collisional ionization is also important, the emissivity from the gas strongly increases (Nicastro et al. (1999)). In this case the blend of the OVII K triplet is more prominent and the predicted EW would increase up to 70 eV, still lower than measured.
The HETG on board Chandra allowed to resolve the OVII triplet in NGC 3783 (Kaspi et al. (2000)); the total equivalent width was 10 eV (even if poorly constrained) i.e. much smaller than that measured by BeppoSAX.
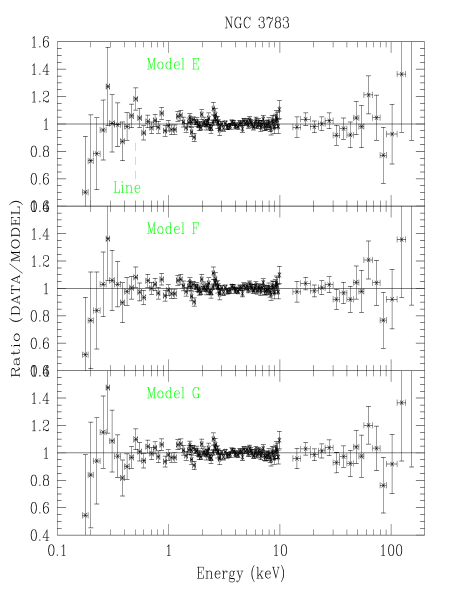
All these considerations suggest that most of the low energy excess, which modeled with an emission line, was instead due to a soft X-ray continuum. We therefore fitted the excess at low energies with a black body component (model E). The best fit parameters are shown in Table 2. Comparing model E with model C (in which no oxygen line was included), we obtain that the black body component is required at the 99.99% confidence level (F=35.9).
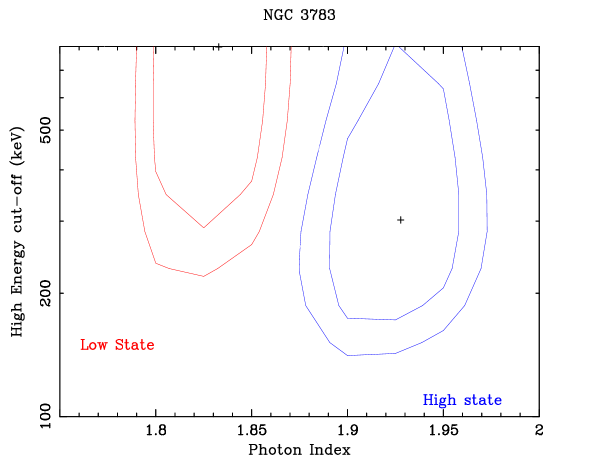
In the upper plot of the right panel of Figure 3 we show the ratio data/model E. When we add a gaussian emission line to the model E (model F), with the intensity fixed at the Chandra value, we find that this component is required at only the 77% confidence level. A good fit () is also obtained fitting the excess at low energies with a thermal bremsstrahlung (the ratio data/model for a thermal bremsstrahlung is shown in the last panel on the right in figure 3, model G), with temperature kT=0.460.06 keV. However, in this model the value of the relative reflection is smaller (=0.34 0.23) than expected from the iron line EWFe ( 200 eV). We therefore conclude that the BeppoSAX spectrum is best fitted by model F. The best fit model F is shown in Figure 4 where each spectral component is labelled. We plot in Figure 5 the intervals of confidence for the parameter EC and (left panel), and (middle panel) and and (right panel)


4 Spectral variability analysis
4.1 A model independent variability analysis
To investigate spectral variability, we extracted spectra from different flux level states of the source during the BeppoSAX observation (see Table 1, see Figure 1).
The states we selected were: High 1 (H1), Low 1 (L1), Medium 1 (M1), High 2 (H2) and Medium 2 (M2). To increase the statistics and to get comparable S/N ratios of the spectra extracted form the different flux levels, we added together those with similar flux. We fitted the ratios of the various spectra with a constant model, , to search for spectral variability. The best fit values for C are shown in Table 1. The ratios H1/H2 and M1/M2 are both consistent with a constant value C1 (see Table 1). Then we create a new high state H=H1+H2, and a new low state L=M1+M2. In Figure 6 we present the ratio between H and L spectra. We can reject the hypothesis of constant value for this ratio at confidence level (see Table 1). The plotted curves represent the expected spectral ratio in different cases. The variations can not be accounted for by a change of the warm absorber status (e.g. ionization parameter U). In fact we detected deviations of the spectral ratio from the constant model also above 2 keV (see Figure 6), where the warm gas is transparent to the radiation and no features can be produced by this material. In Figure 6 we also plotted the expected ratio if the only parameter which changes in the different flux states is the ionization of the warm gas (dash line). We suppose that the ionization structure is dominated by the intrinsic flux between 0.5 and 2 keV, this because the opacity of the gas is dominated by K shell absorption edges due to O VII and O VIII (the two most abundant ions of the most abundant element). So we rescaled U assuming ). In this case the absolute normalization of the Compton reflection is kept constant in the H and L states. The other curves in Figure 6 represent the expected ratio if the observed variations were produced by:
1) a change of the intrinsic slope of (dot - dash curve). The intensity of the reflected radiation is assumed to remain constant (i.e. the relative reflection is variable).
2) a change of the intrinsic slope as well as the reflected component (solid line). In this case the reflection component is assumed to promptly respond to the intensity variation of the continuum (i.e. relative reflection is constant).
Looking at Figure 6, it is clear that the limited statistics does not allow us to distinguish between the two cases of constant or variable reflection. The observed behaviour can be reproduced by a variation of the intrinsic slope. This will be confirmed with a spectral analysis on the separate flux states, discussed in the next section.
4.2 Spectral variability: the different flux level spectra
We performed a spectral analysis of the different flux spectra, extracted as shown in Figure 1 and in Table 1. The best fit model employed in this analysis is the one giving the best fit to the integrated spectra, i.e. the model F.
We confirm that the observed variations can be explained by a change of the intrinsic continuum. In particular the source steepens (, see Figure 7, Table 3) when brightens. The limited statistics in the separate flux states did not allow us to detect variations of Ec (see contour plot in Figure 7). No variations in the ionization status of the warm gas was observed.
| Low State: L | High State: H | ||
| Warm | (U) | 1.28 | 1.38 |
| Absorber | 22.270.11 | 22.32 | |
| Intrinsic | Ec (keV) | 250 | 300 |
| Continuum | 1.830.04 | 1.93 | |
| ⋄Norm. | 1.9 | 2.5 | |
| Reflection | ∘R | 0.58 | 0.77 |
| and | EL (keV) | 6.390.07 | 6.390.06 |
| Iron Line | (keV) | 0.37 | 0.25 |
| EWL (eV) | 20478 | 16370 | |
| OVII | E2 (keV) | 0.50.2 | 0.50.2 |
| Line | (keV) | 0 (frozen) | 0 (frozen) |
| EWO (eV) | 3451 | 3041 | |
| Soft | kT (keV) | 0.21 | 0.22 |
| Emission | ⋆Norm. | 4.5 | 4.6 |
| /dof | 85.26/102 | 73.20/102 |
⋄ In 10-2 photons keV-1 cm-2 s-1,
a 1 keV.
∘ with cos(i)=30∘
⋆ In 10, where L39 is
the source luminosity in units of ergs/sec and D10 is
the distance to the source in units of 10 kpc.
5 Discussion
5.1 Intrinsic Continuum and spectral variability
The presence of a high energy cut-off was required to fit the X-ray/-ray spectra of a sample of Seyfert observed with different satellites (Zdziarski et al. (1996)). The keV detected in NGC 3783 by BeppoSAX is consistent with the values observed in other Sy 1s of the BeppoSAX sample (ranging between 70 keV up to 300 keV, Perola et al. in preparation).
The spectral variability detected in our observation can be accounted for by variations of the intrinsic slope. In particular the intrinsic spectrum steepens when the source brightens ( with ). This behaviour was observed also in other sources: NGC 5548 (Nicastro et al. (2000)), NGC 4151 (Piro 2002), NGC 7469 (Nandra et al. 2000), MCG-6-30-15 (Vaughan & Edelson 2001), and IC 4329A (Done et al. 2000).
A two-phase model involving a hot corona emitting medium-hard X-rays by Comptonization and a cold optically thick layer which provides the soft photons to be Comptonized (Haardt & Maraschi 1991, Haardt et al. 1997), can explain the observed intrinsic variability. In this model the physical parameters of the corona can drive the spectral variations observed in the hard-medium energy range, while those in the soft band are driven by the temperature of the soft photons emitted by the cold layer.
If the corona is not pair dominated, i.e. the compactness parameter , the two phases model predicts a noticeable spectral variability even when the luminosity variation is less than a factor two. Our variability study suggests that this is the case for NGC 3783. We measure (see Figure 7 and Table 3), with no variation of the Comptonization luminosity (0.1-200 keV) in the H and L states: erg/s. We can put a lower limit to the compactness parameter. The time scale over which the flux changes by a factor 2 is greater than 5 days, so we obtain . A detailed Comptonization code was employed to fit the data of the BeppoSAX observation of NGC 5548 (Petrucci et al. (2000)). The spectral variability observed in that source could by accounted for by a change of the spectral slope with small hard luminosity changes. The spectral softening in the high state is explained (when a realistic model of Comptonization is employed) by a decrease of kTe due to an increase of the soft photon flux. The anticorrelation between the slope and the high energy cut-off is not revealed when a cut-off power law is used as a zero order approximation of a Comptonized spectrum. Also in the case of NGC 5548 the trend of variability suggests a hot plasma which is not pair-dominated (and the estimated lower limit for the compactness was ). In the case of NGC 3783 an accurate Comptonization model was employed only to fit the total spectrum, with no spectral variability analysis (Petrucci et al. (2001)). The estimated coronal parameters are substantially different between the two models (the coronal temperature kT keV is higher than that measured with our simpe cut-off power law model Ec/2). This is due to the presence of an energy break in the Comptonization model, produced when the anisotropy of the soft photon field is taken into account.
5.2 Warm absorber and soft emission
The low energy spectrum of NGC 3783 is characterized by the presence of the warm absorber. The complex structure of this gas was investigated in the Chandra observation (Kaspi et al. (2001)). The model consisted of two absorption/emission components with the same column density , but different ionization parameter: , with a covering factor f=0.3 and , with a covering factor f=0.5 (these values are computed between 0.538 keV and 10 keV). We fitted the BeppoSAX data with a grid of single-zone warm absorber models build with CLOUDY (Ferland (1997)). These models include only the transmitted spectra, and do not include the contributions of both gas emission and resonant absorption. The ionization parameter, computed from 1 Ryd, in the total spectrum was (see Table 2). Taking into account the ionizing continuum used to fit Chandra data, we get the relation Uoxygen=0.114 U(0.1-10 keV) (Kaspi et al. (2001)); in the case of BeppoSAX spectrum we employed the ionizing continuum from Mathews & Ferland (1995) (listed in Table 4) to rescale the value of U( 1 Ryd) in the 0.1-10 keV energy range. In this case we found U( 1 Ryd) 50 U(0.1-10 keV) (see also George et al. 1998a). The ionization parameter during our observation is marginally consistent with that of the low ionization gas observed in the Chandra spectrum (0.1-10 keV)=0.40.1. No variation of the low-ionization component was observed between BeppoSAX and Chandra observations, not surprisingly as no flux changes in 0.5-2 keV (F) between the two observations have been detected.
The high ionized absorption features of the heavier elements produced in the more ionized component are too small to be observed given the limited LECS sensitivity and energy resolution. The warm absorber parameters obtained with BeppoSAX are derived mainly from the deep OVII and OVIII absorption edges produced in the low ionization gas. The OVII triplet observed by Chandra at keV is only marginally required by our data (PF=77%). This feature was also observed in the BeppoSAX spectrum of NGC 5548 (Nicastro et al. (2000)), and later on confirmed by Chandra (Kaastra et al. 2000). An additional absorption line (at 1 keV) corresponding to the blend of many iron L-shell absorption lines observed by Chandra, is very marginally required by the model (PF=52%). When we add this component the warm absorber parameters as well as those of the intrinsic continuum do not change.
A reanalysis of the ASCA observation of 1996 taking into account (1) the inclusion of the reflection component as measured by the RXTE observation simultaneous with those Chandra in 2000 and (2) the use of the Yaqoob (2000) method to account for the degradation of the SIS detectors, was performed by Kaspi et al. (2001). The intrinsic continuum they found is fully consistent with that measured by BeppoSAX (=1.850.03, A(1 keV) =2.21 ph cm-2 s-1 keV-1), and the warm absorber is consistent with the low ionization component observed by Chandra (=0.1330.003, =22.150.03).
A significant soft emission well modeled by a black body component with a temperature kT=22030 eV was detected in the BeppoSAX observation. No variation of the soft component emission was detected. We may associate this emission to the accretion disc around the central source. The IUE monitoring of NGC 3783 from 1978 to 1985 detected a UV-bump from 5150 up to the soft X-rays. The observed bump could be attributed to a thermal emission from an optically thick medium. When the UV bump was reproduced with a sum of blackbody spectra, the highest disc temperature was 280,000 K (Alloin et al. (1995)).
| (Ryd) | slope | |
|---|---|---|
| 0.206 | 2.6576 | 0.5 |
| 1.743 | 2.194 | 1 |
| 4.130 | 1.819 | 3 |
| 26.84 | -0.6192 | 0.7 |
5.3 Compton reflection and Iron line
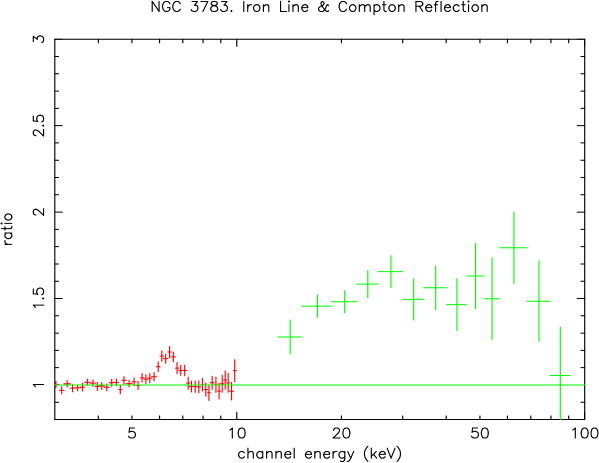


The broad band capability of BeppoSAX allowed us to detect the Compton reflection together with a broad Fe K emission line (Figure 8). The energy of the iron line keV, is consistent with FeI-XII. In the model F (see Table 2) this features is well reproduced by a broad gaussian component with keV and EWFe=19047 eV. A broad and asymmetric line is expected if the X-ray reflection is occurring in the inner region of an accretion disc (Fabian et al. 2000, Matt et al. 1992). However there is evidence that in NGC 3783 as well as in other Seyfert 1 galaxies, the line is actually composed of two components, one broad and variable and the other narrow and constant. To support this idea we recall that in the Chandra observation on NGC 3783 a narrow unresolved iron line (with EW=11536 eV) was detected (Kaspi et al. 2001). The upper limit for the FWHM was 3250 km s-1, consistent with this line originating outside the BLR. The line flux is consistent with predictions from models of torus emission. The Chandra data could not constrain any broad Fe K emission though they were consistent with the broad line found by ASCA in this source (EW=23070 eV, George et al. 1998b ).
If we fit the iron line with a narrow component with the parameters fixed to those detected by Chandra (E keV, I ph cm-2 s-1), we find strong residuals around 6 and 7 keV (see Figure 9, left panel). If we add a second broad gaussian component the residuals disappear (see right panel in Figure 9). The broad component is required at 99.9% c.l. (following a F-test adding three interesting parameters), with keV EWbl=115 76 and E keV, i.e. corresponding to neutral iron. These values are fully consistent with those of the ASCA observation in 1996 when the ASCA data were modeled assuming the underlying continuum derived by the analysis of a RXTE observation (simultaneous with those of Chandra in 2000, Kaspi et al. (2001)), to constrain the reflection component.
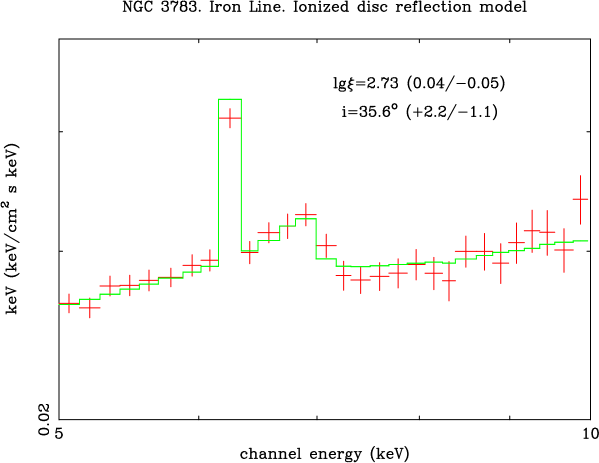
The simultaneous BeppoSAX/XMM observation of the NLSy1 NGC 5506 (Matt et al. 2001b ) showed that in that case the bulk of the Compton reflection has to be associated with the narrow iron line, as in the the case of NGC 4051 (Guianazzi et al. 1998). In other objects observed by XMM (Mkn 509, Pounds et al. 2001; Mkn 205, Reeves et al. 2001), evidence for ionized accretion disc was also found. An ionized disc reflection model was also employed to fit the data of NGC 3783. This source was included in a small sample of Sy 1s observed by BeppoSAX analysed with the ionized disc reflection model of Ross & Fabian (1993) (De Rosa et al. (2002)). In this model the most important quantity in determining the shape of the reflected continuum is the ionization parameter , where Fx is the X-ray flux (between 0.01-100 keV) illuminating a slab of gas with solar abundances and constant hydrogen number density nH=1015 cm-3. The K iron emission line as well as the emission features from the disc at low energy, are included in the model. In the fit, we applied to the spectrum a relativistic blurring appropriate for a Schwarszchild geometry assuming a disc emissivity law (Fabian et al. 1989). During the fit a narrow iron line component with all the parameters linked to those of Chandra observation was included. This analysis showed that the reflected spectrum of NGC 3783 can be produced (/dof=104/101) by a highly ionized disc characterized by: inner radius (pegged to the lower value) rin=6 rg, outer radius rout= 7 rg with rg=GM/c2 the gravitational radius, ionization parameter and inclination angle degrees (see Figure 10). In this case the observed soft X-rays excess can be accounted for by the disc emissivity and no additional component at E 2 keV is required. This suggests that the Compton reflection observed in NGC 3783 can be completely associated with the broad Fe component supposing that both were created in a relativistic disc. Unfortunately, the energy resolution and sensitivity of BeppoSAX are not adequate to disentangle both the Fe line components and simultaneously the fraction of reflection associated with them. A simultaneous BeppoSAX/XMM observation would be the best way to achieve this purpose.
6 Summary
We have analysed the long BeppoSAX observation of the Seyfert 1 galaxy NGC 3783. We detect a high energy cut-off of the intrinsic power; the value of Ec=340 keV is consistent with those observed so far in a sample of Seyfert galaxies, which ranges from 70 keV up to 300 keV. Spectral variability was clearly present, well modeled by a steepening of the intrinsic continuum () with no total luminosity change. This behaviour is consistent with a two-phase disc-corona model in which with the hot plasma is not pairs dominated (as observed also in the Seyfert 1 galaxy NGC 5548).
The presence of a warm gas is confirmed by our analysis. Its ionization status is consistent with the low-ionization component detected by Chandra. NGC 3783 is one of the few sources in which BeppoSAX detected a soft excess. We reproduced the soft emission with a black body component with a temperature kT0.2 keV.
The Compton reflection hump and the iron emission line are clearly detected. In addition to the narrow unresolved iron component observed by Chandra, a broad iron line component ( keV) is required to fit the BeppoSAX data. The observed reprocessing features can be reproduced with a highly ionized accretion disc (). In this case the soft excess observed at E 2 keV can be accounted for by the disc emissivity and no additional soft X-rays component is required to fit the spectrum.
Acknowledgements.
We gratefully acknowledge A.C. Fabian and D.R. Ballantyne for providing us with the ionized disc reflection code. A.D.R. would like to thank G.C. Perola for useful discussions. G.M. and F.F. acknowledge financial support from ASI and MURST (under grant cofin-00-02-36). We thank the SAX Scientific Data Center and the anonymous referee who provided helpful suggestions and comments.References
- Alloin et al. (1995) Alloin D. et al. 1995, A&A, 293, 293
- Boella et al. (1997) Boella G., Butler R.C., Perola G.C, Piro L., Scarsi L., Bleeker J., 1997, A&A 122, 299
- De Rosa et al. (2002) De Rosa A., Fabian A.C., Piro L., Ballantyne D.R., 2002, to appear in the Proceedings of the Symposium on New Visions of the X-ray Universe in the XMM-Newton and Chandra Era, 26-30 November 2001, ESTEC, The Netherlands. (astro-ph/0202206)
- Done et al. (2000) Done C., Madejski G.M., Zycki P.T., 2000, ApJ, 536, 213
- Fabian et al. (1989) Fabian A.C., Rees M.J., Stella L., White N.E., 1989, MNRAS, 238, 729
- Fabian et al. (2000) Fabian, A.C., Iwasawa K., Reynolds C.S., Young, A.J., 2000, PASP, 112, 1145
- Ferland (1997) Ferland, G. J. 1997, CLOUDY, version 90.04
- Fiore, Guainazzi & Grandi (1999) Fiore F., Guainazzi G., Grandi P. 1999, Cookbook for BeppoSAX NFI Spectral analysis. SDC report. (Available from http://asdc.asi.it/bepposax/software/index.html)
- (9) George I.M., Turner T.J., Netzer H., Nandra K., Mushotzky R.F., Yaqoob, T., 1998a,ApJS, 114, 73
- (10) George I.M., Turner T.J., Mushotzky R., Nandra K., Netzer H., 1998b, ApJ, 503, 174
- Ghisellini et al. (1994) Ghisellini G., Haardt F. and G. Matt 1994, MNRAS, 267, 743
- Guainazzi et al. (1998) Guainazzi M., Nicastro F., Fiore F., Matt G., McHardy I., Orr A., Barr P., Fruscione A., Papadakis I., Parmar A.N., Uttley P., Perola G.C., Piro L., 1998, MNRAS, 301, L1
- Guainazzi et al. (1999) Guainazzi M., Matt G., Molendi S., Orr A., Fiore, F., Grandi P., Matteuzzi, A., Mineo, T., Perola G.C., Parmar A.N., Piro L., 1999 A&A, 341, L27
- Haardt & Maraschi (1991) Haardt F. & Maraschi L. 1991, ApJ, 380, L51
- Haardt, Maraschi & Ghisellini (1997) Haardt, Maraschi & Ghisellini 1997, ApJ, 476, 620
- Kaastra et al. (2000) Kaastra J.S., Mewe R., Liedahl D.A., Komossa S., Brinkman A.C., 2000, A&A, 354, L83
- Kaspi et al. (2000) Kaspi S., Brandt W.N., Netzer H., Sambruna R., Chartas G., Garmire G.P. and Nousek J.A., 2000, ApJ, 535, L17
- Kaspi et al. (2001) Kaspi S., Brandt W.N., Netzer H., George I., Chartas G., Behar E., Sambruna R., Garmire G. and Nousek J. 2001, ApJ, 554, 216
- Magdziarz & Zdziarski (1995) Magdziarz P. & Zdziarski A.A. 1995, MNRAS, 273, 837
- Mathews & Ferland (1995) Mathews & Ferland, 1995, ApJ, 323, 456
- Matt et al. (1991) Matt G., Perola G.C., Piro L. and Stella L., 1992, A&A 257, 63
- (22) Matt G., 2001a, in “Issues in Unification of AGNs”, eds. R. Maiolino, A. Marconi and N. Nagar, ASP Conf. Ser., in press (astro-ph/0107584)
- (23) Matt G., Guainazzi M., Perola G. C.,Fiore F., Nicastro F.,Cappi M., Piro L., 2001b, A&A, 377, L31
- Murphy et al. (1996) Murphy E.M., Lockman F.J., Laor A.A. Elvis M., 1996, ApJS, 105, 169
- Nandra & Pounds (1994) Nandra K., Pounds K.A., 1994, MNRAS, 268, 405
- Nandra et al. (1997) Nandra, K., George I.M., Mushotzky R.F., Turner T.J., Yaqoob, T., 1997, ApJ, 477, 602
- Nandra et al. (2000) Nandra K., Le T., George I.M., Edelson R.A., Mushotzky R.F., Peterson B.M., Turner T.J., 2000, ApJ, 544, 734
- Nicastro et al. (1999) Nicastro F.,Fiore F., Matt G. 1999, ApJ, 517, 108N
- Nicastro et al. (2000) Nicastro F., Piro L., De Rosa A., Feroci F., Grandi P., Fiore F., Elvis M., Haardt F., Kaastra J., Malizia A., Maraschi L., Matt G., Perola, G.C., Petrucci P.O., 2000, ApJ, 536, 718
- Perola et al. (2001) Perola G.C. et al. , in preparation
- Petrucci et al. (2000) Petrucci P.O.P., Haardt F., Maraschi L., Grandi P., Matt G., Nicastro F., Piro L., Perola G.C., De Rosa A., 2000, ApJ, 540, 131
- Petrucci et al. (2001) Petrucci P.O.P., Haardt F., Maraschi L., Grandi P., Malzac J., Matt G., Nicastro F., Piro L., Perola G.C., De Rosa A., 2001, 556, 716
- Piro, Scarsi & Butler (1995) Piro L., Scarsi L. & Butler R.C. 1995, Proc. of SPIE, 2517, 169
- Piro et al. (2001) Piro L. et al. , 2002 ApJ, submitted
- Pounds et al. (2001) Pounds K., Reeves J., O’Brien P., Page K., Turner M., Nayakshin S., 2001, ApJ, 559, 181
- Rees & Fabian (1993) Ross R.R. & Fabian A.C., 1993 MNRAS, 261, 74
- Reeves et al. (2001) Reeves J.N., Turner M., Pounds K., O’Brien P., Boller Th., Ferrando P., Kendziorra E., Vercellone S., 2001, ApJ, 365L, 134
- Tanaka et al. (1995) Tanaka Y, Nandra K., Fabian A.C., Inoue H., Otani C., Dotani T., Hayashida K., Iwasawa K., Kii T., Kunieda H., Makino F., Matsuoka M., 1995, Nature, 375, 659
- Turner et al. (1993) Turner T.J., Nandra K., George I.M., Fabian A.C., Pounds K.A. 1993, 419, 127
- (40) Vaughan & Edelson, 2001, ApJ, 548, 694
- Wilms et al. (2001) Wilms J., Reynolds C.S., Begelman M.C., Reeves J., Molendi S., Staubert R., Kendziorra E., 2001, MNRAS, 328, L27
- Yaqoob et al. (2001) Yaqoob, T., George I.M., Nandra K., Turner T.J., Serlemitsos P.J., Mushotzky R.F., 2001, ApJ, 546, 759
- Yaqoob T. (2000) Yaqoob, T., 2000, ASCA GOF Calibration Memo ASCA-CAL-000601 (v1.0)
- Yaqoob et al. (2002) Yaqoob T., Padmanabhan U, Dotani T, Nandra K., ApJ, accepted. astro-ph/0112318
- Zdziarski et al. (1996) Zdziarski, A. A., Johnson, W. N., Done C. Smith D. and McNaron-Brown K., 1995 ApJ, 438, L63