The Ionized Gas and Nuclear Environment in NGC 3783.
I. Time-Averaged 900 ks Chandra Grating Spectroscopy
Abstract
We present results from a 900 ks exposure of NGC 3783 with the High-Energy Transmission Grating Spectrometer on board the Chandra X-ray Observatory. The resulting X-ray spectrum, which covers the 0.5–10 keV energy range, has the best combination of signal-to-noise and resolution ever obtained for an AGN. This spectrum reveals absorption lines from H-like and He-like ions of N, O, Ne, Mg, Al, Si, and S. There are also possible absorption lines from H-like and He-like Ar and Ca as well as H-like C. We also identify inner-shell absorption from lower-ionization ions such as Si VII–Si XII and S XII–S XIV. The iron absorption spectrum is very rich; L-shell lines of Fe XVII–Fe XXIV are detected, as well as probable resonance lines from Fe XXV. A strong complex of M-shell lines from iron ions is also detected in the spectrum The absorption lines are blueshifted relative to the systemic velocity by a mean velocity of km s-1. We resolve many of the absorption lines, and their mean FWHM is km s-1. We do not find correlations between the velocity shifts or the FWHMs with the ionization potentials of the ions. Most absorption lines show asymmetry, having more extended blue wings than red wings. In O VII we have resolved this asymmetry to be from an additional absorption system at km s-1. The two X-ray absorption systems are consistent in velocity shift and FWHM with the ones identified in the UV lines of C IV, N V, and H I. Equivalent width measurements for all absorption and emission lines are given and column densities are calculated for several ions. We resolve the narrow Fe K line at eV to have a FWHM of km s-1, which suggests that this narrow line may be emitted from the outer part of the broad line region or the inner part of the torus. We also detect a “Compton shoulder” redward of the narrow Fe K line which indicates that it arises in cold, Compton-thick gas.
The Astrophysical Journal Supplements Series, 14?: ??1–?19, 2002 ???, astro-ph/0203263
1 Introduction
NGC 3783 is one of the best-studied and brightest Seyfert 1 galaxies ( mag). It has some of the strongest X-ray absorption features around 0.7–1.5 keV known for a Seyfert 1; these have been typically attributed to O VII (739 eV) and O VIII (871 eV) edges indicating the presence of a “warm absorber.” NGC 3783 has been studied in detail in the X-ray band with ROSAT (Turner et al. 1993) and ASCA (e.g., George et al. 1998) as well as with the new generation of X-ray observatories, Chandra (Kaspi et al. 2000a, 2001) and XMM-Newton (J. Blustin et al., in preparation). Its 2–10 keV spectrum is fitted by a power law with photon index –1.8, the 2–10 keV flux varies in the range – ergs cm-2 s-1, and its mean X-ray luminosity is ergs s-1 (for km s-1 Mpc-1 and ). Modeling the apparent O VII and O VIII edges indicates a column density of ionized gas of cm-2.
| Sequence Number | UT start | UT end | Time (ks)aaNegative signs before the EW indicate an emission line. | Roll angle ()bbAbsorbed flux for the absorption lines and emitted flux for the emission lines. |
|---|---|---|---|---|
| 700045 | 2000 Jan 20, 23:33 | 2000 Jan 21, 16:20 | 56.4 | 50.1 |
| 700280 | 2001 Feb 24, 18:45 | 2001 Feb 26, 17:48 | 165.7 | 22.1 |
| 700281 | 2001 Feb 27, 09:18 | 2001 Mar 01, 09:10 | 168.8 | 19.4 |
| 700282 | 2001 Mar 10, 00:31 | 2001 Mar 11, 23:30 | 165.5 | 6.7 |
| 700283 | 2001 Mar 31, 03:36 | 2001 Apr 02, 02:48 | 166.1 | 334.5 |
| 700284 | 2001 Jun 26, 09:57 | 2001 Jun 28, 09:10 | 166.2 | 245.4 |
aSum of good time intervals corrected for detector
dead time (LIVETIME).
bRoll angle describes the orientation of the Chandra instruments on the sky. The angle increases to the West of
North — opposite to the traditional position angle.
NGC 3783 was observed for 56 ks with the High-Energy Transmission Grating Spectrometer (HETGS; C. R. Canizares et al., in preparation) on the Chandra X-ray Observatory111See The Chandra Proposers’ Observatory Guide at http://asc.harvard.edu/udocs/docs/. with the Advanced CCD Imaging Spectrometer (ACIS; G. P. Garmire et al., in preparation) as the detector. The observation and resulting high-resolution spectrum (covering the 1.6–23.4 Å wavelength range) are described by Kaspi et al. (2000a, 2001). This spectrum shows several dozen absorption lines and a few emission lines from the H-like and He-like ions of O, Ne, Mg, Si, and S as well as from Fe XVII–Fe XXIII L-shell transitions. The absorption lines are blueshifted relative to the systemic velocity by km s-1 while the emission lines are consistent with being at the systemic velocity (throughout this paper we use a redshift of which corresponds to a systemic velocity of km s-1; de Vaucouleurs et al. 1991). With the limited signal-to-noise ratio (S/N) of this observation, only the stacked composite of several Ne absorption lines could be resolved to have a FWHM of km s-1. The high-resolution X-ray spectrum was modeled with two absorption components, with different global covering factors and an order of magnitude difference in their ionization parameters. The two components were taken to be spherical shells of highly ionized gas radially outflowing from the AGN and thus contribute to both the absorption and the emission via P Cygni profiles. A two, or more, absorption-component model was also suggested by George et al. (1998) to explain the warm-absorber variability seen by ASCA.
The UV spectrum of NGC 3783 shows intrinsic absorption features due to C IV, N V, and H I (e.g., Kraemer, Crenshaw, & Gabel 2001 and references therein). Currently there are three known absorption systems in the UV at radial velocities of 560, 720, and 1400 km s-1 (blueshifted) relative to the optical redshift, with FWHMs of 170, 280, and 190 km s-1, respectively. The strength of the absorption is found to be variable over time scales of months to years. The relation between the X-ray and the UV absorbers is not clear. It has been suggested by several studies that both types of absorption might arise from the same gas component in the AGN (e.g., Mathur, Elvis, & Wilkes 1995; Shields & Hamann 1997), but no firm conclusions could be reached. The main unknowns were the spectral energy distribution (SED) at far-UV energies, responsible for the ionization of the observed UV species, and the poor X-ray spectral resolution. With the better resolution of the Chandra/HETGS, Kaspi et al. (2001) found the absorbing X-ray system to have an outflow velocity that is consistent with the two smallest outflow velocities of the UV absorbing systems. However, no X-ray absorbing system was found to correspond to the UV absorbing system at 1400 km s-1. We note that Kraemer et al. (2001) predict O VII and O VIII X-ray absorption lines based on the modeling of the UV absorption at 1400 km s-1. The low S/N of the 56 ks observation might have prevented detection of this absorption system in the X-ray band.
We selected NGC 3783 for a long multiwavelength monitoring program to study in detail its nuclear spectrum over time and to address further the above issues. NGC 3783 is most suitable for such a program as it is very bright in the X-ray and UV, has one of the strongest warm absorbers, has shown narrow absorption lines both in the X-ray and the UV bands, and has shown spectral variability over time in both bands. The monitoring campaign, involving Chandra/HETGS and RXTE in the X-ray, HST/STIS and FUSE in the UV, and ground-based observations, took place during 2001 February–June. The HST/STIS and FUSE observations as well as the time variability of the X-ray data are described in associated papers (D. M. Crenshaw et al., in preparation; J. R. Gabel et al., in preparation; I. M. George et al., in preparation). Detailed photoionization modeling of the X-ray and UV spectra will be discussed in subsequent papers. In this paper we focus on the average high-resolution X-ray spectrum of NGC 3783 obtained from combining 900 ks of exposure time. In §2 we describe the observations and reduction which result in the 900 ks X-ray spectrum. In §3 we study the absorption lines by resolving them and measuring their dynamical properties. In §4 we discuss the emission lines, in §5 we study the spectrum from 4–9 keV focusing on the Fe K line, and in §6 we summarize our results.
2 Observations and Data Reduction
Five observations of NGC 3783 (each of ks duration) were taken with the Chandra/HETGS during the period 2001 February–June. A log of the new observations together with the observation from Kaspi et al. (2001) is given in Table 1. The total exposure time (ONTIME) of the six observations is 900.1 ks, and the total good time interval corrected for detector dead time (LIVETIME) is 888.7 ks. All observations were reduced uniformly and in the standard way using the Chandra Interactive Analysis of Observations (CIAO) software (Version 2.1.2) and its threads of 2001 July 3. Flux calibration of each observation was carried out using the Chandra Calibration Database (Version 2.6). All spectra described below were also corrected for Galactic absorption ( cm-2; Alloin et al. 1995), and the wavelengths were redshift corrected and are presented in the rest frame of NGC 3783.
From the combined zeroth-order images we find the X-ray centroid of NGC 3783 to be at 11h39m017, 44190 with accuracy of 05. This is identical to the X-ray position reported in Kaspi et al. (2001), and consistent with the nuclear position in the radio reported by Ulvestad & Wilson (1984; 11h39m0172, 44193). As described further in I. M. George et al. (in preparation), we detect a number of serendipitous sources surrounding the nucleus, but these and any extended X-ray emission are at such a low intensity that they do not affect any of the conclusions presented here.
The HETGS produces high-order spectra from two grating assemblies, the medium-energy grating (MEG) and the high-energy grating (HEG). Both positive and negative orders are imaged by the ACIS-S array. We combined the 1st and 1st orders for each of the MEG and HEG spectra by averaging them using a 1/ weighted mean (where is the uncertainty) to produce mean MEG and HEG spectra for each observation. We checked for variability within the individual observations and between different observations. Variability is found (at a level of about 30% around the median within the observations and about 50% around the median between the observations) and will be discussed in detail in I.M. George et al. (in preparation). This variability does not materially affect the key results reported here. We have verified that the ACIS chip gaps do not produce any false spectral features in the spectra by detailed comparison of the HETGS response curve of the observation (the ARF) to the final spectrum. The chip gaps are broader than the features discussed here and do not seem to produce any features in the flux calibrated spectrum. Furthermore, our averaging method minimizes any possible effect of the chip gaps as explained in §2 of Kaspi et al. (2001).
In the following sections we have further combined different subsets of the spectra together. For example, all six MEG spectra and all six HEG spectra were combined together to produce 900 ks MEG and HEG spectra, respectively. In all cases here and hereafter the spectra were combined using the 1/ weighted-mean method. The total numbers of counts in the first order in the energy range 0.5–10 keV are 583,196 and 313,861 for the MEG and HEG, respectively. The S/Ns at Å of the combined 900 ks spectra are and for the MEG and HEG, respectively, when using the default CIAO bins of 0.005 Å for the MEG and 0.0025 Å for the HEG (compare the S/Ns of and reported in Kaspi et al. 2001).
The details of the 56 ks observation are discussed in Kaspi et al. (2001). The five new observations were all continuous without any noticeable time gaps or special events during the observations. We checked the background counts for flares and found none. The background level of the HETGS/ACIS is % of the signal which is negligible; hence we did not subtract any background in the following analysis.
We also extracted spectra from the second and third orders for our individual observations and combined them into average spectra in the same way as described above. The resolutions of the second and third order spectra are better than that of the first order by factors of two and three, respectively. These higher order spectra agree well with the spectra extracted from the first order. However, since the effective area of these orders is about an order of magnitude less than the effective area of the first order, the utility of the higher order spectra is limited. The highest effective area (after the first orders) is for the MEG third order (resolution of 0.0077 Å). In the 900 ks MEG third-order spectrum the S/N is when using a bin size of 0.0033 Å. In addition, the wavelength range of the second and third orders is smaller than that of the first order by factors of two and three, respectively; this further limits the utility of the higher order spectra.

3 Absorption Lines
3.1 Basic Line Properties
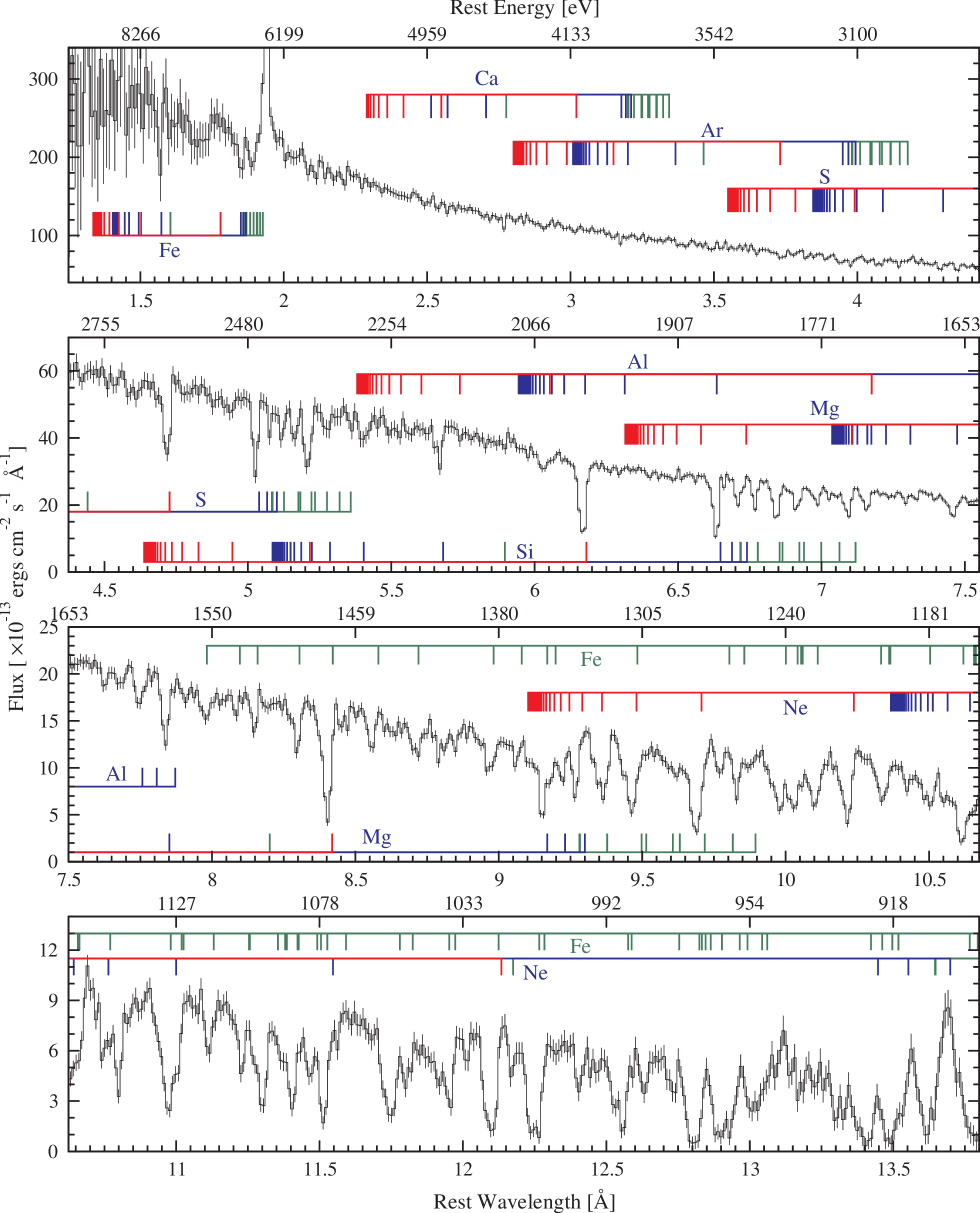
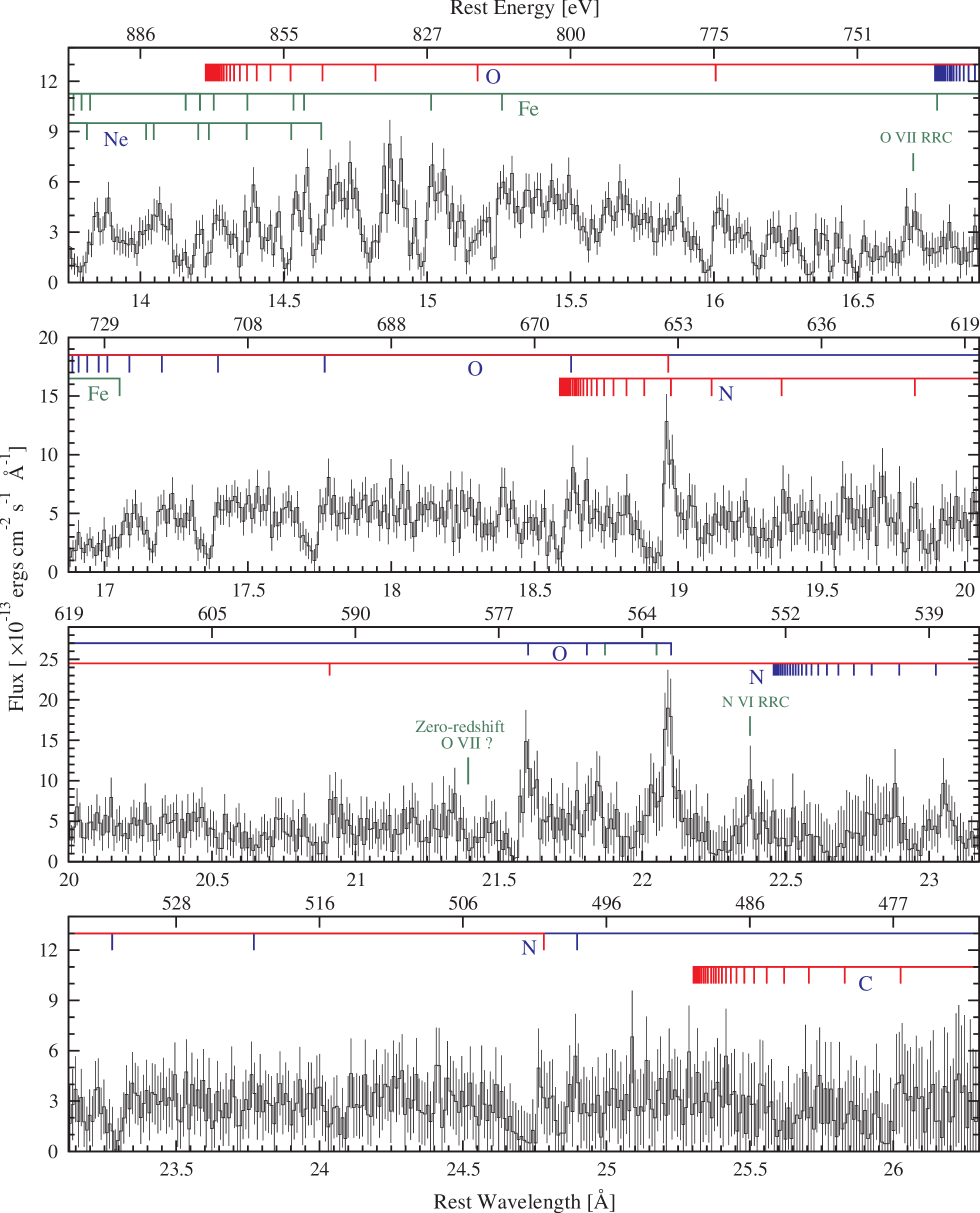
The combined 900 ks spectrum reveals absorption lines from H-like and He-like ions of N, O, Ne, Mg, Al, Si, and S (see Figure 1). For several of these elements we also identify lines from less-ionized ions (see below). There are also many L-shell and M-shell lines of Fe XVII–Fe XXIV as well as probable resonance lines of Fe XXV (see §5). Figure 2 presents the entire energy range of this spectrum in one panel to illustrate the overall continuum, and Figure 3.1 demonstrates the strongest absorption lines resolved by the MEG third-order. To examine further the absorption we created “velocity spectra” by adding, in velocity space, several absorption lines from the same ion (see also Kaspi et al. 2001). The lines were chosen to be the strongest predicted features from a given ion and to be free from contamination by adjacent features. The velocity spectra were built up on a photon-by-photon basis (rather than by interpolating spectra already binned in wavelength). The velocity spectra are shown in Figures 3 and 4. Absorption from H-like and He-like ions is shown separately to enable profile comparison. Absorption is clearly detected for N, O, Ne, Mg, Al, Si, and S. There are also hints of absorption by C, Ar, and Ca, although these are not statistically significant.
About 135 absorption-line features can be identified in the spectrum; many of these are blends of several lines. Since the 900 ks spectrum spans over an order of magnitude in energy, resolution, and S/N, we used different combinations and binnings of the spectrum for measuring the wavelengths and FWHMs of the lines in different wavelength bands. In most of the measurements, we used the HEG spectrum binned to 0.005 Å at short wavelengths (Å), and the combined MEG+HEG spectrum binned to 0.01 Å at longer wavelengths. We fitted a Gaussian to each line combined with a local continuum. The local continuum was determined using wavelength bands where no line features are present or expected (i.e., the “line free zones” of Kaspi et al. 2001). We fitted small regions of the spectrum with a third order polynomial. Since the segments were small ( Å) the fitted continuum was close to a straight line. We note that the real continuum of the source could be different from the local continuum we determine here hence affecting the EW measurements below.
The wavelengths and FWHMs of the lines were determined from the Gaussian fits. However, many line features are blended (mainly with Fe lines in the 8–17 Å band), and in many cases these measurements represent the entire blend and not individual lines. The equivalent width (EW) for each feature was measured directly from the spectrum and not using the Gaussian fitting. Thus
| (1) |
where runs over all bins, is the flux in the th bin, is the underlying continuum flux, and is the bin width in Å. The EW’s uncertainty was derived by propagating the uncertainty on the flux in each bin and the uncertainty in the continuum placement, i.e.,
| (2) |
where is the uncertainty in the mean continuum flux in the “line free zones” adjacent to the measured feature, and is the uncertainty in the flux of each bin. The summation limits were chosen at the endpoints of the line feature where the profile starts to become displaced from the continuum. The EW uncertainties can be used as a measure to assess the detection of a line. We consider lines with EW measurements higher than 2 to be clear detection, while the detections of lines with EW values less than that should be considered with caution. Only a few simple cases allowed line deblending, while other blends are more complex and were measured as such. The line measurements are presented in Table 2. For each line we list the
![[Uncaptioned image]](/html/astro-ph/0203263/assets/x4.png)
The three strongest individual absorption lines from the MEG third-order 900 ks spectrum binned to 0.0033 Å. The resolution is 0.0077 Å. All three lines are clearly resolved.
central wavelength and FWHM as determined from the Gaussian fit, the EW and flux derived for this line (negative EW indicates emission and positive EW indicates absorption), and the main ions contributing to this feature.
We are able to identify almost all line features with EW mÅ. The exceptions are two lines with EW10 mÅ at 12.632 Å and 12.404 Å, one line with EW5 mÅ at 12.169 Å, and several lines with EW2.5 mÅ below 5 Å which are weak and are not necessarily clear detections. We identified many inner-shell lines of S XIV, S XIII, S XII, Si XII, Si XI, Si X, Si IX, Si VIII, Si VII, Mg X, and Mg IX. These are mostly 1–2 inner-shell transitions that are expected to have comparable oscillator strengths to the identified H-like and He-like transitions. Atomic data for these lines have recently been calculated by Behar & Netzer (2002) and our measurements provide confirmation for their presence. The detection of these lines provides valuable information about a wide range of ionization stages for several elements, and the lines will be used in a future publication to constrain photoionization models of the absorbing gas.

In order to constrain the contribution of scattered X-ray emission to our spectrum, we have searched for lines that are “black” (i.e., that drop to zero intensity) or nearly black. We consider only electron scattering which has a cross section that is essentially constant across the Chandra bandpass. The best such region is near 12.8 Å with a blend of two strong Fe XX lines (12.846 and 12.864 Å; see Figure 1). At the bottom of this feature the flux is measured to be ergs cm-2 s-1 Å-1 while the local continuum flux is much larger ( ergs cm-2 s-1 Å-1). This suggests that there is little or no scattering of X-rays around the absorption (i.e., the line-of-sight covering fraction is ); formally we limit the scattered contribution to be % [using the Fe XX (12.846, 12.864) lines].
3.2 Special Absorption Features
A broad absorption feature is seen in the spectrum around 15.5–17 Å (Figure 3.3). We identify this feature as arising from

numerous inner-shell 2–3 absorption lines of Fe M-shell ions blended into an unresolved transition array (UTA; Sako et al. 2001; Behar, Sako, & Kahn 2001). This absorption feature is blended with the O VII (16.778 Å) edge making it impossible to measure the relative intensity of the two. Furthermore, the UTA is also blended with the many O VII absorption lines close to the edge. The presence of the O VII edge, as well as the O VIII edge, is required due to the strong absorption lines seen from these ions (see §3.4) and in order to explain the spectral curvature at low energies ( keV) seen in Figure 2. A detailed model, accounting for all the features and processes together, is needed in order to use these features to constrain the properties of the absorbing gas (H. Netzer et al., in preparation).
Motivated by suggestions for the association of dust with the warm absorber in several AGNs (e.g., Brandt, Fabian, & Pounds 1996; Reynolds 1997; Komossa & Bade 1998; Lee et al. 2001) we looked for dust features in our X-ray spectrum. We do not detect a clear Fe L3 edge at 707 eV (17.54 Å) or Fe L2 edge at 720 eV (17.22 Å), implying no large amount of neutral iron is in our line of sight. The conclusion is not strong because of other predicted strong features in this part of the spectrum. We also looked for the much clearer evidence of a neutral oxygen edge at 538 eV. We find no evidence for such an edge within the S/N of our data and no clear deviation from the adopted power-law around this region (see Figure 2). This result is in agreement with the Reynolds (1997) conclusion that there is little dust along the line of sight to the central source of NGC 3783.
We have looked for the (KLL) resonances of O VI at 22.05 Å and 21.87 Å which are predicted to be strong in some highly ionized gases (Pradhan 2000). We find no evidence for absorption by these lines in our spectrum, though their location on the wings of the strong O VII forbidden and intercombination emission lines may hinder their detection. We set an upper limit on the EW of the O VI 22.05 Å absorption line to be 70 mÅ.
| Observed | FWHM | EWaaNegative signs before the EW indicate an emission line. | FluxbbAbsorbed flux for the absorption lines and emitted flux for the emission lines. | Ion name and transition rest-frame wavelength |
|---|---|---|---|---|
| (Å) | (km s-1) | (mÅ) | () | (Å) |
| Fe XXV (1.573) | ||||
| Fe XXV (1.850) | ||||
| Ca XX (2.514) | ||||
| Ca XX (2.549) | ||||
| Ca XIX (2.571) | ||||
| Ca XIX (2.705) | ||||
| No identification | ||||
| No identification | ||||
| Ca XX (3.020) | ||||
| Ca XIX (3.177) | ||||
| No identification | ||||
| No identification | ||||
| Ar XVIII (3.733) | ||||
| No identification | ||||
| No identification | ||||
| Ar XVII (3.949) | ||||
| S XVI (3.991), S XV (3.998) | ||||
| S XV (4.088) | ||||
| S XV (4.299) | ||||
| No identification | ||||
| No identification | ||||
| No identification | ||||
| S XVI (4.729) | ||||
| Si XIV (4.947) | ||||
| S XV (5.039) | ||||
| S XIV (5.084, 5.086) | ||||
| S XIII (5.126) | ||||
| S XII (5.176, 5.183) | ||||
| Si XIV (5.217), Si XIII (5.223), S XI (5.234) | ||||
| Si XIII (5.286), S X (5.276) | ||||
| Si XIII (5.405) | ||||
| Si XIII (5.681) | ||||
| Al XIII (5.739) | ||||
| Al XIII (6.053) | ||||
| Si XIV (6.182) | ||||
| Si XIII (6.648) | ||||
| Si XII (6.718 ), Mg XII (6.738) | ||||
| Si XI (6.778) | ||||
| Si X (6.854, 6864) | ||||
| Si IX (6.939, 6.923) | ||||
| Si VIII (6.999) | ||||
| Si VII (7.063) | ||||
| Mg XII (7.106) | ||||
| Al XIII (7.173) | ||||
| Mg XI (7.310) | ||||
| Mg XI (7.473) | ||||
| Fe XXI (7.635, 7.639), Fe XXII (7.637, 7.641, 7.645) | ||||
| Fe XXI (7.689), Fe XXII (7.687) | ||||
| Al XII (7.757) | ||||
| Mg XI (7.851) near the Al XII triplet | ||||
| Fe XXI (7.914), Fe XXII (7.898), Fe XXIII (7.914), | ||||
| Fe XXIV (7.982) | ||||
| Fe XXII (8.097) | ||||
| Fe XXI (8.159) | ||||
| Fe XXIII (8.305) | ||||
| Mg XII (8.421) | ||||
| Fe XXI (8.580) | ||||
| Fe XXII (8.720) | ||||
| Fe XXI (8.842, 8.829), Fe XX (8.825, 8.824, 8.822) | ||||
| Fe XXII (8.982) | ||||
| Fe XX (9.080) | ||||
| Mg XI (9.169) | ||||
| Ne X (9.246) blend with Mg XI triplet | ||||
| Ne X (9.291) blend with Mg XI triplet | ||||
| Mg XI (9.300), Ne X (9.291) | ||||
| Ne X (9.362) deblended from Mg IX (9.378) | ||||
| Mg IX (9.378) deblended from Ne X (9.362) | ||||
| Ne X (9.481), Fe XXI (9.483) | ||||
| Ne X (9.708) | ||||
| Ne X (9.708) | ||||
| Fe XVIII (9.804) | ||||
| Fe XIX (9.856) | ||||
| Fe XX (9.999, 10.001, 10.006) | ||||
| Fe XX (10.040, 10.042, 10.054, 10.060) | ||||
| Fe XVII (10.112) | ||||
| Ne X (10.239) | ||||
| Ne X (10.239) | ||||
| Fe XVIII (10.361, 10.363, 10.365) | ||||
| Fe XVII (10.504) | ||||
| Fe XIX (10.650, 10.642, 10.630, 10.631, 10.641), Fe XVII (10.657) | ||||
| Ne IX (10.764), Fe XVII (10.770) | ||||
| Fe XIX (10.828) | ||||
| Ne IX (11.000), Fe XXIII (10.981, 11.019), Fe XVII (11.026) | ||||
| Fe XVII (11.131) | ||||
| Fe XVII (11.254) | ||||
| Fe XVIII (11.326, 11.319, 11.315) | ||||
| Fe XXII (11.427), Fe XVIII (11.423) | ||||
| Fe XXII (11.492, 11.505) | ||||
| Ne IX (11.547) | ||||
| Fe XXII (11.780) deblended from Fe XXI (11.825) | ||||
| Fe XXI (11.825) deblended from Fe XXII (11.780) | ||||
| Fe XXI (11.952, 11.973) | ||||
| Fe XXI (12.056, 12.047) | ||||
| Ne X (12.134), Fe XVII (12.124) | ||||
| Ne X (12.134), Fe XVII (12.124) | ||||
| Ne VII (12.175) | ||||
| Fe XVII (12.266) deblended from Fe XXI (12.284) | ||||
| Fe XXI (12.284) deblended from Fe XVII (12.266) | ||||
| no identification | ||||
| Fe XX (12.576) deblended from Fe XX (12.588) | ||||
| Fe XX (12.588) deblended from Fe XX (12.576) | ||||
| no identification | ||||
| Fe XX (12.754) | ||||
| Fe XX (12.846, 12.864) | ||||
| Fe XX (12.921, 12.903), Fe XIX (12.946, 12.933, 12.932) | ||||
| Fe XIX (13.022), Fe XXI (13.043), Fe XX (13.061) | ||||
| Fe XVIII (13.323) | ||||
| Fe XVIII (13.346) | ||||
| Ne IX (13.447), Fe XIX (13.423, 13.375), Fe XVIII (13.405) | ||||
| Fe XIX (13.518, 13.497) | ||||
| Ne IX (13.553) | ||||
| Ne IX (13.699) | ||||
| Fe XVII (13.825), Fe XX (13.767), Fe XIX (13.795) | ||||
| Fe XVIII (14.143, 14.158) | ||||
| Fe XVIII (14.208) | ||||
| Fe XVIII (14.256) | ||||
| Fe XVIII (14.373) | ||||
| O VIII (14.454) | ||||
| Fe XVIII (14.483) | ||||
| O VIII (14.524), Fe XVIII (14.534) | ||||
| Fe XVIII (14.571) | ||||
| O VIII (14.634), Fe XVIII (14.616) | ||||
| O VIII (14.821) | ||||
| Fe XIX (14.961) | ||||
| Fe XVII (15.014) | ||||
| O VIII (15.176) | ||||
| Fe XVII (15.261) | ||||
| O VIII (16.006) | ||||
| O VIII (16.006) | ||||
| Radiative recombination continuum at the edge of O VII (16.771) | ||||
| O VII (17.200) | ||||
| O VII (17.396) | ||||
| O VII (17.768) | ||||
| O VII (17.768) | ||||
| O VII (18.627) | ||||
| O VII (18.627) | ||||
| O VIII (18.969) | ||||
| O VIII (18.969) | ||||
| N VII (19.361) | ||||
| N VII (19.826) | ||||
| N VII (20.910) | ||||
| N VII (20.910) | ||||
| O VII (21.602) | ||||
| O VII (21.602) | ||||
| O VII (21.807) | ||||
| O VII (22.101) | ||||
| Radiative recombination continuum at the edge of N VI (22.458) | ||||
| Instrument feature | ||||
| Instrument feature | ||||
| N VI (23.277) | ||||
| N VII (24.781) | ||||
| N VII (24.781) | ||||
| N VI (24.898) | ||||
| N VI (24.898) | ||||
| C VI (26.026) | ||||
| C VI (26.026) |
2
Assuming a single absorbing system with a Doppler velocity of 350 km s-1 (see §3.4 below) an upper limit for the column density of O VI is cm-2. This upper limit is in agreement with the simultaneous FUSE observations of the O VI absorption lines (J. R. Gabel et al., in preparation) and with the models presented by Kraemer et al. (2001) and Kaspi et al. (2001).
Kaspi et al. (2001 §6.2) argued against the possibility that the absorption features they detected arise from intervening material in our Galaxy (in particular the high-velocity cloud seen toward NGC 3783; Lu et al. 1998). The same considerations still hold, and the current paper confirms that the absorption is indeed intrinsic to NGC 3783. The high S/N of our spectrum allows us to look for possible Galactic or intergalactic absorption at zero redshift. The most probable line is O VII (21.602 Å) which, in Figure 1, would be at 21.393 Å. A feature is seen at this wavelength, but it is too weak ( mÅ) to ascribe any significance to it. Further detailed discussion and modeling of the multiwavelength Galactic absorption toward NGC 3783 will be discussed by S. Mathur et al. (in preparation).
3.3 Correlations Between Line Properties
Given that we observe absorption lines spanning a large range of energy and ionization potential, it is interesting to look for correlations between the line properties. However, as mentioned above most of the lines in Table 2 are blended, some have low S/N, and many are unresolved by the HETGS. Out of the 135 absorption features listed in Table 2, we chose the 42 lines which are not blended and are strong enough for accurate velocity-shift and FWHM measurements (EW mÅ). We first deconvolved the instrumental FWHMs from the measured FWHMs to obtain true FWHM values, i.e., . We find that 31 lines are resolved, i.e., , and that 18 are resolved at the 3 level. We list the 42 lines with their velocity-shift and FWHMtrue in Table 3. The wavelength accuracy of the inner-shell lines is not as good as the H-like and He-like lines; therefore, they were not included in this table. We checked if the blueshifts and FWHMs are correlated with wavelength. We find no such correlations. This confirms that our blueshift and FWHM
![[Uncaptioned image]](/html/astro-ph/0203263/assets/x7.png)
Broad absorption feature from blended inner-shell 2p-3d absorption lines of Fe M-shell ions forming the UTA. Data are the same as shown in Figure 1 focusing on the 15–18 Å range.
measurements are not affected by systematic instrumental effects. We also do not find any correlation between the blueshift and FWHM of the different lines.
Several studies have found the widths of the optical narrow emission lines in NGC 3783 and their blueshifts relative to the systemic velocity to correlate with the ionization potentials needed to create the relevant ions (e.g., Pelat, Alloin, & Fosbury 1981; Evans 1988). This has motivated us to search for similar trends in the many absorption lines seen in the X-ray as they span a large range of ionization potential (obviously, we do not expect a simple dynamical connection between the optical narrow emission lines and the X-ray absorption lines). Figure 3.3 shows the blueshift and FWHMtrue values of individual lines as a function of the ionization potential required to produce the relevant ions. No correlation is found between these properties. However, an interesting trend is revealed by color-coding the different transitions in each ion presented in Figure 3.3a. For a given ion, the blueshifts seem to diminish from the 12 transition to the 13 transition and so on. Such an effect can be caused by the filling of the absorption troughs with emission which weakens as one advances along the transition series. This will cause the 12 transition’s absorption to be filled more on its red side than the 13 transition’s absorption, causing the apparent wavelength shift to be larger. Such a phenomenon might also be related to the kinematics of outflows with scattering. However, a full detailed model of the outflow (e.g., H. Netzer et al. in preparation) is needed in order to further discuss this. Figure 3.3 shows the correlation between absorption-line blueshift and the transition number for O VII and O VIII. Attempting to quantify the correlation we find that the Spearman rank-order correlation is not suitable in this case since we have a totally concordant ranking sequence. We used the nonparametric Kendall test (Press et al. 1992 §14.6) which yields correlation coefficients of with significance levels of 0.0415 for both ions. We note that no correlation is found between the FWHM and the transition number for a given ion (Figure 3.3b).
In order to look for real correlations between the blueshift and FWHMtrue values of individual lines and the ionization po-
TABLE 3
Properties of Unblended Strong Lines
Ion name and
Velocity Shift
FWHMtrue
transition rest-frame wavelength
(km s-1)
(km s-1)
(Å)
S XVI (4.729)
S XV (5.039)
Si XIII (5.681)
Si XIV (6.182)
Si XIII (6.648)
Mg XII (7.106)
Al XIII (7.173)
Mg XI (7.473)
Al XII (7.757)
Fe XXI (8.159)
Fe XXIII (8.305)
Mg XII (8.421)
Fe XXII (8.720)
Fe XXII (8.982)
Mg XI (9.169)
Ne X (9.708)
Fe XVII (10.112)
Ne X (10.239)
Fe XIX (10.828)
Ne IX (11.547)
Fe XXII (11.780)
Fe XXI (11.825)
Fe XVII (12.266)
Fe XXI (12.284)
Fe XX (12.588)
Fe XX (12.754)
Fe XVIII (13.323)
Fe XVIII (13.346)
Fe XVIII (14.208)
Fe XVIII (14.256)
Fe XVIII (14.373)
Fe XVIII (14.534)
O VIII (14.821)
Fe XIX (14.961)
Fe XVII (15.014)
O VIII (15.176)
O VIII (16.006)
O VII (17.200)
O VII (17.396)
O VII (17.768)
O VII (18.627)
O VIII (18.969)
tential, the effect of filling of the absorption trough with emission needs to be taken into account. Inspection of Figure 3.3 suggests that the only absorption line which looks obviously contaminated by the emission is O VIII (18.967); hence, we looked for correlations after ignoring this line. Again no correlations were found; Spearman rank-order correlations yield (significance level of 0.31) for Figure 3.3a (blueshifts) and (significance level of 0.21) for Figure 3.3b (FWHMs). The per degree-of-freedom (dof) for a constant fit in Figure 3.3a (blueshifts) is 6.4, and in Figure 3.3b (FWHMs) it is 2.4. These results suggest that the blueshift and the FWHM are not consistent for all the species. The mean blueshift is km s-1, and the mean FWHM is km s-1 (the uncertainties are the standard deviation of the measurements). We note that correlations between velocity or FWHM and the ionization potential were also not found in the UV band (D. M. Crenshaw et al., in preparation; J. R. Gabel et al., in preparation).
![[Uncaptioned image]](/html/astro-ph/0203263/assets/x8.png)
Absorption-line (a) blueshifts and (b) FWHMs as a function of the ionization potential of the relevant ion (the energy needed to create the ion). No trend or correlation between blueshifts or FWHMs with the ionization potential is detected. The ions are listed above the figure. The different transitions in the H-like and He-like ions from the ground level to upper levels are color coded as following: level 2 — red squares, level 3 — green diamonds, level 4 — blue triangles up, level — 5 magenta triangles down, and level 6 — orange stars. A trend for the lower-level transitions to have lower velocity blueshifts (i.e., smaller shifts from the expected wavelength of the line) is seen. We attribute this to filling of the absorption trough with emission as explained in the text. Average values for each panel are plotted as horizontal dashed lines, and the standard deviations are plotted as horizontal dotted lines.
![[Uncaptioned image]](/html/astro-ph/0203263/assets/x9.png)
Absorption-line blueshifts as a function of , where is the number for the 1 transition. Squares denote O VII lines, and circles denote O VIII lines. The correlation detected suggests the blueshifts diminish from the 12 transition to the 13 transition and so on.
![[Uncaptioned image]](/html/astro-ph/0203263/assets/x10.png)
Simulation of photon scattering into the absorption trough, preventing it from becoming truly black. The solid line is the input spectrum which has a typical shape of lines at around 20 Å in our 900 ks spectrum. Photons are drawn from this input spectrum and are scattered in a Gaussian distribution (which has the MEG’s FWHM: 0.023 Å) along the velocity axis. Even though the initial spectrum (solid line) is black, the absorption in the resulting spectrum (black dots with error bars) is smeared and thus does not appear black.
3.4 Curve of Growth Analysis
Curve of growth analysis (as it is formulated in Spitzer 1978) was carried out to obtain ionic column densities using the measured absorption-line EWs. This technique is most useful when the lines are resolved and unsaturated. In the following we address these issues for H-like and He-like ions in the X-ray spectrum of NGC 3783.
O VII and O VIII lines are identified up to the 16 and 18 transitions, respectively. Identification of lines of such high transitions means that the first lines in each series are probably saturated as they have much larger ( times) oscillator strengths. We note that though the first lines in each series are probably saturated, we see the effect of “non-black” saturation. This is probably because the resolution of the instrument is comparable to the true line widths. In this case the convolution of saturated lines with a line-spread function of similar width will cause photons to scatter from the continuum (and any line emission redward of the trough) into the absorption trough preventing it from becoming black, even though the line is saturated. We have carried out Monte-Carlo simulations which have confirmed the importance of this effect in our spectra (Figure 3.3). We have also searched for a correlation between the EW and FWHMtrue of lines for certain ions; such a correlation is expected if the lines are saturated. Unfortunately, due to the large uncertainties on FWHMtrue, we were unable to detect such a correlation. A related problem is the filling of the absorption trough by emission discussed in the previous section. This is more significant in the first lines in the series where the emission is stronger. Also, the scattered X-ray continuum, which we constrained to % of the continuum (§3.1), can contribute to the non-black saturation we observe.
All the above suggest that reliable curve of growth analysis can be carried out only for the lines representing transitions to high levels which are not saturated and where line emission is weak. We used the 15 and 16 transitions in both O VII and O VIII. From the FWHMtrue of the lines we estimate the Doppler velocity to be about 350 km s-1. Curve of growth analysis assuming a single absorption system yields column densities of cm-2 and
TABLE 4
Column Density Measurements
Ion
Column [cm-2]
Ion
Column [cm-2]
O VII
O VIII
Mg XI
Mg XII
Al XII
Al XIII
Si XIII
Si XIV
S XV
S XVI
Si XI
Si X
Si IX
Si VIII
Si VII
S XIV
S XIII
S XII
cm-2. The corresponding absorption-edge optical depths are and . These values should be considered as lower limits due to the fact that multiple systems might exist in these ions as explained in §3.5. Furthermore, these values are inconsistent with the absorption-edge optical depths seen in the spectrum (e.g., Figure 2) which are about a factor two larger. This can be remedied by assuming multiple absorption systems. For example, assuming two absorption systems, each with a Doppler velocity of 120 km s-1 (comparable to the ones observed in the UV), which contribute equally to the EW results in and . Further analysis of this issue is postponed for the detailed modeling paper (H. Netzer et al. in preparation).
The Ne IX and Ne X absorption lines suffer the same problems as the above-mentioned oxygen lines. An additional problem with the neon absorption lines is that most of them are blended with iron lines which hinders curve of growth analysis. Higher ionization ions (H-like and He-like ions of Mg, Al, Si, and S) are probably free of saturation and filling of the trough as we detect only the first few lines in their series, and their emission is hardly detected. However, if multiple unresolved systems are present in these ions the yielded column densities would be in error. Bearing in mind these limitations we carried out curve of growth analysis for these ions under the assumption of one absorption system with a Doppler velocity of 350 km s-1. For each ion we used lines that are not blended (typically between 1 to 3 lines per ion). The measured column densities are presented in Table 4.
3.5 Multiple Absorption Components
Recent high-resolution X-ray studies have shown that several X-ray absorption systems can be present in the outflows from AGNs. Two X-ray absorption systems were reported by Sako et al. (2001) for IRAS 13349+2438 and by Collinge et al. (2001) for NGC 4051. In the X-ray spectrum of NGC 3783 (Figures 3 and 4), most absorption lines show asymmetric profiles in that the blue wing extends to higher velocities (relative to the line centroid) than the red wing. This could be caused by another absorption system at higher outflow velocity and/or because the emission lines (redward of the absorption) are filling the absorption trough. The latter possibility, mentioned in §3.3, was demonstrated in the model presented by Kaspi et al. (2001) and will be discussed by H. Netzer et al. (in preparation). The 900 ks exposure allows us to study the possibility of multiple absorption systems. To explore this we checked individually (and in various combinations) all the absorption lines from the H-like and He-like ions. We show the best cases (the
![[Uncaptioned image]](/html/astro-ph/0203263/assets/x11.png)
Velocity spectra, binned at 100 km s-1, of (a) the combined four strongest lines of O VII (21.602, 18.627, 17.768, and 17.396 Å) from the MEG spectrum and (b) the combined two strongest (un-blended with iron) lines of Ne X (Ly 10.239 Å and Ly 9.708 Å) from the HEG spectrum. A three-Gaussian fit for each spectrum individually is overplotted as a solid line on the data points (models 2 and 4 of Table 5 for O VII and Ne X, respectively). A three-Gaussian fit in which the positions and the FWHMs are fixed for the two spectra together is plotted as a dashed line (model 5 of Table 5; see text for details). Two absorption systems are clearly detected in O VII and probably exist in Ne X as well. Black squares with horizontal error bars indicate the velocity shifts and FWHMs of the UV absorption systems (the UV absorbers velocity shifts are also marked with dotted vertical lines to guide the eye). Their agreement with the O VII absorption and disagreement with the Ne X absorption suggest that higher ionization ions reside in a somewhat dynamically distinct region from lower ionization ions.
combination of best resolution and number of counts) in Figure 3.5. The discussion below assumes the simple approach that the data can be represented by discrete Gaussian fits. The alternative approach of having a single medium with gradients of ionization, density, and outflow velocity instead of separate absorbers (e.g., Krolik & Kriss 2001) requires detailed modeling and will not be discussed here.
In Figure 3.5a we show the velocity spectrum of the combined four strongest lines of O VII, and in Figure 3.5b we show the velocity spectrum of the combined two strongest (unblended with iron) lines of Ne X. We fitted both velocity spectra with a combination of a constant continuum and three Gaussians; two in absorption and one in emission. The fit parameters are given in Table 5 (model 2 for O VII and model 4 for Ne X). For comparison, we also list the fits with one Gaussian in absorption and one in emission (model 1 for O VII and model 3 for Ne X). To check for a statistically significant improvement in fit quality when using two absorbing Gaussians instead of only one, we used the -test (Bevington & Robinson 1992). For O VII
| Parameter | Model 1 | Model 2aaShown in Figure 3.5. | Model 3 | Model 4aaShown in Figure 3.5. | Model 5aaShown in Figure 3.5. |
|---|---|---|---|---|---|
| Ion | O VII | O VII | Ne X | Ne X | O VII & Ne X |
| Constant [counts] | & | ||||
| Absorption system 1 | |||||
| Center [km s-1] | |||||
| FWHM [km s-1] | |||||
| Normalization [counts] | & | ||||
| Absorption system 2 | |||||
| Center [km s-1] | |||||
| FWHM [km s-1] | |||||
| Normalization [counts] | & | ||||
| Emission | |||||
| Center [km s-1] | |||||
| FWHM [km s-1] | |||||
| Normalization [counts] | & | ||||
| Statistics | |||||
| Data points | 58 | 58 | 58 | 58 | 58 & 58 |
| 68.8 | 44.0 | 44.8 | 36.5 | 109.9 | |
| d.o.f. | 51 | 48 | 51 | 48 | 102 |
| 1.4 | 0.92 | 0.88 | 0.76 | 1.1 | |
| ProbabilitybbThis is the -value which measures the probability that a value of as poor as the one found should occur by chance (Press et al. 1992 §15.2). | 0.049 | 0.64 | 0.72 | 0.89 | 0.28 |
Note. — Uncertainties are 1 (68.3% confidence) and were computed using the PROJECTION command in the SHERPA fitting tool of CIAO. This command varies a given parameter along a grid of values while the values of all the other free parameters are allowed to vary to new best-fit values.
2
(Ne X) we compute an -statistic, (10.9); here (0.76) is the reduced for the model with two absorption lines. Since the additional absorption line adds three parameters the per parameter is 9.0 (3.6). The probability of observing (3.6) for and dof is % (5%) (Table C5 of Bevington & Robinson 1992). Thus, the confidence level for the presence of two absorption systems instead of one in O VII is % and in Ne X is %. Given that , it is worth examining the significance of the additional component if we set . In that case, when repeating the above calculation, the confidence level is 99.3% for O VII and 90% for Ne X. Thus, these data indicate that there are two X-ray absorption systems detected in O VII and probably two systems in Ne X.
The fits presented in Table 5 indicate that the outflow velocities of the two absorption systems in O VII are inconsistent with those of Ne X (if two systems exist in the latter). One possible explanation is that the two ions are present in different proportion in the different outflowing components, and each has its own mean outflow velocity. Another explanation is that since the O VII emission is stronger than the Ne X emission (as indicated in Figures 1 and 3) the trough of the O VII absorption is getting filled more than the Ne X trough, shifting the O VII trough minimum to higher velocities than is the case for the Ne X trough. This latter explanation is reinforced by comparing the two panels of Figure 3.5: while the blue wing of the absorption has approximately the same velocity structure for the two ions, the red wing of the O VII absorption is significantly blueshifted when compared to the red wing of the Ne X absorption. The stronger emission of O VII seems to fill more of its absorption trough. We note that Gaussian models for these lines might not be perfect, and this limitation in the modeling might cause the O VII and Ne X absorption systems to have different apparent velocities due to filling of the trough.
We tried to constrain the latter possibility by fitting the O VII and Ne X simultaneously with the same model (note that the instrumental resolutions nearly the same for both lines as explained below). We fitted the two velocity spectra with three Gaussians while constraining the position and the FWHM of each Gaussian to be the same for each spectrum; the continuum fluxes and the normalizations of the three Gaussians were left free for each spectrum. The results are presented as model 5 in Table 5 (dashed line in Figure 3.5). This model does not fit adequately the data (); it systematically deviates from the data points near the absorption troughs, and has a poor fit to the Ne X emission feature. Thus, we cannot firmly confirm that the absorption in both ions arises from the same two systems.
The instrumental resolution, given in Gaussian FWHM, at the wavelengths of the combined lines is 318–396 km s-1 for the O VII lines and 353–372 km s-1 for the Ne X lines. The resolution of the velocity spectra of Figure 3.5 is a combination of those resolutions. In the following we consider the worst resolution for each of the ions, and we use the individual fits for each ion (models 2 and 4 in Table 5). We find that the widths of the two absorption systems of O VII are consistent with the instrumental resolution, so they are unresolved individually; upper limits are 550 km s-1 for the low-velocity system and 280 km s-1 for the high-velocity system. For Ne X, if two systems exist, the fit (model 4) seems to resolve the individual systems with FWHMs of km s-1 and km s-1 for the low and high velocity systems, respectively. For a single Gaussian model the lines are much broader than the instrumental width, and their velocity dispersion can be determined, though these fits are inferior in statistical quality as discussed above.
The above differences between the O VII and the Ne X profiles suggest that the absorbers in the two ions have different dynamical structure, and filling of the troughs by emission only has a secondary effect. While two distinct narrow absorption systems are found in O VII, the significance of the two systems in Ne X is lower, and both are resolved. This may indicate that we are seeing a manifestation of a more complex unresolved velocity structure. Such a case was discussed by Collinge et al. (2001) for NGC 4051 where as many as 10 UV absorption systems were identified which are consistent in velocity shift with only one of the two observed X-ray absorption systems. In the case of NGC 3783 there are the three UV systems described in §1 which are marked in Figure 3.1. While the highest velocity absorption system in the UV is consistent with the corresponding one seen in the X-rays, the two lower velocity UV systems cannot be resolved with the HETGS.222We note that although the Ne X Ly line is clearly resolved by the MEG third-order spectrum (see the bottom panel of Figure 3.1), the poor S/N does not enable better constraints than those presented here. In addition, while the velocities of the UV absorption systems agree with the O VII absorbers, the Ne X absorption is shifted relative to the UV absorption systems. This reinforces the suggestion that while O VII has the same dynamical structure as the low-ionization lines seen in the UV, the higher ionization line Ne X has a different dynamical structure. This suggestion is also supported by Kraemer et al. (2001) who find different levels of ionization for different UV absorption systems, and by the George et al. (1998) result of different X-ray absorbing components with different ionizations based on variability considerations.
4 Emission Lines and Radiative Recombination Continua
The combined 900 ks spectrum shows emission lines. These lines are mainly the He-like triplets (resonance—, intercombination—, and forbidden— lines) of O VII, Ne IX, and Mg XI as well as Ly lines from the H-like species of these elements. Measurements of the identified emission lines are presented in Table 2 (emission lines are noted with negative EWs). The line velocities are consistent with the systemic velocity of NGC 3783 with no apparent systematic redshift or blueshift; the average and rms shift of the 17 emission lines is km s-1.
The flux ratios of the triplet lines can serve as density and temperature diagnostics for photoionized media. We tried to apply the theoretical triplet line ratios calculated by Porquet & Dubau (2000) in order to estimate the physical conditions in the emitting gas of NGC 3783. The line ratios used in such an analysis are and . The calculations account for recombination and collisional processes. They do not include line pumping (“continuum fluorescence”, i.e., absorption followed by emission in resonance lines) which depends strongly on the emission geometry and the line widths. This process can change the resonance-line intensity in the warm absorber environment leading to inaccuracy in determining .
![[Uncaptioned image]](/html/astro-ph/0203263/assets/x12.png)
Emission lines from He-like ion triplets (resonance, intercombination, and forbidden lines, as marked in the panels). (a) O VII from the MEG binned to 0.01 Å. (b) Ne IX from the MEG binned to 0.005 Å. (c) Mg XI from the MEG+HEG binned to 0.005 Å. The fitted local continuum is plotted as a solid line in each panel. In (b) and (c) the lines blended with the triplets are marked. The un-labeled vertical marks in (c) denote the Ne X lines which are blended with the Mg XI triplet. All lines are marked at their rest wavelengths.
Using the local continuum (§3.1) and the line intensities (Table 2), we find the measurement of the Mg XI and Ne IX triplets to be problematic (see Figure 4). The Mg XI triplet is heavily blended with Ne X and iron lines which makes it unreliable for our analysis. Also, the line in Ne IX is blended with iron lines, and this prevents the use of this line and its resulting in our analysis. However, a qualitative examination of Figure 4 shows that the sum of the forbidden and intercombination line intensities are much larger than the intensity of the recombination line. According to the Porquet & Dubau (2000) calculations, (which is consistent with the Ne IX triplet measurements) implies that the plasma emitting the lines is photoionization dominated (with little collisional ionization), and the upper limit on its temperature is K. The density diagnostic for the Ne IX triplet is which constrains the density to have an upper limit of cm-3.
The O VII triplet region is free from contaminating lines though the S/N of the spectrum there is low compared to the shorter wavelengths. For this ion we find and . Such a may indicate the plasma is not purely photoionized and collisional effects are important. It can also indicate that radiation pumping is significant since it preferentially adds to the intensity of the line resulting in small value of . A proper modeling which accounts for all the above effects will be presented in H. Netzer et al. (in preparation). As the errors on the fluxes of the O VII and lines are large (Table 2), we are only able to use the density diagnostic to constrain the density to have an upper limit of cm-3.
Two emission features at 16.695 Å and 22.376 Å are identified near the O VII and N VI edges, respectively. We identify these as radiative recombination continuum (RRC) emission. The widths of these features can be used to estimate the temperature of the plasma. The RRC emission feature should peak at the edge energy and sharply decrease toward higher energies, with a temperature-dependence profile. The highest velocity shift we find in the O VII RRC emission is 2000 km s-1. This can be used to estimate a lower limit of 60,000 K on the temperature of the plasma.333We used the formalism as in Rybicki & Lightman (1979) with radiative recombination coefficients from Aldrovandi & Pequignot (1973). The N VI RRC emission yields the same result.
5 The Iron K Line Region
Kaspi et al. (2001) detected a narrow Fe K line around 6.4 keV in the high-resolution X-ray spectrum of NGC 3783 but were only able to place an upper limit of 3250 km s-1 on its FWHM due to the limited S/N. Our combined 900 ks exposure has allowed us to measure this line precisely. Figure 5 shows the HEG spectrum in the region of the Fe K line. A Gaussian fitted to the 0.0025 Å binned spectrum (Figure 5b) gives a central wavelength of Å ( eV) which is consistent with the Fe K line from Fe I to Fe XI (at the rest frame velocity system of NGC 3783). Interestingly, the Fe K line in Figure 5b shows two peaks (though these are not resolved) which are consistent with the two expected Fe K lines for Fe I, K at 1.936 Å (6403.84 eV) and K at 1.940 Å (6390.84 eV) and a branching ratio of 2:1 (Bearden 1967; Bambynek et al. 1972). We fitted the HEG spectrum with two Gaussians fixed at the wavelengths of the Fe K lines and with the same branching ratio. We find the FWHM of the Gaussians to be mÅ and, when taking into account the instrumental FWHM of 12 mÅ, we get a true FWHM of mÅ. This FWHM corresponds to km s-1 at the wavelength of the Fe K line. Fitting the data with only one Gaussian yields a consistent result of FWHM km s-1.
The gas emitting the optical emission lines in NGC 3783 shows an increase in its density, ionization parameter, and velocity dispersion of its emitting clouds toward the central ionizing source (Pelat, Alloin, & Fosbury 1981; Atwood, Baldwin, & Carswell 1982; Evans 1988; Winge et al. 1992). The FWHM velocity dispersion in the broad line region (BLR) of NGC 3783 is 4000 km s-1 (Reichert et al. 1994; Wandel, Peterson, & Malkan 1999; FWHM km s-1). The FWHM velocity dispersion in the narrow line region (NLR) is 100–700 km s-1 (Pelat et al. 1981; Evans 1988). Winge et al. (1992) analyzed the optical spectrum of NGC 3783, decomposing the broad and narrow emission lines into several Gaussians components. They modeled the optical spectrum with four main regions: narrow (FWHM835 km s-1), intermediate (835FWHM1670 km s-1), broad (3000FWHM3340 km s-1), and very broad (FWHM6680 km s-1). The FWHM we find for the narrow Fe K line ( km s-1) falls at the edge of their intermediate region toward the broad region. Assuming a simple anticorrelation of line width with radial location in a virialized system, the origin of this feature could be between the BLR and the
![[Uncaptioned image]](/html/astro-ph/0203263/assets/x13.png)
HEG spectrum around the Fe K feature: (a) binned to 0.005 Å and (b) binned to 0.0025 Å. In (b) the two Fe K lines are marked. Also shown are the theoretical wavelengths of Fe XXV and Fe XXVI absorption lines as well as the forbidden and intercombination lines of Fe XXV (dotted line).
NLR, which is the location of the putative torus. In a recent study Onken & Peterson (2002), find the BLR in NGC 3783 is virialized and deduce the central mass to be . Adopting this central mass and using equation 5 of Kaspi et al. (2000b), we estimate that the narrow Fe K line is emitted at a distance of lt-days ( cm) from the central source. This places the narrow Fe K region at the outer parts of the BLR or the inner part of the torus. This result is similar to the one found found by Yaqoob et al. (2001) for the narrow Fe K emission line in NGC 5548. Detailed reverberation mapping studies may be able to test this result. The EW of the narrow Fe K line is mÅ ( eV), and its flux is . This is consistent with the predicted flux arising from a central torus (see the discussion in §7.1 of Kaspi et al. 2001).
We searched the spectrum for narrow neutral lines from abundant elements other than iron and found none. A standard reflection model predicts such lines to have EWs of less than about one eV (e.g., Matt, Fabian, & Reynolds 1997) which cannot be detected in our data. We also do not detect neutral iron K edge at 7.1 keV. The derived upper limit for the absorption optical depth of such an edge is 0.1.
Looking at the binned spectrum in Figure 1, it is clear that the narrow Fe K line has a more complex profile than that of a single Gaussian and seems to have a red wing extending to Å ( keV). A plausible explanation for this red wing is the “Compton shoulder” (e.g., Iwasawa, Fabian, & Matt 1997 and references therein) produced by Compton scattering in Compton thick, cold material like the one suggested for the obscuring torus. The 6.2–6.4 keV shoulder has a total flux of , and an EW of mÅ, i.e., % of the total line flux. These numbers are in agreement with previous models and observations of such a shoulder (e.g., Iwasawa et al. 1997), and indicate that the line comes from matter that is Compton thick.
The X-ray spectrum (Figure 5) shows a hint of the Fe K line expected to be at 1.757 Å (7058 eV) and predicted to have about 11% of the Fe K flux. Figure 5 also shows the line features expected from Fe XXV and Fe XXVI. There are possibly two absorption lines identified from Fe XXV, at 1.573 Å (EW= mÅ) and 1.850 Å (EW= mÅ). However, due to the poor S/N and resolution (), we can make no strong claim about the reality of these features.
A broad Fe K line has been observed in ASCA spectrum of NGC 3783 (Nandra et al. 1997; George et al. 1998), attributed to emission from the inner accretion disk (Fabian et al. 1989). The superior resolution of the Chandra gratings can be used to deconvolve any narrow components of the line, which can significantly affect the derived spectral parameters (e.g., Weaver & Reynolds 1998; Yaqoob et al. 2001). In order to explore whether these Chandra data indicate the presence of a broad, disk-line component requires a global model that accounts fully for the effects of ionized absorption on the continuum. A full treatment of the broad Fe K line will be presented in a future paper.
6 Summary
The bright Seyfert 1 galaxy NGC 3783 was observed with the Chandra/HETGS for a total of 850 ks during the Spring of 2001 as part of an intensive study which also included RXTE, HST/STIS, FUSE, and ground-based observations. In this paper we have presented the mean 900 ks high-resolution X-ray spectrum (including 56 ks of observation from January 2000). Our main results are as follows:
-
1.
The 900 ks spectrum reveals strong absorption lines from H-like and He-like ions of N, O, Ne, Mg, Al, Si, and S. We also detect inner-shell lines from lower ionization ions of Mg, Si, and S. We suggest a possible detection of lines from H-like and He-like ions of Ar and Ca, and from H-like C. There are also many absorption lines from iron ions; L-shell lines of Fe XVII–Fe XXIV, lines from Fe M-shell ions (UTA), and possibly resonance lines from Fe XXV are seen.
-
2.
Out of the 135 detected absorption features we consider 42 to be unblended and to have good S/N. The mean outflow velocity obtained from these lines is km s-1, and the mean FWHM is km s-1. We do not find any correlation of the velocity shifts or the FWHMs with ionization potentials. We further do not find these characteristics to be consistent with a constant value, probably due to line emission “filling in” the absorption.
-
3.
We resolve the O VII lines into two outflowing systems at and km s-1 which are not individually resolved. The detection of the second O VII absorption system confirms its prediction by Kraemer et al. (2001) which was based on their model for the UV absorption systems. The Ne X lines possibly have two absorption systems at and km s-1 which are marginally resolved to have FWHMs of km s-1. The detection of these systems is only marginally statistically significant. We do not find the O VII velocity structure to be entirely consistent with the structure of Ne X, suggesting the two ions are arising from regions that are somewhat dynamically distinct.
-
4.
The outflow velocities we find for the two X-ray absorbing systems are consistent with the three absorption systems found in the UV at about , , and 560 km s-1 (Kraemer et al. 2001). Although the HETGS does not have the resolution to resolve these three systems, the overall velocity range is the same; thus it seems plausible that there are more than two absorption systems in the X-ray spectrum.
-
5.
We have attempted a detailed curve of growth analysis of the spectrum. However, three factors limit such an analysis: (1) The probable presence of unresolved multiple absorption systems must be taken into account, (2) In several cases it appears that the emission line adjacent to the blueshifted absorption is filling the absorption. Thus, the measured EWs do not represent the true absorption, and (3) It is likely that some absorption lines are saturated though they are not black due to the limited resolution, the filling of the trough with emission, and scattered X-ray continuum photons. In our curve of growth analysis we used the simplified assumption of having one absorption system with Doppler velocity of 350 km s-1and list the results in Table 4. In particular we find the predicted absorption edge optical depths of O VII and O VIII to be and which indicate that oxygen edges are present in spectrum. Furthermore, these values are too small to explain the observed absorption-edge optical depths. To explain this one needs to assume at least two absorption systems with a Doppler velocities of 120 km s-1. This yields and .
-
6.
About two-dozen emission features are detected in the spectrum mainly from the He-like triplets of O VII, Ne IX, and Mg XI as well as the Ly lines from the H-like species of these elements. The emission lines are consistent with being at the systemic velocity of NGC 3783.
-
7.
We detect radiative recombination continuum emission near the edges of N VI and O VII. The lower limit on the temperature derived from the width of these RRCs is K.
-
8.
Table 2 and Figure 3.5 show that for almost all lines the emission EW is smaller than the absorption EW. This indicates that the global covering factor must be smaller than the line-of-sight covering factor (which is ). This is consistent with the covering factors used in the model presented by Kaspi et al. (2001) and will be discussed in a future publication.
-
9.
We resolve the narrow Fe K line to have a FWHM of km s-1. This line is at Å ( eV) and has an EW of mÅ ( eV). We detect a small (EW = mÅ) red wing of the line which extends down to 6.2 keV. A likely explanation for the red wing is a “Compton shoulder” which indicates the presence of cold, Compton-thick gas. The treatment of the broad component of the Fe K line (which has been observed in this object in previous ASCA observations) requires a global model that accounts fully for the effects of ionized absorption on the continuum. This will be discussed in a future paper.
In this paper we have presented the best mean spectrum (in terms of the combination of signal-to-noise and resolution) ever obtained for an AGN in the X-ray band. We presented the measured properties of the many line features detected in the spectrum and simple interpretations. An accompanying paper (I. M. George et al., in preparation) will present the time variability properties of this spectrum. Subsequent work will focus on modeling this superb spectrum and on its relation to other wavelength bands. This high-resolution spectrum demonstrates the wealth of information that can be extracted from high resolution X-ray data. Combined with information from all other wavelength bands, it is leading to a much deeper understanding of the inner regions of AGNs.
References
- Aldrovandi & Pequignot (1973) Aldrovandi, S. M. V., & Pequignot, D. 1973, A&A, 25, 137 (erratum 47, 321 [1976])
- Alloin et al. (1995) Alloin, D. et al. 1995, A&A, 293, 293
- Atwood, Baldwin, & Carswell (1982) Atwood, B., Baldwin, J. A., & Carswell, R. F. 1982, ApJ, 257, 559
- Bambynek et al. (1972) Bambynek, W., Crasemann, B., Fink, R. W., Freund, H.-U., Mark, H., Swift, C. D., Price, R. E., & Rao, P. V. 1972, Reviews of Modern Physics, 44, 716
- Bearden J. A. (1967) Bearden, J. A. 1967, Review of Modern Physics, 39, 78
- Behar & Netzer (2002) Behar, E., & Netzer, H. 2002, ApJ, 570, in press (astro-ph/0201416)
- Behar et al. (2001) Behar, E., Sako, M., & Kahn, S. M. 2001, ApJ, 563, 497
- Bevington (1992) Bevington, P. R., & Robinson, D. K. 1992, Data Reduction and Error Analysis for the Physical Sciences (Second ed.; New York: McGraw Hill)
- Brandt, Fabian, & Pounds (1996) Brandt, W. N., Fabian, A. C., & Pounds, K. A. 1996, MNRAS, 278, 326
- Collinge et al. (2001) Collinge, M. J., et al. 2001, ApJ, 557, 2
- de Vaucouleurs et al. (1991) de Vaucouleurs, G., de Vaucouleurs, A., Corwin, H. G., Buta, R. J., Paturel, G., & Fouque, P. 1991, Third Reference Catalogue of Bright Galaxies (Springer-Verlag: New York)
- Evans (1988) Evans, I. N. 1988, ApJS, 67, 373
- Fabian, Rees, Stella, & White (1989) Fabian, A. C., Rees, M. J., Stella, L., & White, N. E. 1989, MNRAS, 238, 729
- Gehrels (1986) Gehrels, N. 1986, ApJ, 303, 336
- George et al. (1998) George, I. M., Turner, T. J., Mushotzky, R., Nandra, K., & Netzer, H. 1998, ApJ, 503, 174
- Iwasawa, Fabian, & Matt (1997) Iwasawa, K., Fabian, A. C., & Matt, G. 1997, MNRAS, 289, 443
- Kaspi et al. (2000) Kaspi, S., Brandt, W. N., Netzer, H., Sambruna, R., Chartas, G., Garmire, G. P., & Nousek, J. A. 2000a, ApJ, 535, L17
- Kaspi et al. (2000) Kaspi, S., Smith, P. S., Netzer, H., Maoz, D., Jannuzi, B. T., & Giveon, U. 2000b, ApJ, 533, 631
- Kaspi et al. (2001) Kaspi, S. et al. 2001, ApJ, 554, 216
- Kraemer and Crenshaw (2001) Kraemer, S. B., Crenshaw, D. M., & Gabel, J. R. 2001, ApJ, 557, 30
- Komossa & Bade (1998) Komossa, S., & Bade, N. 1998, A&A, 331, L49
- Krolik & Kriss (2001) Krolik, J. H., & Kriss, G. A. 2001, ApJ, 561, 684
- Lee et al. (2001) Lee, J. C., Ogle, P. M., Canizares, C. R., Marshall, H. L., Schulz, N. S., Morales, R., Fabian, A. C., & Iwasawa, K. 2001, ApJ, 554, L13
- Lu et al. (1998) Lu, L., Sargent, W. L. W., Savage, B. D., Wakker, B. P., Sembach, K. R., & Oosterloo, T. A. 1998, AJ, 115, 162
- Mathur, Elvis & Wilkes (1995) Mathur, S., Elvis, M., & Wilkes, B. 1995, ApJ, 452, 230
- Matt, Fabian, & Reynolds (1997) Matt, G., Fabian, A. C., & Reynolds, C. S. 1997, MNRAS, 289, 175
- Nandra et al. (1997) Nandra, K., George, I. M., Mushotzky, R. F., Turner, T. J., & Yaqoob, T. 1997, ApJ, 477, 602
- Onken & B. M. Peterson (2002) Onken, C. A., & Peterson, B. M. 2002, ApJ, in press (astro-ph/0202382)
- Pelat, Alloin, & Fosbury (1981) Pelat, D., Alloin, D., & Fosbury, R. A. E. 1981, MNRAS, 195, 787
- Porquet & Dubau (2000) Porquet, D., & Dubau, J. 2000, A&AS, 143, 495
- Pradhan (2000) Pradhan, A. K. 2000, ApJ, 545, L165
- Press et al. (1992) Press W. H., Teukolsky, S. A., Vetterling, W. T., & Flannery, B. P. 1992, Numerical Recipes (Second ed.; Cambridge: Cambridge Univ. Press)
- Rybicki & Lightman (1979) Rybicki G. B., & Lightman A. P. 1979, Radiative Processes in Astrophysics (New York: John Wiley & Sons) p. 284
- Reynolds (1997) Reynolds, C. S. 1997, MNRAS, 286, 513
- Reichert et al. (1994) Reichert, G. A. et al. 1994, ApJ, 425, 582
- Sako et al. (2001) Sako, M. et al. 2001, A&A, 365, L168
- Shields & Hamann (1997) Shields, J. C., & Hamann, F. 1997, ApJ, 481, 752
- Spitzer (1978) Spitzer, L. 1978, Physical Processes in the Interstellar Medium (New York: Wiley) pp. 46–57
- Turner et al. (1993) Turner, T. J., Nandra, K., George, I. M., Fabian, A. C., & Pounds, K. A. 1993, ApJ, 419, 127
- Ulvestad & Wilson (1984) Ulvestad, J. S., & Wilson, A. S. 1984, ApJ, 285, 439
- Wandel, Peterson, & Malkan (1999) Wandel, A., Peterson, B. M., & Malkan, M. A. 1999, ApJ, 526, 579
- Weaver & Reynolds (1998) Weaver, K. A., & Reynolds, C. S. 1998, ApJ, 503, L39
- Winge, Pastoriza, Storchi-Bergmann, & Lipari (1992) Winge, C., Pastoriza, M. G., Storchi-Bergmann, T., & Lipari, S. 1992, ApJ, 393, 98
- Yaqoob et al. (2001) Yaqoob, T., George, I. M., Nandra, K., Turner, T. J., Serlemitsos, P. J., & Mushotzky, R. F. 2001, ApJ, 546, 759