Orphan GRB radio afterglows: Candidates and constraints on beaming
Abstract
The number of orphan radio afterglows associated with -ray bursts (GRBs) that should be detected by a flux limited radio survey, is calculated. It is shown that for jetted GRBs this number is smaller for smaller jet opening angle , contrary to naive expectation. For a beaming factor , roughly the value inferred by Frail et al. (2001) from analysis of afterglow light curves, we predict that between several hundreds to several thousands orphan radio afterglows should be detectable (over all sky) above 1 mJy at GHz frequencies at any given time. This orphan population is dominated by sources lying at distances of a few hundred Mpc, and having an age of yr.
A search for point-like radio transients with flux densities greater than 6 mJy was conducted using the FIRST and NVSS surveys, yielding a list of 25 orphan candidates. We argue that most of the candidates are unlikely to be radio supernovae. However, the possibility that they are radio loud AGNs cannot be ruled out without further observations. Our analysis sets an upper limit for the all sky number of radio orphans, which corresponds to a lower limit on the beaming factor. Rejection of all candidates found in our search would imply . This, and the fact that some candidates may indeed be radio afterglows, strongly motivate further observations of these transients.
1 Introduction
Our understanding of gamma-ray bursts (GRBs) has been revolutionized by the discovery of x-ray afterglows by BeppoSAX (e.g. Costa et al. (1997)), and the following detections of optical transients (e.g. van Paradijs et al. (1997)). These efforts led eventually to a confirmation of the cosmological nature of GRBs, through both direct redshift measurements (e.g. Metzger et al. (1997)), and imaging of the host galaxies (e.g. Sahu et al. 1997). The enormous power released in the explosion implies extremely large compactness of the source and, therefore, most GRB models involve compact or collapsed objects (e.g. Goodman (1986); Paczyński (1986); Eichler et al. (1989); Woosley (1993); Levinson & Eichler (1993); Paczyński (1998); see Mészáros 1999 for a review). In spite of the impressive successes of expanding relativistic “fireball” models (e.g.Paczyński & Rhoads (1993); Katz (1994); Mészáros & Rees (1997); Vietri (1997); Waxman 1997a ; Sari, Piran & Narayan (1998); see Mészáros (2002) for review), the precise nature of GRB progenitors remains unknown.
The total energy emitted in the GRB explosion and the rate at which such explosions occur in the Universe are important keys to the understanding of the progenitors. The determination of these factors is complicated, however, by virtue of relativistic beaming. During the phase of -ray emission the fireball expands with a large Lorentz factor, , so that a distant observer receives radiation from a conical section of the fireball of opening angle around the line of sight. Thus, estimates of total energy and rate based on -ray observations are highly uncertain. The first evidence that the fireball may be jetted was provided by radio observations of GRB970508 (Waxman, Kulkarni & Frail (1998)). These observations imply a jet of relatively wide opening angle, which expands sideways and approaches sub-relativistic, spherical expansion yr following the GRB (Frail, Waxman & Kulkarni (2000)). The analysis of radio observations during the sub-relativistic phase allowed to determine the total GRB energy to be erg.
Jetted GRBs have been widely invoked to explain the optical light curves of the afterglow emission, most notably so for the source GRB990123 (Stanek et al. (1999); Harrison et al. (1999)). Frail et al. (2001) have analyzed a sample of GRB afterglows with known redshifts. They find that most bursts are jetted, with jet opening angle and average “beaming factor,” defined as , of . They also find that the total -ray energy release, when corrected for beaming as inferred from the afterglow light curves, is narrowly clustered around erg. This result, although somewhat model dependent, also suggests that the conversion efficiency of fireball kinetic energy to radiation is high, in agreement with the conclusion of Freedman & Waxman (2001), who derived total fireball energy using early X-ray afterglow data. The energy estimates of Frail et al. are in agreement with those derived by Freedman & Waxman, and also with the total energy derived for GRB970508 (Frail, Waxman & Kulkarni (2000)).
Using radio surveys to constrain GRB beaming, rate and energetics through the search for radio emission from GRBs that were not necessarily detected in -rays, has been proposed by Perna & Loeb (1998) , Woods & Loeb (1999) and by Paczyński (2001). Perna & Loeb have suggested to search for such ”orphan radio afterglow” emission from GRB jets pointing toward us, while Woods & Loeb have suggested to look for yr old, non-relativistic remnants. Paczyński suggested, based on the radio observations of GRB970508, to search for emission from yr old nearby GRB remnants, which have undergone the transition from a relativistic jet to spherical sub-relativistic expansion, during which emission is isotropic. Given the hints for an association of GRBs with supernovae (Galama et al. (1998); Bloom et al. (1999); Reichart (1999)), it was suggested by Paczyński to search for strong radio emitters among nearby supernovae.
In this paper we use the model, proposed in (Frail, Waxman & Kulkarni (2000); Livio & Waxman (2000)) for the long term radio afterglow emission of GRBs, to calculate the expected number of orphan afterglows in radio surveys. We find that the detectable orphan population is dominated by yr old GRB remnants which have just undergone the transition to sub-relativistic, spherical expansion. We determine the dependence of the expected number of sources on uncertain model parameters, derive a lower limit to the expected number of sources, and demonstrate that independent constraints on the beaming factor of early GRB emission can be imposed using radio surveys. We searched for point-like radio transients, by comparing the FIRST and NVSS wide field catalogues, taken a few years apart, looking for sources present in one catalogue and absent in the other. Our approach is different than that proposed by Paczyński, namely we look directly for radio transients without relying on an association with nearby supernovae, since the link between GRBs and luminous supernovae is not well established: The only clear case, 1998bw, had an atypical (very weak) GRB, while there are three low redshift, , GRBs111see http://www.aip.de/ jcg/grbgen.html with no prominent supernova reported.
In § 2 we provide a brief description of the afterglow model and its main results used in later sections. In § 3 we calculate the number of radio afterglows expected to be detected above a certain flux. In § 4 we present a search for point-like radio transients using the FIRST and NVSS catalogs, and discuss possible contamination by radio supernovae and AGN. The implications of our results are discussed in § 5.
2 An outline of the afterglow model
The basic model assumes an ultra-relativistic, jet like ejecta propagating into an ambient medium of density , slowing down and expanding sideways, ultimately becoming non-relativistic. As long as the jet Lorentz factor is larger than the inverse of the jet’s opening angle , it behaves as if it were a conical section of a spherical fireball. Once drops below , the jet expands sideways, and its behavior deviates from that exhibited in the conical phase (Rhoads (1997, 1999)). After a transition stage, in which the jet expands sideways, the flow approaches spherical symmetry and becomes sub-relativistic (Waxman, Kulkarni & Frail (1998); Frail, Waxman & Kulkarni (2000)). The transition from a jet to a spherical sub-relativistic evolution takes place over a time scale,
| (1) |
(Frail, Waxman & Kulkarni (2000); Livio & Waxman (2000)). Here, is the total energy carried by the jet, in units of erg, corrected for beaming, i.e. it is related to the isotropic equivalent energy by , where is the jet opening angle. The subscript SNT refers to the Sedov-von Neumann-Taylor self-similar solution that describes the sub-relativistic flow.
After the transition, the power is dominated by synchrotron emission from a sub-relativistic fireball (e.g. Frail, Waxman & Kulkarni 2000). Denoting by () the fraction of thermal energy behind the shock that is carried by electrons (magnetic field), and assuming that the electrons are accelerated to a power-law energy distribution, with , it can be shown (Livio & Waxman (2000)) that the flux at frequencies above the synchrotron peak frequency at ,
| (2) |
is given by (see also Appendix of Frail, Waxman & Kulkarni 2000)
| (3) |
Here, is the luminosity distance, cm, and is the observed frequency measured in GHz. Analysis of GRB970508 radio data implies (Frail, Waxman & Kulkarni (2000)) , .
3 Expected number of orphan afterglow sources in radio surveys
Consider a survey with a flux threshold denoted by , and denote by the time, in units of , at which the radio flux of a GRB at a given luminosity distance, , drops below detection limit. From eq. (3) we then obtain
| (4) |
where
| (5) |
We shall assume, in what follows, that the total energy output and beaming factor of GRBs are standard and, moreover, that the fraction of total energy release that goes into driving the external blast wave generating the afterglow emission, is the same for all GRBs. We make this assumption in order to simplify our analysis, and since the distribution of the above parameters is not well known. It is important to emphasize at this point that, as mentioned above, the analysis presented in Frail et al. (2001) indicates that the distribution of GRB true (i.e. corrected for beaming) gamma-ray energies is narrowly clustered around , with a corresponding average beaming factor of . These results also imply high, order unity, radiative efficiency, consistent with the result obtained by Freedman & Waxman (2001) using a different method, and implying that the true total fireball energy is a few times , i.e. narrowly peaked around . Thus, we expect corrections to our results, due to deviations of parameters from their standard values, to be small. Moreover, our results, given as explicit functions of the standard parameter values, can be easily generalized to the case where parameter values are drawn from a general distribution, by replacing these values with their corresponding averages.
Let be the time at which the radio source just becomes isotropic. Then for a given flux threshold, the maximum luminosity distance below which a substantial number of sources can be detected is obtained from eq. (4) for :
| (6) |
For a given choice of GRB parameters, a flux threshold at the observed frequency , and value of , the parameters and are fixed. Equation (6) can then be numerically solved for the assumed cosmology to yield the maximum redshift encompassed by the survey.
We denote by the observed number of GRB events per year per Gpc3 at (which, assuming that the GRB rate follows the redshift evolution of the star formation, is estimated to be (Schmidt (2001))), and by the redshift evolution factor. The expected number of radio afterglows between and can then be expressed as,
| (7) |
where is the light distance in units of , and
| (8) |
The total number expected, , can be obtained by integrating eq (7) from to , with determined from eq. (6).
As an example, consider a survey with a flux threshold of 5 mJy. Assuming , and the above choice for the remaining parameters, we find Gpc, and a corresponding redshit . At such small redshifts cosmological effects can be neglected to a reasonable approximation, and the luminosity distance can be taken to be equal to the proper distance. In this case eq. (7) can be integrated analytically. One then finds, using
| (11) | |||||
As seen, depends only weakly on . Consequently, any uncertainty in the time at which the radio emission becomes roughly isotropic should not affect our result considerably. We have also given the result in terms of the isotropic equivalent energy, , for which we have chosen a normalization of erg, since for the sample of GRBs with known redshifts given in Frail et al. 2001, one finds erg and erg. Since the true energy inferred from the observations, which is constrained by the isotropic equivalent energy measured in GRBs with known redshifts, is inversely proportional to the beaming factor, . This means that the number of orphans expected to be detected in a flux limited survey decreases with increasing beaming factor, unless the survey is sufficiently deep to detect all sources. This is, of course, due to the fact that larger beaming factor implies, for given isotropic equivalent energy, a lower true energy, and hence a lower radio flux at the transition to spherical expansion, as demonstrated by Eq. (3).
The number of orphan radio GRBs, Eq. (11), depends on the model parameters , , and . Afterglow observations strongly suggest that is close to equipartition, i.e. (Freedman & Waxman 2001), and that is narrowly peaked around (Frail et al. 2001). The main uncertainty is thus in the parameters and . The peak flux of a GRB afterglow, for an observer lying along the jet axis, is proportional to , and for typical luminosity distance of cm it is mJy (Waxman 1997b ; Gruzinov & Waxman (1999); Wijers & Galama (1998)). Observed afterglow fluxes generally imply for , and values are obtained in several cases (e.g. Waxman 1997b ; Wijers & Galama (1998); Panaitescu & Kumar (2001)). Our parameter choice in Eq. (11), and , is therefore conservative. Even for such a conservative choice of parameters we expect more than a dozen radio afterglows to be detected by an all sky survey like the NVSS, provided the beaming factor is not much larger than that anticipated from other considerations. Note, that our choice is also conservative: If the GRB rate does not evolve with redshift, rather than following the star formation rate, the rate is about 8 times larger, , and the expected number of radio GRB remnants is correspondingly larger by the same factor. Finally, the brightest source should have a flux of
| (12) |
Since the flux in this phase declines roughly as , such a source should remain above 1 mJy for at least several years. This motivates follow-up observations of the brightest transients found in a survey.
The derivation of eq. (11) does not take into account the contribution from sources having a lifetime shorter than . These sources are expected to be beamed, and so the fraction that can be observed (those directed along our sight line) should be of course correspondingly smaller. On the other hand, the radio flux emitted at times earlier than is larger and, consequently, these beamed sources can be seen out to a larger distance. We may estimate the number of beamed radio sources anticipated to be detected by the survey using the following argument. The ratio of the number of sources having an opening angle that are pointing in our direction, to the number of sources that had just become isotropic, is given by for a two sided jet, where is the observed expansion time to opening angle : (e.g. Rhoads (1999)). Noting that the radio flux measured by an observer within the beam drops as during the expansion of the jet (e.g. Rhoads (1999)), the flux of a beamed source is higher than that of a source that just became spherical (lying at the same distance) by a factor . This implies that beamed sources can be seen out to a distance larger by a factor compared to those that just became spherical. Thus, the ratio of the number of beamed sources to those that just became spherical, observed above a certain flux, is . Thus, the number of detectable sources is dominated by sources which have already expanded to spherical symmetry.
For deeper surveys cosmological effects cannot be ignored and must be taken into account. We have solved eqs. (6) and (7) numerically for different choices of cosmological parameters. For the range of parameters presently favorable we find that depends only weakly on the assumed cosmology. In the following we present the results obtained for , , and . We also made the popular assumption that the comoving GRB density distribution traces the star formation rate, and invoked a strong redshift evolution for the later, as suggested by Madau & Pozetti (2000). Specifically, we take in the following calculations.
The solution of eq. (6) is depicted in fig 1a, where the dependence of the maximum redshift on is plotted. Fig. 1b shows the dependence of on for different values of .
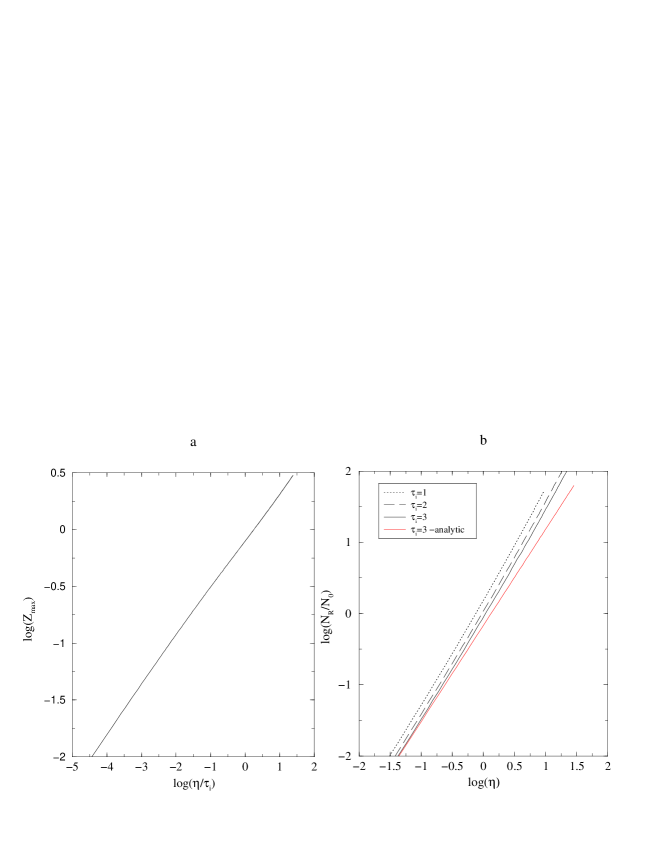
For the cosmology adopted above, the radio flux of a source at a redshift of is given by
| (13) |
and is smaller by a factor of 4 at . Thus for our above (conservative) choice of afterglow parameters a flux limit of is required to see all the orphans if the GRB population is dominated by those at .
4 A Search for NVSS/FIRST Radio Transients
4.1 Analysis
We conducted a search for point-like radio transients in the FIRST radio catalog (White et al. 1997). We searched for compact FIRST radio sources that do not appear in the NVSS radio catalog (Condon et al. 1998). The sample we obtain this way is incomplete, since it rejects afterglow sources that were detected by the NVSS, and were bright enough to remain above 6 mJy during the FIRST observation. We examine this incompleteness factor further below and show that it is smaller than 5 percent. As the FIRST and NVSS surveys were obtained in different VLA configurations, the comparison was done carefully. We use this comparison to put an upper limit on the number of GRB radio afterglows.
The FIRST is a 20cm radio survey conducted using the NRAO VLA in B-configuration, with beam-size. The final maps have a typical noise RMS of mJy. This value allows detection of mJy sources. The survey’s resolution enables an astrometric accuracy better than ( CL). The FIRST radio survey has begun in 1994, and when completed it will cover deg2, mostly in the north Galactic cap. In the search described below, we used the FIRST 2001, Oct 15 version, covering deg2. This catalog has sources, hence, a density of about sources per deg2.
The NVSS 20cm radio survey (Condon et al. 1998) was conducted between 1993 to 1996 and covers all the sky north of declination deg. It utilized the VLA D- and DnC-configurations, with a circular beam-size of . This is significantly larger than the median angular size () of faint extragalactic sources. With this beam-size, the faintest NVSS sources have an astrometric accuracy better than ( CL). The images have RMS brightness fluctuations of mJy beam-1, that allows for detection of mJy sources. The NVSS completeness level is about mJy. With density of sources per deg-2, it has total of radio sources.
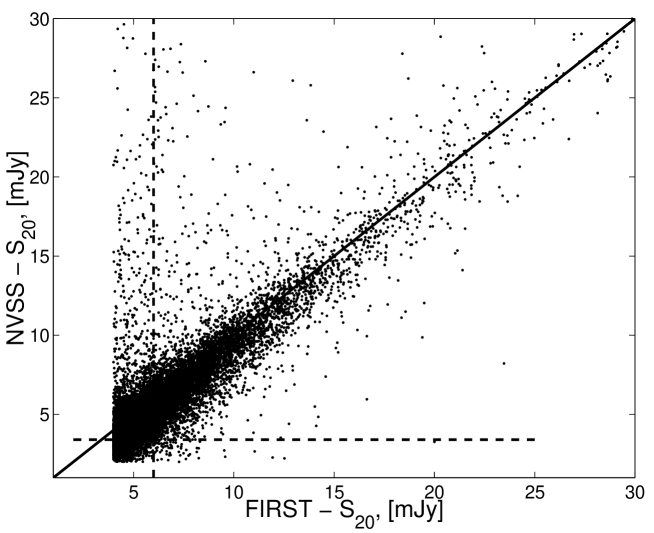
Radio sources could be intrinsically variable. Therefore, using the NVSS completeness of mJy as our threshold, could introduce a large number of variable sources (e.g., that were detected in the FIRST survey, but were just under detection in the NVSS) into our transients list. In order to compare the two catalogs, we need to choose a flux limit that rejects most of the variable objects. We plot in Figure 2 all FIRST point-like sources (above mJy) with NVSS counterparts. The solid line shows the location of sources for which the FIRST flux equals the NVSS flux, and the horizontal dashed line shows the NVSS, completeness flux level (i.e., mJy). Based on this plot we chose a threshold of mJy, for which the scatter around the solid line does not produce large number of false transients sources.
In the following we assumed that all the FIRST images, were taken after the corresponding NVSS images. This assumption will be examined more carefully later. Unless a GRB afterglow happens in a radio galaxy, it is expected to: (i) be a point source; and (ii) be absent from the NVSS. Since radio galaxies are a tiny fraction of the overall galaxy population, these assumptions hold for most of the afterglow population.
We selected all the FIRST point-like sources with peak flux above mJy (). From this subsample, we selected all the unresolved objects ( of the mJy subsample). However, some of the resolved FIRST objects could actually be point sources, classified as resolved due to measurements errors. Adopting the FIRST size error criterion (White et al. 1997), for of the FIRST sources above mJy it is not possible to reject the hypothesis that they are point-like at the CL. Therefore, the number of sources above mJy for which the point-source hypothesis could not be rejected at the level is () times larger than the number of point sources we used in our sample. We ended with a catalog of FIRST point-like sources with peak flux above mJy. For these sources, we searched the NVSS for counterpart within of the FIRST position. Although the NVSS astrometry is better than , the use of such a high threshold was necessary because in cases of two (or more) nearby point-like radio sources, the NVSS could detect only one elongated source, with its center offset by more than from one of the FIRST point source positions. The search yields point-like FIRST sources with peak flux above mJy for which there is no NVSS counterpart.
We examined the POSS-II images and the FIRST and NVSS radio maps of all these transient candidates. We found that: result from holes in the NVSS maps; are artifacts due to un-cleaned aliases in the radio maps; are multiple sources for which the NVSS found an elongated source centered more than from one of the FIRST radio positions; and for the rest (, sources) we could not reject the hypothesis that these are radio transients or variable radio sources of some kind (e.g., AGNs, SNe, GRBs, Pulsars). A large fraction of these ’sources’ are possibly: radio artifacts; NVSS non-detections due to locally high background (e.g., in the vicinity of bright radio source); or physical phenomena other than GRBs (e.g., AGNs, SNe). If we change the flux limit from to mJy, the number of candidates decreases from to .
The following table lists the candidates along with their basic properties.
| R.A. | Dec. | FIRST radio | Qualitya | Optical counterparts and comments |
|---|---|---|---|---|
| (J2000) | flux [mJy] | |||
| 12:56:32.34 | -05:47:39.7 | 9.8 | 2 | No optical source |
| 13:07:13.39 | -05:27:09.4 | 6.6 | 2 | No optical source |
| 12:26:07.68 | +02:02:52.4 | 12.9 | 1 | No optical source |
| 12:28:47.38 | +02:03:12.8 | 34.5 | 3 | No optical source |
| 12:29:02.49 | +02:31:03.1 | 9.6 | 2 | No optical source |
| 12:26:50.43 | +02:39:32.6 | 6.8 | 1 | Blue point source with mag |
| 10:08:02.94 | +07:33:18.2 | 6.5 | 3 | No optical source |
| 12:30:23.41 | +11:31:39.0 | 7.6 | 2 | Point source with mag |
| 12:25:32.62 | +12:25:00.5 | 7.2 | 2 | Nucleus of an galaxy |
| 12:29:00.02 | +12:48:18.8 | 6.2 | 2 | No optical source |
| 12:15:50.24 | +13:06:54.0 | 9.7 | 2 | Located in an NGC4216 galactic arm |
| 08:21:50.18 | +17:46:16.3 | 6.0 | 2 | No optical source |
| 11:43:55.34 | +22:10:20.4 | 6.2 | 2 | No optical source |
| 16:52:03.08 | +26:51:39.9 | 6.3 | 2 | Coincident with the PSR J1652+2651 |
| 13:31:14.55 | +30:25:57.8 | 10.6 | 3 | No optical source b |
| 13:31:18.21 | +30:26:01.1 | 10.8 | 3 | No optical source b |
| 13:31:01.86 | +30:33:00.8 | 13.1 | 3 | No optical source b |
| 13:31:14.42 | +30:55:39.2 | 8.7 | 2 | No optical source b |
| 13:31:17.11 | +31:01:53.2 | 7.4 | 2 | No optical source b |
| 13:24:20.39 | +31:41:37.2 | 9.2 | 1 | from an galaxy |
| 13:25:17.11 | +31:51:07.6 | 9.4 | 2 | No optical source |
| 17:20:59.90 | +38:52:26.6 | 8.2 | 2 | No optical source |
| 15:22:48.69 | +54:26:44.1 | 6.6 | 2 | Point source with |
| 10:48:48.92 | +55:15:08.7 | 6.1 | 2 | Blue point source with |
| 08:36:00.07 | +55:55:17.9 | 10.7 | 2 | No optical source |
Notes:
a radio images quality: 1 - probable radio transient, 2 - suspect detection,
3 - probably an artifact
b group of ’sources’ near bright radio source 3C286 - probably artifacts.
For each of these objects, we conducted a search for known counterparts within a radius of in the NED database and within in the HEASARC database. Our findings are listed in the table.
deg2 of the FIRST survey were taken before the completion of the NVSS survey. Therefore, we reject all the sources in this area (i.e., ). Omitting this strip (PSR J1652+2651 is in this strip), the area covered by our search is therefore deg2, and the number of sources is: and , for the mJy and mJy flux thresholds respectively. The upper Poisson CL on these numbers are: and respectively. We consider these numbers to be conservative upper-limits on the number of possible GRB afterglows.
Finally, we have to correct our upper limits for the various completeness factors involved: (i) Missing point sources due to FIRST measurements errors. As we showed above, a very conservative estimate for this number is ; (ii) Area completeness (e.g., the fraction of the sky covered by our survey) ; (iii) Given The crude NVSS resolution, the probability that a transient source will be detected up to (twice the NVSS FWHM), from a known un-related NVSS source, and therefore could be confused with it, is . Therefore, the source confusion completeness factor is: ; (iv) NVSS completeness - For about of the FIRST sources there are no corresponding NVSS images (holes in the catalog), hence we set . (v) Incompleteness due to our search criteria - afterglow sources detected by the NVSS that were bright enough to remain above 6 mJy during the FIRST observation are rejected by our search. The number of such sources depends on the average time separation between the NVSS and FIRST observations. Denoting by the time interval between two consecutive observations of a typical afterglow source, eq. (3) implies that the flux during the first observation was larger than during the second observation by a factor of , assuming the source was near maximum flux during the first detection (i.e., its age was roughly ). Consequently, the fraction of bright afterglow sources in the NVSS catalog that may be detected above 6 mJy by the FIRST at time after 1996, must be smaller than . The smallest time separation between the catalogs in the strips we consider is about months, and the largest is about years. Taking the FIRST detections to be uniformly distributed in time, integrating the fraction from to yields a total fraction of less than 5% that our search rejected. Thus, we set . Taking together all these factors, we can put a conservative CL upper limit of for the all-sky number of GRB afterglows with peak specific-flux above mJy (or for the mJy threshold).
4.2 Radio Supernovae
The characteristic behavior of radio supernovae (RSNe) (see Weiler et al. (2002) for a recent review) appears to be similar to the expected behavior of radio afterglows (RGRBs). In particular, the radio light curve of type II RSNe rises on a characteristic time scale of days (Weiler et al. (1998)), comparable to (see eq. [1]), and has an overall similar shape to that of RGRBs following the peak. This is not at all surprising since both are produced by the same mechanism, namely a blast wave, albeit under somewhat different conditions. This similarity would render any attempt to distinguish RGRBs from RSNe difficult and, therefore, motivates a careful examination of potential differences between these two classes of objects.
We identify two features that may allow one to distinguish RGRBs from RSNe. Firstly, the radio flux is anticipated to decline smoothly with a dependence during the sub-relativistic phase in RGRBs, while the radio light curves seen in RSNe are often much more complex. However, some RSNe do show a smooth decline, and those may be confused with RGRBs. Secondly, the absolute peak radio luminosity of RSNe may differ considerably from the radio luminosity of the brightest RGRBs. For a typical GRB the energy injected into the blast wave is erg, and with the above choice of parameters: , , and , the RGRB luminosity density at 5 GHz is at a time of yr after the explosion. This luminosity is times larger than the typical peak luminosity (of detected) RSNe, of order (Weiler et al. (1998)), and several times brighter than the brightest known RSNe, SN1988z, which had a peak flux density of . This suggests that in a flux limited survey RSNe and RGRBs should have a distinct redshift distribution, with RSNe having preferentially smaller redshifts.
We estimate below the number of RSNe expected to be detected in a search of the type described in this paper for RGRBs, and compare their expected redshift distribution to that calculated for RGRBs. In order to make an accurate prediction for RSNe, their (peak) luminosity function and the shape of the corresponding light curves must be known. Unfortunately, due to the small sample of RSNe presently available (12 type II and 4 type I), and the lack of a supernova model that is capable of predicting the distribution of RSN properties, the determination of the peak luminosity function is highly uncertain. We therefore provide below a crude estimate based on the Weiler et al. (1998) compilation of RSNe radio data. Based on Figure 3 of Weiler et al., we adopt a RSNe peak luminosity function with equal number of RSNe per logarithmic peak luminosity interval over the 5 GHz peak luminosity range to . In addition, we invoke a correlation between 5 GHz peak luminosity and peak time of the form, , as demonstrated in Weiler et al. (1998). These assumptions hold, based on the available data, for type II RSNe. The properties of Type I RSNe are less certain. However, since type II RSNe dominate the (detected) RSNe population, and since the type I RSNe peak luminosities are close to the typical type II peak luminosities, we expect our estimate below of the type II RSNe “background” rate to provide a (crude) estimate for the total RSNe background.
Assuming that the RSNe flux drops as for , the number of 5 GHz sources on the sky above a certain flux density at any given time can be readily computed:
| (14) |
Here, is the RSNe rate per unit volume, is the peak time corresponding to peak luminosity , and is the maximum distance at which a RSN can be observed,
| (15) |
Since the typical distances of detectable RSNe are Mpc, we have assumed Euclidean geometry for the calculation above. It is also straight forward to calculate the average distance of detected RSNe,
| (16) |
These distances should be compared with those obtained for RGRBs: for the conservative GRB parameters quoted above, the maximum and average distances of RGRBs detectable above 5 mJy at 5 GHz are Mpc and Mpc respectively.
Using the above equations, and taking , corresponding to the total rate of core-collapse SNe (Filippenko (2001)), we find . Comparing this result with the estimates for RGRBs given in §2, we find that the number of RGRBs detected in a survey of the type described here should be at least comparable, and most likely significantly larger, than the number of detected RSNe. The characteristic distances of detectable RGRBs should be times larger than those expected for RSNe.
The anticipated proximity of RSNe in the FIRST survey implies that the host galaxy should be easily detectable. In fact, even very faint galaxies should be detectable above the POSS-II limit out to a distance of 100 Mpc. This means that all the radio transients listed in table 1 for which no optical counterpart is detected are unlikely to be RSNe, as even dwarf hosts should be clearly evident.
4.3 Radio loud AGNs
Radio loud AGNs are known to exhibit large amplitude variations over a broad range of timescale and frequencies, with flare durations ranging from minutes to years. The characteristic durations of radio outbursts (with the exception of ID variability) are between weeks to years (Valtaoja et al. (1999); Venturi et al. (2001)), with amplitudes that occasionally exceed a factor of 10. Thus, it is conceivable that some of the transients in our selected sample are radio loud AGNs. Indeed, our initial list of 110 transients contains a number of such sources.
Most of the candidates in table 1 have no optical counterpart brighter than . What is the likeliness that some or most of them are in fact AGNs? One way to characterize the radio loudness is in terms of the radio-to-optical luminosity ratio, , which is commonly defined using radio and optical luminosities at some fiducial rest-frame wavelengths. Existing samples of AGNs exhibit a distribution in radio loudness that depends on selection criteria. The distribution of in the FBQS (White et al. (2000)) for example peaks at , with very few sources (0.3 %) having . The distribution of radio selected quasars has a median at (Wadadekar & Kembhavi, (1999)). It is not clear at present whether this is a result of a selection effect, and whether there exists a population of extremely radio loud AGNs. However, based on our current knowledge, we would naively expect that deep enough observations at optical wavelengths would be able to ultimately reveal the underline AGN. future X-ray detections of some of our candidates will also imply that these are likely AGNs. A precise determination of the minimum value of for the objects in table 1 requires a knowledge of their redshifts, which are not available. If is defined as in Wadadekar & Kembhavi (1999) then a rough estimate yields for those objects. In addition, they should have no extended structure above on scales larger than a few arcseconds.
Another potential difficulty for future surveys may arise due to the presence of faint, BL Lac type sources. If a population of radio BL Lacs exist for which the continuum flux associated with the nuclear activity drops below that of the host galaxy during quiescent periods, then a radio transient associated with such an object may be confused with a RSN or orphan afterglow if optical observations were made when the AGN was in a low state. An example is the source SDSS J124602.54 which has been proposed as a candidate optical orphan afterglow, and later confirmed to be a BL Lac (Gal-Yam et al. (2002)). In order to select out such sources in future surveys, monitoring in the radio and/or optical bands may be necessary.
5 Discussion
We have calculated the number of orphan radio afterglows expected to be detected in a flux limited survey. For the GRB parameters derived by Frail et al. (2001); total jet energy erg and average beaming factor , the number of sources expected to be present over all sky at any given time with flux exceeding is [see Eq. (11)]
| (17) |
Here is the GRB rate at redshift , is the number density of the ambient medium into which the blast wave expands, and is the energy density of the magnetic field behind the shock in units of the equipartition value. is normalized in Eq. (17) to the value obtained under the assumption that the GRB rate follows the redshift evolution of star formation rate (Schmidt (2001)). If the GRB rate does not evolve with redshift, is a factor of 8 larger than the value used in Eq. (17). Since afterglow observations generally imply , and values are obtained in several cases [see discussion in the paragraphs following Eq. (11)], our choice of and values are conservative. Even for such a conservative choice of parameters we expect radio afterglows to be detected by an all sky survey with mJy. These sources are detected out to a distance
| (18) |
We conducted a search for point-like radio transients with flux densities larger than 6 mJy using the FIRST and NVSS surveys, and discovered 25 radio afterglow candidates, listed in Table 1. The two main types of sources that may produce radio transients, which may be confused in our analysis with a radio afterglow, are radio supernovae (RSNe) and radio loud AGNs. While we have shown that our candidate sources are unlikely to be RSNe (see sec. §4.2), the possibility that most of them are radio loud AGNs cannot be ruled out (see sec. §4.3). Thus, our detected sources allow to set an upper limit to the number of orphan radio afterglows. Correcting for various completeness factors (see sec. §4.1), we obtained an upper limit of 447 all sky radio afterglows above 6 mJy, and 154 above 10 mJy.
We have shown that for a given isotropic equivalent burst energy, , the number of afterglows detected in a flux limited survey is smaller for larger beaming factor , i.e. for smaller jet opening angle [see Eq. (11)]. The upper limit we derived on the number of radio afterglow sources therefore implies a lower limit for the beaming factor,
| (19) |
Here we have used Eq. (11) with erg, based on GRBs with known redshifts (Frail et al. 2001). This result is consistent with the value inferred by Frail et al. (2001). Better determination of the distribution of and , based on afterglow observations of identified GRBs, will improve the constraint on beaming. Alternatively, if the beaming factor is determined independently using other methods, then eq. (19) can be used to constrain the afterglow parameters. For instance, invoking implies
| (20) |
In reality the afterglow parameters in a sample of radio GRBs should have a spread, and so the letter condition may be taken as a constraint on the mean.
Additional observational efforts aimed at identifying the candidates in table 1 are strongly motivated by two arguments. First, some of the candidates may turn out to be orphan afterglows. The fact that most candidates in table 1 have no optical counterparts brighter than the POSS-II limit, implies that if some of them are indeed GRB radio orphans then their host galaxies are not as bright as would have been expected under the assumption that GRBs are associated with star-forming regions, given the distances estimated in Eq. (18) for the conservative values of and . Nevertheless, the observed number of orphan candidates is consistent with larger values of these parameters, as shown in Eq. (20), for which the distances are larger and the absence of optical counterparts is not surprising. Second, further observations are also motivated by the fact that rejection of sources from our list in Table 1 as possible candidates would impose a more stringent constraint for the beaming factor. Rejection of all the sources in Table 1 would imply an all sky upper limit of 49 sources, and a corresponding beaming factor .
Future radio surveys may go deeper than the FIRST and would be of comparable or better quality. The Allen Telescope Array (formerly the ”1-hectar radio telescope”) will allow a full coverage of the northern sky every night with mJy sensitivity222see http://astron.berkeley.edu/ral/, and the square-kilometer-array may provide even better sensitivity333http://www.nfra.nl/skai/. A search for point-like radio transients similar to that outlined in §4.1, would probably yield a large number of candidates. The analysis presented in §3 predicts that the number of all sky radio GRBs above 1 mJy is likely to lie in the range between a few hundreds and a few thousands, depending on afterglow parameters [see Eq. (17)], provided the average beaming factor of GRBs is not significantly larger than currently estimated from other considerations. Since the detectable orphan population is dominated by yr old GRB remnants, which have just undergone the transition to sub-relativistic spherical expansion, these sources should be transient, exhibiting flux decline on time scale of months. Expansion at the speed of light over yr implies that the angular size of the nearby remnants, lying at a distance Mpc, is mas. The nearby remnants may therefore be resolved using the VLBA and, moreover, since they have just undergone the transition to spherical expansion, their structure may show significant anisotropy (see Paczyński 2001).
RSNe and radio loud AGNs would probably contribute a large number of transients, and may render the identification of radio afterglows difficult. As shown in §4.2, RSNe and RGRBs can, in principle, be distinguished statistically by their redshift distributions. At the mJy level, the average distance of the radio afterglows is expected to lie between 0.1 to 1 Gpc, depending on afterglow parameters [see Eq. (18)], so it should be possible to detect the host galaxies and obtain their redshifts. RSNe should typically lie at significantly shorter distances (see §4.2). Detection of such bimodality in redshift distribution will greatly assist in identifying radio GRBs. Furthermore, the relativistic expansion of the GRB remnants also implies, as explained above, that unlike RSNe they may be resolved with the VLBA, possibly revealing anisotropic structure. Efficient rejection of flaring blazars would require follow-up observations in the radio, optical and X-ray bands. In particular, the orphan radio afterglows should exhibit a decay of the radio flux.
Finally, it is conceivable that GRBs emit substantial amounts of energy in the form of gravitational waves and high-energy neutrinos (Waxman & Bahcall (1997); Rachen & Mészáros (1998); Waxman & Bahcall (1999, 2000); Mészáros, & Waxman (2001); see Waxman (2001) for review). Association of orphan radio afterglows with potential signals in gravitational wave and neutrino detectors may help increasing the signal-to-noise ratio. In a model proposed recently (Van Putten (2001); Van Putten & Levinson (2002)), the GRB results from extraction of the rotational energy of a Kerr black hole through its interaction with a magnetized torus. This model predicts that the major fraction of the rotational energy available will be emitted in the form of gravitational waves in the band 0.5 - 1.5 KHz, for a reasonable range of black hole masses. It further proposes that measuring the product of the total energy carried by the gravitational waves and the corresponding frequency, which reflects the compactness of the system, can provide an existence test for Kerr black holes. However, such a measurement requires a knowledge of the distance to the source. Since the gravitational wave emission is isotropic, the chance of associating a LIGO source with a GRB event is small if GRBs have a beaming factor as large as currently believed. Nevertheless, if this model is correct, then LIGO sources should be associated with the orphan radio afterglows that should appear several months after the burst of gravitational radiation. At the distance within which LIGO can detect the predicted signal ( 100 Mpc), the radio source is expected to be very bright (see eq. [12]) and can be monitored for at least several years. Even though the angular resolution of the gravitational wave telescopes is expected to be quite poor, the chance that such a bright transient would coincide with a LIGO source should still be very small, and so such an association would be statistically significant. Our analysis for instance yielded an upper limit of about transients per square degree above 10 mJy. The association of a radio afterglow with a LIGO source would also provide a means to identify the host galaxy, given the superior resolution of the radio telescopes, and hence a distance measurement for the LIGO source.
References
- (1) Band, D. et al., 1993, ApJ 413, 281
- Bloom et al. (1999) Bloom, J. S. et al. 1999, ApJ, 508, L21
- Condon et al. (1998) Condon, J. J., Cotton, W. D., Greisen, E. W., Yin, Q. F., Perley, R. A., Taylor, G. B., & Broderick, J. J. 1998, AJ, 115, 1693
- Costa et al. (1997) Costa, E. et al. 1997, Nature, 387, 783
- Eichler et al. (1989) Eichler, D., Livio, M., Piran, T., & Schramm, D. 1989, Nature, 340, 126
- Filippenko (2001) A. V. Filippenko 2001, astro-ph/0102485
- Frail, Waxman & Kulkarni (2000) Frail, D. A., Waxman, E., & Kulkarni, S. R. 2000, ApJ, 537, 191
- Frail et al. (2001) D. A. Frail et al. 2001, ApJ, 562, L55
- (9) Freedman, D.L., & Waxman, E. 2001, ApJ, 547, 922
- Galama et al. (1998) Galama, T. J. 1998, Nature, 395, 670
- Gal-Yam et al. (2002) Gal-Yam, A., Ofek, E., Filippenko, A., Chornock, R., & Li, W. 2002, PASP, in press, astro-ph/0202354
- Goodman (1986) Goodman, J., 1986, ApJ, 308, L47.
- Gruzinov & Waxman (1999) Gruzinov, A. & Waxman, E. 1999, ApJ, 511, 852
- Harrison et al. (1999) Harrison, F. A., et al. 1999, ApJ, 523, L121
- Katz (1994) Katz, J. I. 1994, ApJ, 432, L107
- Levinson & Eichler (1993) Levinson, A. & Eichler D. 1993, ApJ, 418, 386
- Livio & Waxman (2000) Livio M. & Waxman E. 2000, ApJ, 538, 187
- Madau & Pozetti (2000) Madau, P., & Pozetti, L. 2000, MNRAS, 312, L9
- (19) Mészáros, P., 1999, A&AS 138, 533
- Mészáros (2002) Mészáros, P. 2002, to appear in ARA&A 40 (astro-ph/011117)
- Mészáros & Rees (1997) Mészáros, P. & Rees, M. 1997, ApJ, 476, 232
- Mészáros, & Waxman (2001) P. Mészáros, & E. Waxman, Phys. Rev. Lett. 87, 171102 (2001).
- Metzger et al. (1997) Metzger, M. R. et al. 1997, Nature, 387, 879
- Paczyński (1986) Paczyński, B., Ap. J. 1986, 308, L43.
- Paczyński (1998) Paczyńsk, B. 1998, ApJ 494, L45.
- Paczyński (2001) Paczyńsk, B. 2001, Acta Astronomica, 51, 1
- Paczyński & Rhoads (1993) Paczyński, B. & Rhoads, J. 1993, ApJ, 418, L5
- Panaitescu & Kumar (2001) Panaitescu, A. & Kuamr, P. 2001, ApJ560, L49
- (29) Perna, R., & Loeb, A. 1998, ApJ, 503, L135
- Perna et al. (2000) Perna, R., Rymond, J., & Loeb, A. 2000, ApJ, 533, 658
- Rachen & Mészáros (1998) J. P. Rachen and P. Mészáros, Phys. Rev. D 58, 123005 (1998).
- (32) Rengelink et al., 1997, A&A Supplement Ser., 124, 259
- Reichart (1999) Reichart, D. E. 1999, ApJ, 521, L111
- Rhoads (1997) Rhoads, J. E. 1997, ApJ, 487, L1
- Rhoads (1999) Rhoads, J. E. 1999, ApJ, 525, 737
- Sahu et al. (1997) Sahu, K. C., et al. 1997, Nature, 387, 476
- Sari, Piran & Narayan (1998) Sari, R., Piran, T., & Narayan, R. 1998, ApJ, 497, 17
- Schmidt (2001) Schmidt, M. 2001, ApJ, 552, 36
- Stanek et al. (1999) Stanek, K. Z., Garnavich, P. M., Kaluzny, J., Pych, W., & Thompson, I. 1999, ApJ, 522, L39
- Valtaoja et al. (1999) Valtaoja, E., Lahteenmak A., Terasranta, H., & Lainela, M. 1999, ApJS, 120, 95
- van Paradijs et al. (1997) van Paradijs, J., et al. 1997, Nature, 386, 686
- Van Putten (2001) Van Putten, M. 2001, Phys. Rep., 345, 1
- Van Putten & Levinson (2002) Van Putten, M. & Levinson, A. 2002, Science, 295, 1874
- Venturi et al. (2001) Venturi, T., et al. 2001, A&A, 379, 755
- Vietri (1997) Vietri, M. 1997, ApJ, 478, L9
- Wadadekar & Kembhavi, (1999) Wadadekar, Y., & Kembhavi, A. 1999, AJ, 118, 1435
- (47) Waxman, E. 1997, ApJ, 485, L5
- (48) Waxman, E. 1997, ApJ, 489, L33
- Waxman (2001) Waxman, E. to appear in ICTP Lecture Notes Series: Astroparticle physics and Cosmology, Eds. G. Senjanovic and A. Smirnov (astro-ph/0103186).
- Waxman, Kulkarni & Frail (1998) Waxman, E., Kulkarni, S. R. & Frail, D. A. 1998, ApJ, 497, 288
- Waxman & Bahcall (1997) Waxman, E. & Bahcall, J.N. 1997, Phys. Rev. Lett. 78, 2292.
- Waxman & Bahcall (1999) Waxman, E. & Bahcall, J.N. 1999, Phys. Rev. D 59, 023002.
- Waxman & Bahcall (2000) Waxman, E. & Bahcall, J.N. 2000, ApJ 541, 707.
- Weiler et al. (1998) Weiler, K.N., et al. 1998, ApJ, 500, 51
- Weiler et al. (2002) Weiler, K.N., Panagia, N., Montes, M.J., & Sramek, R.A. 2002, to appear in ARA&A.
- White, Becker, Helfand, & Gregg (1997) White, R. L., Becker, R. H., Helfand, D. J., & Gregg, M. D. 1997, ApJ, 475, 479
- White et al. (2000) White, R.L., et al. 2000, ApJS, 126, 133
- Wijers & Galama (1998) Wijers, R. A. M. J. & Galama, T. J. 1999, ApJ, 523, 177
- Woods & Loeb (1999) Woods, E. & Loeb, A. 1999, astro-ph/9907110
- Woosley (1993) S. Woosley, S. 1993, Ap.J., 405, 273.