Structure in the Dusty Debris around Vega111Based on observations carried out with the IRAM Plateau de Bure Interferometer. IRAM is supported by INSU/CNRS (France), MPG (Germany) and IGN (Spain).
Abstract
We present images of the Vega system obtained with the IRAM Plateau de Bure interferometer at 1.3 millimeters wavelength with sub-mJy sensitivity and resolution (about 20 AU). These observations clearly detect the stellar photosphere and two dust emission peaks offset from the star by and to the northeast and southwest, respectively. These offset emission peaks are consistent with the barely resolved structure visible in previous submillimeter images, and they account for a large fraction of the dust emission. The presence of two dust concentrations at the observed locations is plausibly explained by the dynamical influence of an unseen planet of a few Jupiter masses in a highly eccentric orbit that traps dust in principal mean motion resonances.
1 Introduction
The Infrared Astronomical Satellite (IRAS) measured a far-infrared flux from the vicinity of the main sequence star Vega greatly in excess of the photospheric emission (Aumann et al. 1984). We now know that main sequence stars with excess infrared emission, the “Vega-excess” stars, are common, and that this phenomenon represents circumstellar dust particles heated by stellar radiation (see the reviews by Backman & Paresce 1993, Lagrange, Backman & Artymowicz 2000, and Zuckerman 2001). Because dust destruction by Poynting-Robertson (P-R) drag and sublimation happens on a timescale shorter than main-sequence lifetimes, the dust orbiting Vega-excess stars must be continually replenished by the collisions of larger orbiting bodies, possibly analogous to Kuiper Belt objects.
Imaging and photometry of Vega-excess stars suggest that these systems commonly contain clouds of dust and debris shaped like disks or rings (e.g. Smith & Terrile 1984, Jayawardhana et al. 1998, Koerner et al. 1998). Some images contain hints that massive planets may help to sculpt the clouds; many are evacuated interior to a radius of 10 to 80 AU. Recent observations at 850 m with the James Clerk Maxwell Telescope (JCMT) have provided the first detailed images of the dust emission around several of these stars, including Vega (Holland et al. 1998, Greaves et al. 1999, Dent et al. 2000). At resolution, the 850 m images of Vega, Eridani, Fomalhaut, and Pictoris reveal emission peaks offset from the stars. The origin of these peaks is not clear. Some authors have modeled them as concentrations of dust trapped by planets, assuming planets on roughly circular orbits (Liou & Zook 1999, Ozernoy et al. 2000)
Millimeter wavelength interferometry offers a way to obtain high-resolution information on the emission structures around nearby Vega-excess stars, including the central cavities and mysterious offset emission peaks. Vega, an A0V star just 7.76 pc away, is positioned favorably in the northern sky for existing millimeter wavelength interferometers, and it appears to be viewed nearly pole-on, which simplifies the interpretation of its images (Gulliver et al. 1994). Recently, Koerner, Sargent & Ostroff (2001) presented an image of Vega at 1.3 mm from the Owens Valley Radio Observatory (OVRO) that resolves several emission peaks confined to a circumstellar ring. In this Letter, we present new interferometric observations of Vega with better sensitivity that reveal intriguing asymmetries in the locations of the emission peaks. These asymmetries may be the dynamical signature of a planet of a few Jupiter masses in a highly eccentric orbit.
2 Observations
We observed Vega in the 1.3 mm and 3 mm bands simultaneously with the IRAM Plateau de Bure interferometer (PdBI). Table 1 summarizes the observational parameters. The total integration time on source was about 23 hours, in excellent weather with precipitable water vapor content less than 3 mm and r.m.s. phase errors less than at 1.3 mm. Flux densities were set with reference to the standard source MWC349, and the systematic uncertainties in the flux scale are estimated to be about 20%.
3 Results
3.1 1.3 mm continuum
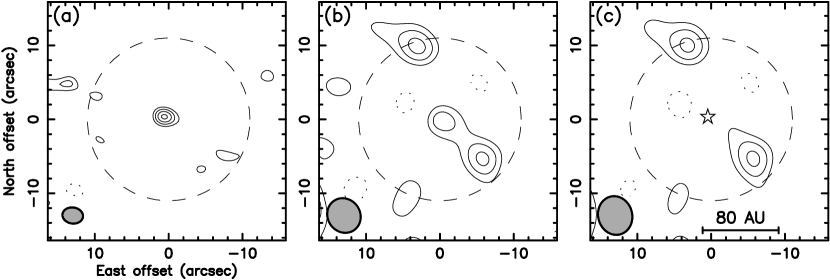
Figure 1 shows three 1.3 mm images of the Vega field that emphasize features in the visibility data of different spatial extent and surface brightness.
Figure 1a shows a high resolution view (), which is dominated by emission from the stellar photosphere at a position consistent with the image center (see Downes et al. 1999 for a discussion of astrometric errors). A least squares point source fit to the visibility data gives flux density mJy. Given the systematic uncertainties in the flux scale, the measured flux density is consistent with the 2.3 mJy expected from an extrapolation to longer wavelengths of the photospheric model of Cohen et al. (1992). The uncertainties also accommodate a small contribution from warm dust within 5 AU of the star, suggested by near-infrared interferometry (Ciardi et al. 2001). The detection of the unresolved star provides an excellent internal check on the calibration and data quality.
Figure 1b shows a lower resolution image obtained by applying a taper to the visibility data to increase the surface brightness sensitivity (). Two additional emission peaks become apparent, one offset to the southwest of the star (position angle ), and the other offset to the northeast of the star (position angle ). The uncertainties in the peak locations and position angles are and , respectively. The northeast-southwest orientation of the peaks corresponds closely to the orientation of the barely resolved structure in the JCMT image at 850 m (Holland et al. 1998), and the positions of the peaks are similar to the main significant features in the OVRO image at 1.3 mm (Koerner et al. 2001). The OVRO image shows two additional peaks along an arc northeast of the star that are not apparent in the PdBI data. The origin of this difference is not clear, but it may reflect the inherent difficulties in low signal-to-noise imaging of extended emission near the edge of the field of view. More data with better sensitivity are needed to verify the reality of these extra features.
Figure 1c shows an image made with a more extreme taper ( p.a. ), after subtracting from the visibility data the point source contribution of the central star. This image best isolates the two offset emission peaks. The fluxes obtained from fitting two elliptical Gaussians to the visibilities are mJy and mJy for the northeast peak and southwest peak, respectively. The quoted uncertainties include the formal errors in the fits and corrections for primary beam attenuation, but not the systematic errors in the flux scale. The summed flux in the peaks of mJy is consistent with that measured from the OVRO image, and it represents a sizeable fraction of the total dust emission in the system by extrapolation from the 850 m data. Assuming standard dust mass opacities (see Holland et al. 1998), the mass of emitting dust in each peak is less than 0.3 lunar masses.
3.2 3.3 mm continuum
No significant emission at 3.3 mm is detected from either the star or the offset peaks, with an r.m.s. noise level of 0.13 mJy in a beam. These upper limits are consistent with a blackbody spectrum for the star and a steeper spectrum for the dust peaks.
3.3 CO J=2–1 line
The channel maps shows no evidence for CO J=2–1 line emission. The limit is 0.05 K () in a 12 km s-1 velocity bin and beam. This limit rules out beam dilution as an explanation for previous nondetections of CO emission (Dent et al. 1995). As discussed by Kamp & Bertoldi (2000), the CO molecules in the Vega environment are likely destroyed by photodissociation, and the CO emission does not reliably trace molecular gas content.
4 Discussion
The new high resolution 1.3 mm imaging is consistent with the inference from previous observations that the Vega debris takes the form of a clumpy ring viewed nearly pole-on.
Several explanations for the emission peaks are viable. They could conceivably represent dust clouds released by recent collisions of planetesimals. The collisions would have to be recent since such clouds would disperse in 10–100 orbital periods, and the planetesimals must be massive enough that their collisions release a substantial fraction of a lunar mass in dust. It has been suggested that the emission peaks may represent planets which appear larger than they are because they have somehow retained circumplanetary disks (Holland et al. 1998). The presence of two emission peaks in the Vega system would call for two such planets (or one planet and one cloud). Alternatively, the peaks could be due to unrelated background galaxies, though this is very unlikely given recent source counts (Blain et al. 1999, Chapman et al. 2002).
A more likely scenario is that the two emission peaks represent dust clumps created by the dynamical influence of an unseen planet or planets. For example, in our Solar System, the Earth (and probably Neptune) temporarily traps interplanetary dust as it spirals inward via P-R drag in a series of first-order mean motion resonances (MMRs) to produce a ring of enhanced dust density along the Earth’s orbit (Dermott et al. 1994, Liou & Zook 1999). Astrometric limits exclude a companion to Vega more massive than 12 Jupiter masses with a period less than 7 years (Gatewood & de Jonge 1995), and imaging searches near Vega have failed to detect objects as bright as 12 Jupiter mass brown dwarfs (Holland et al. 1998). However, a less massive companion– still massive enough to thoroughly reorganize a debris cloud– may yet have escaped detection.
Most of the known extrasolar planets do not resemble Earth or Neptune; they are more massive than Saturn and often have significant orbital eccentricities (Marcy & Butler 2000). Models of Jupiter mass planets on eccentric orbits interacting with inward-spiraling dust particles suggest that such a planet often does not create a ring, but may create a pair of orbiting dust clumps (Kuchner & Holman 2001). The two dust enhancements are generally not co-linear with the star, and typically one is farther from the star than the other. We suggest that if the emission peaks in the PdBI images of Vega represent dust concentrations created by the dynamical influence of a planet, then their asymmetries point to a Jupiter mass planet with an eccentric orbit.
Low mass planets and planets with nearly circular orbits trap dust in resonances near the planet (Roques et al. 1994, Ozernoy et al. 2000). For a Jupiter mass planet with an eccentric orbit, more distant resonances may trap significant quantities of dust. The principal resonances, where the planet orbits roughly times for every one orbit of the particle, are the strongest of the distant MMRs. The 2:1, 3:1, 4:1, and 5:1 resonances are located at semimajor axes 1.59, 2.08, 2.52, 2.92 times the semimajor axis of the planet’s orbit, respectively.
Dust approaching a massive, eccentric planet is typically trapped in the exterior principal resonances with resonant arguments of the form:
| (1) |
where , and are the mean longitudes, and and are the longitudes of periastron of the particle and planet, respectively. Take the longitude of periastron of the planet as the reference angle (). In these resonances, oscillates about zero. These terms share a peculiar property. When a particle is at periastron (), . So, when the planet has mean longitude , trapped particles with longitudes of periastron at and must be near periastron. This resonance condition creates two dust concentrations which appear to revolve around the star at half the planet’s orbital frequency. The patterns from different resonances (e.g. 3:1 and 4:1) occur at the same longitude and reinforce each other. The concentrations are only wave-like patterns in the dust distribution; the actual particles orbit more slowly than the pattern. Secular and resonant effects on the particles’ eccentricities and longitudes of periastron create the asymmetries between the two concentrations of dust.
To illustrate how a cloud of particles in these principal resonances might appear, we created a model image by numerically integrating the orbits of 500 test particles under the influence of gravity from Vega and a single planet, radiation pressure, and P-R drag. We performed the integration with a symplectic -body map (Wisdom & Holman 1991) to which we added terms representing radiation pressure and P-R drag, a dissipative force (Cordeiro et al. 1996, Mikkola 1998, Kehoe 2000).
The effect of stellar radiation on dust particles is parameterized by , the ratio of the radiation pressure force to the gravitational force (Burns et al. 1979). For spherical particles with density 2 g cm-3 orbiting Vega (, ), , where is the particle radius in m. The IRAS spectral energy distribution of Vega suggests that particles smaller than m contribute little to the emission. For this model, we chose , which corresponds to a particle size of m.
The planet was given a mass of 3 Jupiter masses, an orbit with a semimajor axis of 40 AU, and an orbital eccentricity of 0.6. The test particles were placed near 108 AU from Vega with small free eccentricity () and small free longitude of periastron (). The particles were also given slight initial inclinations () and random longitudes of ascending node. The integrations ran for years, the estimated age of Vega, using a step size of 5 years. A typical millimeter sized particle was ejected by the planet in years after capture into resonance.
The role of collisions among dust particles, ignored in our models, is uncertain. The optical depth of brightest dust concentration is , which implies a collisional timescale of years. This is shorter than the P-R timescale of years for millimeter sized grains, so such grains could not migrate far from their source before a collision. However, this optical depth is not representative of the whole disk. Furthermore, for a steady-state size distribution that results from a collisional cascade, most of the mass is concentrated in the larger bodies while most of the area is concentrated in the smaller bodies (Dohnanyi 1969). Most collisions are not catastrophic. Grains that are broken up are fragmented by a particles with just enough mass to do so. Thus the collisional fragments have velocities nearly identical to the parent body (Wyatt et al. 1999). Therefore, the collisional timescale above is likely an underestimate. Nevertheless, if the collisional timescale is short, then this argues for source debris which is itself near or in a principal resonance. A resonant population of source bodies could be trapped by a migrating planet, as Neptune may have trapped the plutinos (Malhotra 1995). Here we consider only trapping via the migration of dust particles, in order to illustrate the basic geometry of the resonant structures.
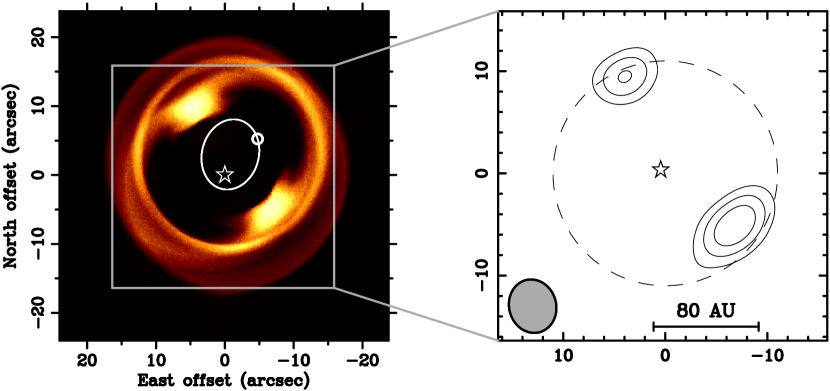
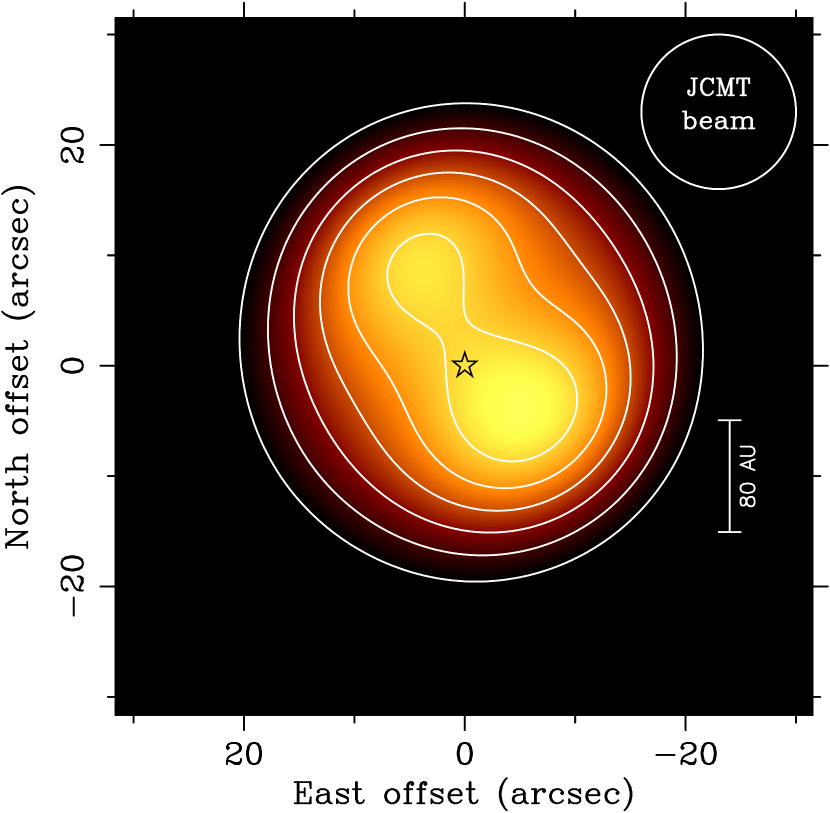
We simulated snapshots of the dust cloud by creating histograms of the particle positions calculated for particular orbital phases of the planet, and converted these histograms, which model the dust column density, into simulated 1.3 mm emission images by multiplying them by the Planck emissivity for blackbody particles at the appropriate distance from Vega. The left panel of Figure 2 shows the simulated 1.3 mm emission where the planet is at mean anomaly . At this time, the planet is located 36.9 AU () west and 40.6 AU () north of Vega. The right panel of Figure 2 shows the result of imaging the model brightness distribution using the visibility sampling of the PdBI observations of Vega. The spatial filtering property of the interferometer tends to suppress the smooth components of the model brightness and to emphasize the peaks. The simulated image qualitatively reproduces the observed asymmetries. Figure 3 shows the same model, scaled to 850 m using the observed spectral index, adding a 5 mJy point source to account for the star, convolved to match the resolution of the JCMT image of Holland et al. (1998). Like the JCMT image, this low resolution view of the model shows a central brightening extending in the northeast-southwest direction within a nearly circular boundary.
This numerical model is meant to be representative. A range of planet and dust parameters can capture the main features of the observations. In particular, the two dust concentrations would stand out more from the extended disk if the parent bodies that generate the dust were constrained to lie in the principal resonances. We defer a detailed description of the dynamics and an investigation of the planet parameters to future papers. If the planet mass is 3 Jupiter masses, then it may be as bright as 18th magnitude in H band (Burrows et al. 1997) and potentially accessible to direct imaging.
Planets found in radial velocity surveys at AU often follow eccentric orbits, but the asymmetric dust ring of Vega may be the first sign of a highly eccentric planet at AU. Thommes et al. (1999) have suggested that Neptune was scattered into a highly eccentric orbit early in the life of the Solar System, and subsequently, its eccentricity was damped by interactions with the primordial Kuiper Belt. Perhaps we are witnessing a similar phase in the evolution of the Vega system.
References
- (1)
- (2) Aumann, H.H., Gillett, F.C., Beichman, C.A., de Jong, T., Houck, J.R., Low, F.J., Neugebauer, G., Walker, R.G., Wesselius, P.R. 1984, ApJ, 278, L23
- (3)
- (4) Backman, D.E., Paresce, F. 1993 in Protostars and Planets III, ed. E.H. Levy & J.I. Lunine, p. 1253
- (5)
- (6) Blain, A.W., Ivison, R., Kneib, J.-P., Smail, I. 1999, ApJ, 512, L87
- (7)
- (8) Beauge, C., Ferraz-Mello, S. 1994, Icarus, 110, 239
- (9)
- (10) Burrows, A., Marley, M., Hubbard, W.B., Lunine, J.I., Guillot, T., Saumon, D., Freedman, R., Sudarsky, D., Sharp, C. 1997, ApJ, 491, 856
- (11)
- (12) Burns, J.A., Lamy, P.L., Soter, S. 1979, Icarus, 40, 1
- (13)
- (14) Chapman, S.C., Scott, D., Borys, C., Fahlman, G.G. 2002, MNRAS, 330, 92
- (15)
- (16) Ciardi, D.R., van Belle, G.T., Akeson, R.L., Thompson, R.R., Lada, E.A., Howell, S.B. 2001, ApJ, 559, 1147
- (17)
- (18) Cohen, M., Walker, R.G., Barlow, M.J., Decond, J.R., 1992, AJ, 104, 1650
- (19)
- (20) Cordeiro, R.R., Gomes, R.S., Martins, R.V., 1996, Celest. Mech. Dyn. Ast., 65, 407
- (21)
- (22) Dent, W.R.F., Greaves, J.S., Mannings, V., Coulson, I.M., Walther, D.M. 1995, MNRAS, 277, L25
- (23)
- (24) Dent, W.R.F., Walker, H.J., Holland, W.S., Greaves, J.S., 2000, MNRAS, 314, 702
- (25)
- (26) Dermott, S.F., Jayaraman, S., Xu, Y.L., Gustafson, B.A.S., Liou, J.C. 1994, Nature, 369, 719
- (27)
- (28) Dohnanyi, J.S. 1969, J. Geophys. Res. 74, 2531.
- (29)
- (30) Downes, D., Neri, R., Guilloteau, S., Casoli, F., Hughes, D., Lutz, D., Menten, K.M. et al. 1999, A&A, 347, 809
- (31)
- (32) Gatewood, G., de Jonge, J.K. 1995, ApJ, 450, 364
- (33)
- (34) Greaves, J.S., Holland, W.S., Moriarty-Schieven, G., Jenness, T., Dent, W.R.F. et al. 1999, ApJ, 506, L133
- (35)
- (36) Gulliver, A. F., Hill, G., Adelman, S. J., 1994 ApJ, 429, L81
- (37)
- (38) Holland, W.S., Greaves, J.S., Zuckerman, B., Webb, R.A., McCarthy, C. et al., 1998, Nature, 392, 788
- (39)
- (40) Jayawardhana, R., Hartmann, L., Fazio, G., Fisher, R.S., Telesco, C.M., Pina, R.K. 1998, ApJ, 520, 41
- (41)
- (42) Kamp, I., Bertoldi, F. 2000, A&A, 353, 276
- (43)
- (44) Kehoe T.J.J. 2000, The Observatory, 120, 163
- (45)
- (46) Koerner, D., Werner, M, Ressler, M., Backman, D. 1998, ApJ, 503, 83
- (47)
- (48) Koerner, D.W., Sargent, A.I., Ostroff, N.A. 2001, ApJ, 560, L181
- (49)
- (50) Kuchner, M.J., Holman, M.J. 2001, presented at the December 2001 Division of Planetary Sciences meeting
- (51)
- (52) Lagrange, A.-M., Backman, D.E., Artymowicz, P. 2000, in Protostars and Planets IV, eds. V. Mannings, A. Boss and S. Russell, p. 639
- (53)
- (54) Liou, J.-C. and Zook A. 1999, ApJ, 118, 580
- (55)
- (56) Marcy, G. W. & Butler, R. P. 2000, PASP, 112, 137
- (57)
- (58) Malhotra, R. 1995, AJ, 110, 420
- (59)
- (60) Mikkola, S. 1998, Celest. Mech. & Dyn. Astr., 68, 249
- (61)
- (62) Ozernoy, L.M., Gorkavyi, N.N., Mather, J.C., Taidakova, T.A. 2000, ApJ, 537, L147.
- (63)
- (64) Roques, F., Scholl, H., Sicardy, B., Smith, B. A, 1994, Icarus, 108, 37
- (65)
- (66) Smith, B. A., Terrile, R. J. 1984, Sci, 226, 1421
- (67)
- (68) Thommes, E. W., Duncan, M. J., & Levison, H. F. 1999, Nature, 402, 635
- (69)
- (70) Wisdom, J., Holman, M.J. 1991, AJ, 102, 1528
- (71)
- (72) Wyatt, M.C., Dermott, S.F., Telesco, C.M., Fisher, R.S., Grogan, K., Holmes, E.K., Piña, R.K. 1999, ApJ, 527, 918.
- (73)
- (74) Zuckerman, B. 2001, ARA&A, 39, 549
- (75)
| 3 mm | 1 mm | |
|---|---|---|
| Observations: | 2001 February 14,18, March 18,27 | |
| D configuration (5 antennas) | ||
| Min/Max baseline: | 15 to 80 meters | |
| Pointing center (J2000): | , | |
| Phase calibrators: | J1848+323, J1829+487 | |
| Bandpass calibrator: | 3C273 | 3C273 |
| Flux calibrator: | MWC349 | MWC349 |
| adopted flux: | 1.03 Jy | 1.70 Jy |
| Primary beam HPBW: | ||
| Synthesized beam HPBW: | P.A. | P.A. |
| r.m.s. (continuum image): | 0.13 mJy/beam | 0.30 mJy/beam |
| Spectral Line Correlator: | 256 channels, 80 MHz | |
| species/transition: | CO J | |
| frequency: | 230.5380 GHz | |
| center LSR velocity: | 0 km s-1 | |
| channel spacing: | 0.41 km s-1 | |
| r.m.s. (line images): | 13 mJy/beam | |