Spectral response of the EPIC-pn detector: basic dependences
Abstract
One of the three cameras behind the X-ray telescopes on board XMM-Newton is equipped with a pn CCD detector. Here the current status of the pn spectral response calibration is summarized. Several parameters describing the spectral response of the EPIC-pn detector show spatial dependencies. E.g. spectral resolution and single- to double-pixel event ratios are functions of the charge transfer losses and therefore depend on the distance to the read-out node of the CCD (the RAWY detector coordinate).
keywords:
Missions: XMM-Newton – Instruments: EPIC-pn – Instruments: calibration1 Introduction
On December 10, 1999 the XMM-Newton X-ray observatory ([\astronciteJansen et al.2001]) was launched into a 48 h Earth orbit by an ARIANE V rocket. One of the three European Photon Imaging Cameras (EPIC, [\astronciteTurner et al.2001]) is equipped with a CCD detector based on pn technology ([\astronciteStrüder et al.2001]). Ground measurements and modeling of the spectral detector response of the EPIC-pn camera are described in [*]fhaberl-WA2poster:po99 and first results on the in-orbit performance of the EPIC-pn camera are presented in [*]fhaberl-WA2poster:br00. The current status of the EPIC-pn calibration is reported by [*]fhaberl-WA2poster:br02 in these conference proceedings.
2 Spectral response of the pn-CCD detector
The spectral detector response matrix (DRM) describes the detection probability for an X-ray photon with given energy in each of the 4096 ADU channels of the pn detector. The response to X-rays is calculated using the Partial Event Model (PEM) which is based on the charge collection function ([\astroncitePopp et al.1999]).


2.1 Energy dependence
The PEM accounts for the effects of incomplete charge collection when photons are absorbed close to the detector surface. Different processes are responsible for the different spectral features that are visible in the measured spectrum. Figure 1 shows the spectral response to monochromatic X-rays for various photon energies. Absorption in the surface oxide causes detection of very few electrons that make it over the Si - SiO2 boundary, resulting in a flat shelf that extends down to the noise peak (e.g. clearly visible in the 1 keV spectrum). If the photon is absorbed in the Silicon, but close to the Si surface, only a part of the generated electrons will reach the read-out node and a shoulder in the spectrum is produced. If the absorption takes place deep in the detector, all generated electrons will be detected. Since the absorption depth generally increases with energy the surface effects play a minor role at high energies (see e.g. the spectra from energies above 7 keV) and the response resembles a Gaussian peak with a width defined by the total detector noise (Fano, charge transfer and electronic noise).
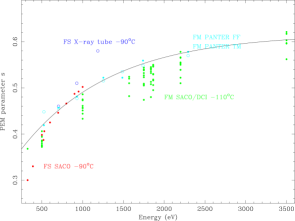
The ground calibration spectra were used to derive the parameters for the PEM. Figure 2 shows the energy dependence of the s and l parameters. The PEM parameter s describes the minimum fraction of electrons which are detected when the photon is absorbed in the Si and is a direct measure for the low energy “end” of the shoulder. The parameter l is a characteristic length scale for the depth of the transition region near the surface of the detector where the charge collection function changes from minimum s to full charge collection of 1 which is typically reached after 50-100 nm. The parameter l determines the height of the shoulder.
2.2 Energy resolution
The energy resolution of the detector is given by statistical processes in the charge production due to photo absorption, in the charge transfer during read-out and in the detector electronics. The charge transfer inefficiency (CTI), caused by traps in the Silicon which capture electrons, its modeling and correction is explained in detail in [*]fhaberl-WA2poster:de02 in these conference proceedings. Although the CTI losses can be corrected for, they introduce a noise component which influences the energy resolution. This noise increases with distance of the detector pixel in which the photon is recorded to the read-out node (the RAWY detector coordinate). Figure 3 illustrates the degrading energy resolution with increasing RAWY distance on spectra obtained in orbit.
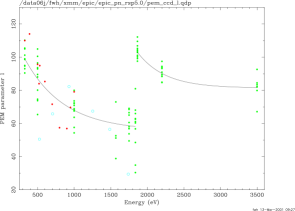
The energy resolution in terms of FWHM was derived directly from the current version of the response matrix by determining the width of the main spectral peak (for given photon energy) at half of the maximum intensity. Figure 4 shows the FWHM in eV as function of energy for five different line regions in the detector.

2.3 Single- and double-pixel events
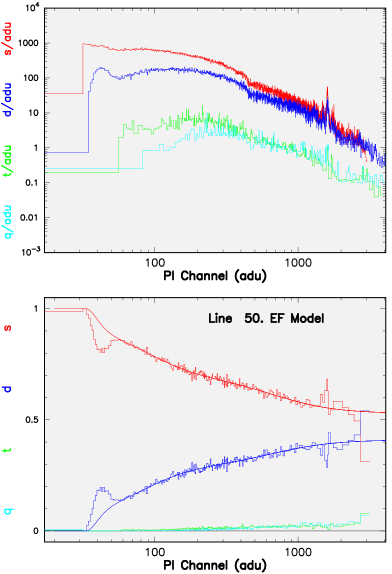
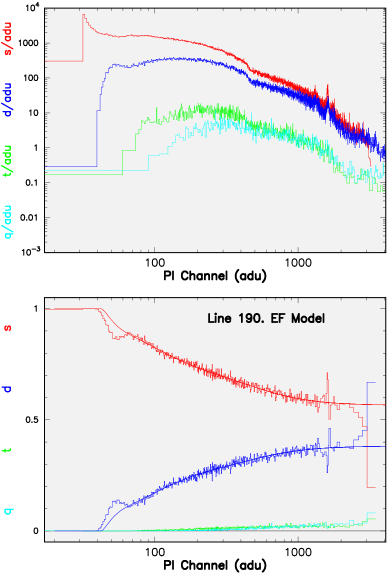
In the majority of cases an X-ray photon produces an electron cloud which is confined to a single detector pixel. However in cases where the photon is absorbed close to a pixel border the charge is split between two or more pixels (at most four in the case of the pn detector with its square pixel size of 150 m), producing double-, triple- and quadruple-pixel events. Because of the increasing size of the electron cloud at higher X-ray photon energies, the fraction of higher order events increases with energy. In the upper panels of Figure 5 two examples of pn spectra are shown. For each of the four valid event patterns a spectrum was binned. Double-event spectra start at higher PI channels (corrected for CTI losses) because to be recorded as “double” both events must exceed the electronic low-energy event threshold at the read-out node (which is currently set to 20 adu for the imaging modes and nominally 40 for timing mode). In a similar way this holds for “triples” and “quadruples”. In the lower panels of Figure 5 the relative fractions of the four valid event types normalized to their sum are plotted as function of energy. For the reason described above the single-fraction is 1.0 up to twice the threshold where doubles become detectable. However a small fraction of these singles are so-called pseudo singles, in reality doubles for which one of the two split partners fell below the event threshold. A further complication is the RAWY dependence of the event threshold. The fixed value defined in the electronics translates into effective thresholds which increase with distance to the read-out node due to CTI losses. An event which produces charge just above the threshold can fall below after the charge transport. This is demonstrated in Figure 5 for spectra taken closer to the read-out node (left) and near the detector center (right). Clearly seen is the start of the double spectrum at higher PI values in the latter case.
Comparison of single and double fractions derived from in-orbit data have shown that they are independent of source spectrum and source intensity as long as the spectrum is free of pile-up. This allows to derive standard curves for single- and double- fractions (triples and quadruples are neglected for spectral analysis due to their much reduced spectral resolution and small fractions) for each read-out mode. At higher intensities so called pattern pile-up increases the double fraction due to the production of false double-pixel events which actually consist of two neighboring single-pixel events. These false doubles cause deviations in the single and double fractions at PI channels typically twice the channels where the spectrum has its intensity maximum (there the probability for pile-up is highest). Examples are presented by [*]fhaberl-WA2poster:br02 and [*]fhaberl-WA2poster:ha02 in these proceedings.
A different kind of deviation from the standard curves at low PI channels can occur when the detector noise during an observation is at unusually high levels or when a spectrum is extracted from a region close to the read-out node where this noise is enhanced. A high level of low energy noise can result in an increased number of doubles, i.e. a noise peak in doubles is created at twice the energy of the noise seen in singles. This noise peak strongly increases the fraction of doubles just above twice the threshold (and correspondingly decreases the relative number of singles) as seen in Figure 5 by the deviations of the fractions at low energies from the expected curves. For a spectral analysis only energies above this double noise peak should be used and it is therefore recommended to produce pattern statistic plots from the events in the source extraction region.
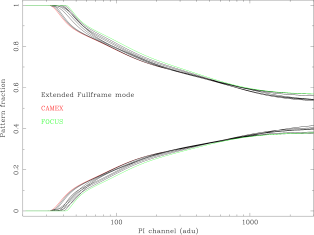
The dependence of the effective event threshold and therefore the single and double fractions on RAWY is demonstrated in more detail in Figure 6 by plotting the standard curves derived from areas with different distance to the read-out node (CAMEX).
Acknowledgements.
The XMM-Newton project is an ESA Science Mission with instruments and contributions directly funded by ESA Member States and the USA (NASA). The XMM-Newton project is supported by the Bundesministerium für Bildung und Forschung / Deutsches Zentrum für Luft- und Raumfahrt (BMBF / DLR), the Max-Planck-Gesellschaft and the Heidenhain-Stiftung.References
- [\astronciteBriel et al.2000] Briel U.G., Aschenbach B., Balasini M., et al. 2000, SPIE 4012, 154
- [\astronciteBriel et al.2002] Briel U.G., Dennerl K., Freyberg M., et al. 2002, ESA SP-488, these proceedings
- [\astronciteDennerl et al.2002] Dennerl K., Briel U.G., Freyberg M., Haberl F., Meidinger N., Zavlin V.E. 2002, ESA SP-488, these proceedings
- [\astronciteHaberl et al.2002] Haberl F., Bennie P.J., Briel U.G., et al. 2002, ESA SP-488, these proceedings
- [\astronciteJansen et al.2001] Jansen F., Lumb D., Altieri B., et al. 2001, A&A 365, L1
- [\astroncitePopp et al.1999] Popp M., Haberl F., Briel U.G., Soltau H., Strüder L., 1999, SPIE 3765, 693
- [\astronciteStrüder et al.2001] Strüder L., Briel U., Dennerl K., et al. 2001, A&A 365, L18
- [\astronciteTurner et al.2001] Turner M.J.L., Abbey A., Arnaud M., et al. 2001, A&A 365, L27