The extended atmosphere and evolution of the RV Tau star, R Scuti ††thanks: Based on observations with ISO, an ESA project with instruments funded by ESA Member States (especially the PI countries: France, Germany, the Netherlands and the United Kingdom) with the participation of ISAS and NASA. The SWS is a joint project of SRON and MPE.
We analyze ISO/SWS spectra of the RV Tau star R Scuti. The infrared spectra are dominated by HO emission bands. The near- and mid-infrared excess is attributed to HO; the dust contribution is less important. We also identify CO, SiO and CO bands. The various molecular emission bands originate from an extended atmosphere, an atmosphere above the photosphere. The extended atmosphere of R Sct is formed from matter which gradually have lifted up from the photosphere through the pulsations of the star. In contrast to the abundant molecules around the star, the silicate dust feature is weak and the dust mass-loss rate is only M yr. This implies that there might be a process to inhibit dust formation from molecules. RV Tau stars are commonly considered as post-AGB stars. While a detached dust envelope around R Sct is consistent with such an interpretation, we show that its period evolution is slower than expected. We argue that R Sct may be a thermal-pulsing AGB star, observed in a helium-burning phase.
Key Words.:
stars: AGB and post-AGB – stars: atmospheres – stars: circumstellar matter – infrared: stars – stars: variables:general – stars: individual: R Sct1 Introduction
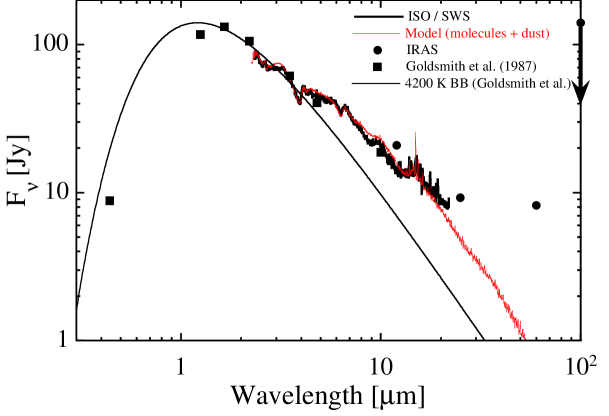
RV~Tau stars are pulsating variables characterized by alternating deep and shallow minima in their light curves. They are generally considered to be post-AGB stars with low initial masses (1 ; Jura Jura86). The abundance ratios show that they have experienced first dredge-up at the bottom of the red giant branch (Giridhar et al. Giridhar00). Based on their infrared dust excesses, RV Tau stars are classified into two groups: those with extensive warm dust and those without evidence of dust in the near-infrared region (Goldsmith et al. Goldsmith87). R~Sct is the brightest star in the visible in the latter group.
R Sct (HR 7066; HIP 92202) has a reported period of 147 days (Kholopov et al. Kholopov88). The effective temperature varies from 4750 to 5250 K (Shenton et al. Shenton94); the spectral type may vary as late as M3 at minimum phase (Kholopov et al. Kholopov88).
An atmosphere beyond the photosphere, which we call an extended atmosphere later on in this paper, has been found in R Sct from the analysis of sodium lines (Lèbre & Gillet Lebre91). High-resolution spectroscopic observations have uncovered CO, HO and OH molecules in the K-band (Mozurkewich et al. Mozurkewich87). The complicated variation of the velocity profile shows that the CO originates in the upper atmosphere, above the photosphere, which is affected by the pulsation. Since the spectral-type of R Sct is too early for the presence of HO, they conclude that the observed HO is circumstellar origin.
In this paper, we analyze spectra of R Sct taken with the Short-Wavelength Spectrometer (SWS; de Graauw et al. deGraauw96) on board the Infrared Space Observatory (ISO; Kessler et al. Kessler96). Because there is no interference from molecules in the terrestrial atmosphere, ISO spectra are ideal for the study of molecules in stars. We find that the IR spectra of R Sct is dominated by molecular emission features, especially from HO. In addition, SiO and CO bands are identified. We discuss the distribution of these molecules and the mass-loss history. The 200-year light curve is used to address the evolution of R Sct.
2 Observational data and analysis
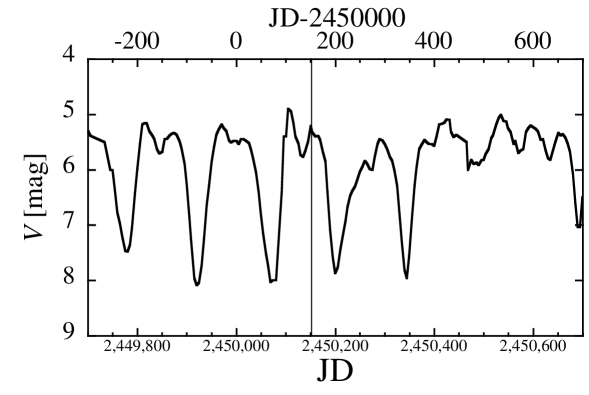
We obtained the SWS data for R Sct from the ISO Data Archive. R Sct was observed on 10 March, 1996 by programme of MOLBANDS (P.I. A. Heske). The phase is estimated as =0.60 from the AAVSO light curve (Fig. 1; Mattei Mattei95, private communication), where corresponds to the nearest previous deep minimum. The spectra were obtained using the full-grating scan mode (AOT 01, scan speed 1). The wavelength range covers 2.35–45.2 m, but the signal-to-noise ratio is poor above 20 m and these data are not used. The spectral resolution is –500, depending on the wavelength. The data were reduced using the SWS Interactive Analysis package. The calibration parameters of October 1999 were used for the wavelength, detector responsivity, and absolute flux calibrations. The spectra were re-gridded to a constant wavelength resolution of .
To identify the molecular features, we calculate molecular spectra using a circular slab model, which was used previously for analysing spectra of Mira variables (e.g., Yamamura et al. Yamamura99). We adopt a multiple layer model. This is an approximation for a shell that shows a temperature and density gradient; the model layers do not necessarily represent discrete shells. Line lists for HO, CO, SiO and CO were taken from Partridge & Schwenke (Partridge97), HITRAN (Rothman et al. Rothman01), Langhoff & Bauschlicher (Langhoff93), and HITEMP (Rothman et al. Rothman01b), respectively. The solar isotopic abundance ratio is adopted for HO and SiO. Bujarrabal et al. (Bujarrabal90) derive C/C 10 and we assume 10 % of carbon atoms are C. For the energy level populations of the molecules, local thermodynamic equilibrium (LTE) is assumed. A line width of 5 km s is assumed for all the molecules. We use a black body as the background source illuminating the molecular layers. We assume that the background is a black-body with a temperature of 5000 K. The near- and mid-infrared spectrum, which is in the Rayleigh Jeans region of the black body, is insensitive to the black-body temperature. The synthesized spectrum is not significantly affected by the black-body temperature with in the range 5000–7000 K.
3 Results
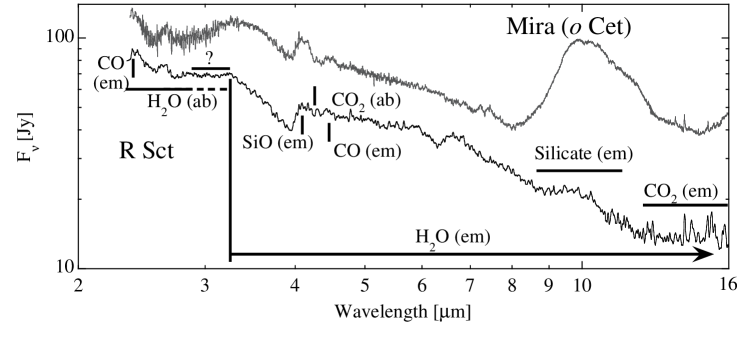
The ISO/SWS spectra of R Sct are shown in Fig. 2. Below 4.5 m, the spectra are similar to those of a typical AGB star, Mira ($o$~Cet; spectral type of M5e–M9e), which is dominated by water-vapour emission (Yamamura et al. Yamamura99). Water-vapour bands are mostly seen in emission in the near- and mid-IR spectra of R Sct, except at 2.7 m where it is in absorption. CO is seen in emission at 13–16 m and in absorption at 4.2 m. CO at 2.3 m and at 4.6 m is seen in emission. SiO emission features are detected at 4.1 m. A weak silicate dust excess is present around 10 m.
| Appearance | ||||
|---|---|---|---|---|
| [K] | [cm] | [] | ||
| CO | 4000 | 1.6 | em | |
| HO-1 | 2200 | 2.8 | em | |
| SiO | = | = | em | |
| HO-2 | 1200 | 5.5 | ab (2.7 m) | |
| em (6.2 m) | ||||
| CO | 800 | 10.5 | ab (4.2 m) | |
| em (13 m) |
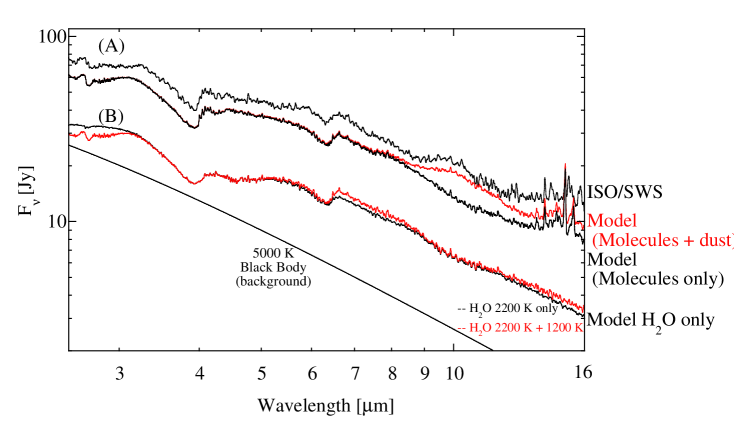
The ISO spectra of R Sct are compared with the synthesized spectra in Fig. 3(A) (see also Fig. 4). The spectra are well fitted with the parameters listed in Table 1. The global shape of the spectra are due to HO (Fig. 3(B)). To demonstrate that the water features are actually in emission, we also plot separately the background source (a 5000 K black body). The HO features can be fitted with two components (HO-1, HO-2): one component gives the emission while the other component contributes the absorption at 2.7 m (but also produces weak emission features above 6 m).
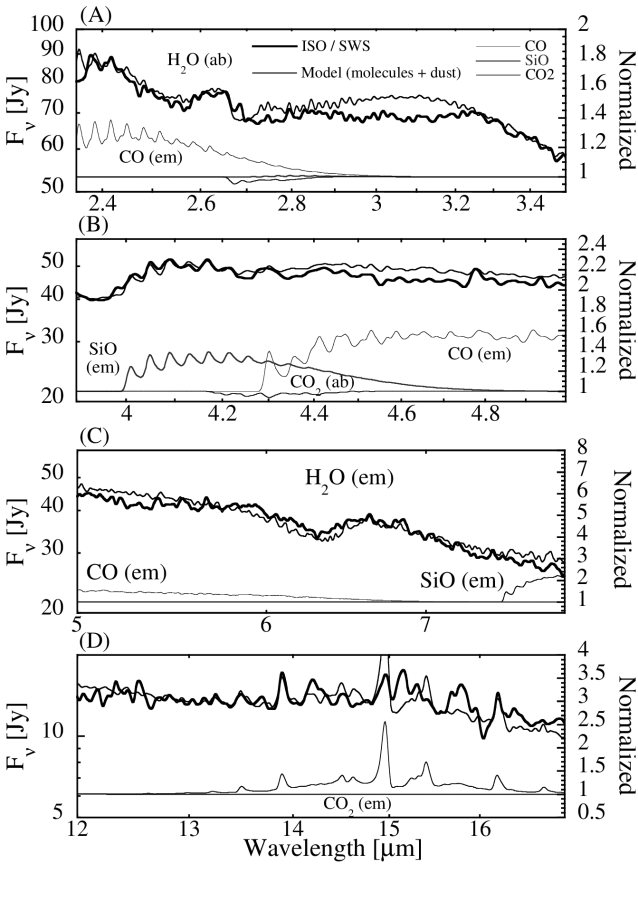
In Fig. 4, each molecular component of a synthesized spectra (CO, SiO and CO) are compared with the ISO spectra. By comparing the observed and synthesized spectra, the observed features can be identified with HO, SiO, CO, and CO bands either in absorption or in emission. SiO and CO are identified in R Sct for the first time. We assumed the same excitation temperature of SiO as HO-1 in the synthesized spectra. A weak absorption feature near 3.1 m cannot be explained by HO (Fig. 4.(A)) and is also not found in Cet. This feature can be attributed to either HCN or CH. HCN is tentatively detected in the millimeter wavelengths (Bujarrabal et al. Bujarrabal88) and it could be a candidate for the 3.1 m feature.
Radiation from the dust grains was included in the synthesized spectra. The dust shell was assumed to surround the molecular extended atmosphere; the dust has a density distribution as would be expected for a constant mass-loss rate. The temperature of the dust grains was calculated by solving the energy equilibrium, assuming the optically thin condition. For the calculation of the dust temperature distribution, the central star was assumed to be a black body of 5000 K. The star was then replaced by the molecular model spectra, and the radiation transfer was re-calculated. We used the dust opacity of ‘warm oxygen-deficient circumstellar dust’ (set 1) in Ossenkopf et al. (Ossenkopf92).
The parameters required to reproduce the 10 m silicate emission are a dust mass-loss rate of M yr, and an inner radius of 50 , assuming the outflow velocity is 10 km s (Bujarrabal et al. Bujarrabal88). The stellar radius () was taken as cm, and the luminosity as 4000 L. The outer radius of the dust shell in Fig. 3 is . However, the spectra can be well reproduced within the range of – , and we do not well constrain . Note that the radii of the molecular layers are measured relative to the stellar radius; the assumed value of = cm is only used for the dust model.
4 Discussion
4.1 Evidence for molecules in the extended atmosphere
Several molecules are detected in the ISO/SWS spectra of R Sct. The range of excitation temperatures (800–4000 K) is lower than that of the underlying star, confirming that these molecules are not photospheric. Several kinds of molecules, with different transition energies, are detected in emission. The implication is that these molecules extend beyond the background continuum source (the star).
In thermal equilibrium, theoretical model atmospheres predict that HO and CO are stable in atmospheres cooler than 2000–2500 K (i.e., late M) and that SiO is stable below 3000 K (Tsuji Tsuji64). The effective temperature of R Sct is 4750–5250 K (Shenton et al. Shenton94). Thus, these three molecules must be located in ‘an extended atmosphere’, a region cooler than the photosphere of R Sct, i.e. located above the photosphere.
For infrared CO emission, non-LTE effects have been proposed (summarized in Oudmaijer et al. Oudmaijer95). However, these non-LTE effects have difficulty explaining all the emission features, since several molecules with various transition energy are seen in emission at the same time. It is most likely that the extension of the atmosphere around the star is responsible for the emission bands.
R Sct occasionally shows TiO absorption in the visible spectra at minimum. TiO is present in the photospheres of cool stars, and is used for the spectral classification of M-type stars. Its presence has been used to assign R Sct a spectral class as late as M4 occasionally at minimum phase (e.g. Preston et al. Preston63; Cardelli Cardelli89). The phase of the ISO/SWS observation is 0.60 (i.e. intermediate between deep minima). It is unlikely that the spectral type was early M at the moment of the ISO/SWS observation, and there is no evidence that the star ever shows a spectral type of late M required for stable presence of water-vapour. This supports the conclusion that these molecules are not photospheric. It seems unlikely that stellar pulsation on its own can reduce the stellar temperature from K to the K required for the formation of TiO. Even this molecule may be located in the extended atmosphere.
The spectral type of R Sct, which is later than that of other RV Tau stars, may reflect in part its extended atmosphere. The spectral energy distribution is enhanced in the infrared region, due to the presence of the non-photospheric molecular emission bands in infrared. The resultant effective temperature would underestimate the actual temperature of the photosphere. Without the extended atmosphere, the effective temperature of R Sct could be more similar to that of other RV Tau stars.
4.2 The envelope structure of R Sct
Although the molecules are not photospheric, the excitation temperatures (800–4000 K) and radii (1–10 ) show that these molecules are still located near the star. This suggests that they formed recently.
In our SWS data, the absorption features of HO are seen superimposed on the HO emission features. The cooler layer causing the absorption features and the warmer layer causing the emission are therefore seen along the same line on sight, with the cooler component masking the spectra from the warmer layer. This is possible for a disk structure if it is seen approximately edge-on, but in general such a configuration is easier to explain if the atmosphere consists of an extended shell with a more spherical shape.
The extended atmosphere proposed here describes the region above but still close to the photosphere, located inside the dust formation radius, at a temperature of . The region outside the dust formation radius is referred to as the circumstellar envelope. Extended molecular atmospheres are seen in pulsating Mira variables, where they are caused by the pulsations (e.g., Scholz Scholz01). The extended atmosphere bridges the region between the photosphere and the dust forming region, and supplies gas from the photosphere to the dust forming region. The extended atmosphere and the circumstellar envelope can be distinguished by the temperatures and the velocity profiles of the molecules. The molecules in the extended atmosphere show complicated velocity profiles, often varying with a time scale of one period, and sometimes moving inward. The circumstellar envelope traces the dust-driven wind, where the velocity can be approximated with a near-constant expansion velocity.
There have been previous indications of this extended atmosphere in R Sct. Mozurkewich et al. (Mozurkewich87) found evidence for velocity variations with a period of 142 days in the molecular absorption lines. The variation is attributed to the pulsation shocks in the extended atmosphere. This variation is also found in sodium line (Lèbre & Gillet Lebre91). Hinkle et al. (Hinkle96) reported that CO showed complicated velocity profiles, while OH and HO, which have lower dissociation energies, showed single velocity profiles. All molecular lines showed time variability. They concluded that CO is located near the photosphere and is strongly affected by the stellar pulsation, while HO is present in a more extended atmosphere.
The pulsation shocks propagating into the inner region of the molecular atmosphere should not be so strong that the molecules are completely destroyed. However, the shocks can initially aid the formation of some molecules (Duari et al. Duari99). The molecules may subsequently accumulate in a region above the sodium layer.
We used multiple shells as an approximation to the structure of the atmosphere. In reality, a single shell with a temperature and density gradient is more likely, where the inner, warmer region contributes to the emission and the outer, cooler region causes the absorption on the emission bands. The temperature and the density will show discontinuities at the pulsation shocks, which could still lead to multiple discrete shells. However, the shocks do not reach 10 , and the outer shell is expected to be more continuous.
Recently, HO molecules have been found in K- and M-giants and supergiants whose effective temperatures are too high for the presence of water (Tsuji Tsuji97, Tsuji01; Jennings & Sada Jennings98). These HO molecules are located above atmospheres, as we have found for R Sct. The extra atmosphere with molecules is commonly seen in cool red (super-)giants.
Many RV Tau stars show an under-abundance of refractory elements in the photospheric spectra, similar to depletion patterns seen in the interstellar medium. To explain this effect, re-accretion of gas from a long-lived binary disk has been proposed where gas and dust have become separated (Waters et al. Waters92). Such a disk has been reported for the RV Tau star AC Her (Van Winckel et al. VanWinckel98; Jura et al. Jura00). These disks are located in the circumstellar envelope. R Sct shows a relatively small depletion (Giridhar et al. Giridhar00). Giridhar et al. argued that RV Tau stars with late spectral type, such as R Sct, have enlarged atmospheres: the accreted, depleted gas mixes with stellar, non-depleted gas in the extended atmosphere and reduces the depletion. For R Sct, there is strong evidence that the enlarged atmosphere exists from the ISO/SWS observations.
4.3 Variability
In Table 2, we summarize published infrared photometric data of R Sct. One set of observations, taken near visible minimum (=0.07, JD=24 433 051), shows fainter magnitudes at all infrared bands. Except for this event, the magnitudes are comparable at all phases. The magnitudes estimated from the ISO/SWS spectra are also consistent with other observations at other phases. At the -band, HO emission increases the flux by a factor of two compared to the brightness of the central star (Fig. 5). The constancy of the infrared magnitudes suggests that the molecules were continuously present around the star over the 30 years of observation, and did not form shortly before the time of the ISO/SWS observations.
The visual light curve of R Sct shows a number of episodes of deep minima over this time, one coinciding with the ISO observations and another with the IRAS observations (Fig. 6). Before this time, the activity was generally less. The extended molecular layers may be related to this increased activity, but no spectroscopic or infrared photometric data is available covering the earlier, less active period. With an expansion velocity of 5 km s, the hot water layer lags behind the pulsation of the star from the photosphere by less than a year. It is therefore of interest that R Sct has been relatively quiescent over the past 3 years: the effect of this on the water layer could be investigated.
4.4 Mass-loss history
R Sct shows an excess in the IRAS 60 m band (Fig. 5). There is also a weak 12 m excess in the IRAS band, but our results show that this is mostly due to the HO emission in the 10 m region, with only a minor contribution from dust (Fig. 3). The dust mass-loss rate which we estimate from the 10 m silicate emission is . This mass-loss rate cannot produce the observed 60 m excess, and an additional cold dust component is needed.
Alcolea & Bujarrabal (Alcolea91) adopt a two-component dust shell model based on the 0.4–100 m spectra. For the inner shell they derive a dust mass-loss rate of , which is comparable to our result from the 10 m excess. For the outer shell they derive . The CO-derived gas mass-loss rate from CO =1–0 and 2–1 lines is (Bujarrabal et al. Bujarrabal88). If a gas-to-dust ratio of 100 is assumed, the gas mass-loss rate derived from CO is comparable to the mass-loss rate of the outer shell estimated from the dust shell model. Also, the low excitation temperature of the millimeter CO rotation line suggests that the CO traces the past mass-loss rate. The implication is that the mass-loss rate of R Sct has reduced by about a factor of 100 (Alcolea & Bujarrabal Alcolea91). Using the inner radius of the outer (cold) dust shell of cm and the CO expansion velocity of 5 km s, Alcolea & Bujarrabal estimated the elapsed time after the large mass loss ceased as . This issue will be discussed in the next section.
The low current dust mass-loss rate raises a peculiar point. The SiO column density derived here is comparable to that of Mira variables (Yamamura et al. Yamamura99). R Sct should therefore have a sufficiently large amount of SiO for silicate dust formation. However, the current dust mass-loss rate is two orders of magnitudes lower than that of Mira variables (typically M yr– M yr). This suggest a process to inhibit the dust formation from the molecules. The hotter radiation field from the star, compared to Miras, may affect the dust formation sequence.
For AGB stars, the extended atmosphere is thought to be built up by pulsations, while radiation pressure on dust is the main mechanism driving the mass loss (e.g., Fleischer et al. Fleischer92; Höfner & Dorfi Hoefner97). It is therefore conceivable that both low metallicity and less dust grains operate at small mass-loss in R Sct, even if the intermediate reservoir of SiO has the same size as in Mira variables.
4.5 Evolutionary status
RV Tau stars are commonly assumed to be post-AGB stars with low initial mass. For the RV Tau stars with IRAS 60 m excess, the cessation of the mass loss occurred about five hundreds years ago (Jura Jura86). R Sct also shows evidence for a larger mass-loss rate in the past, and is also suggested to be in the post-AGB phase (Alcolea & Bujarrabal Alcolea91).
The mass loss ceased at the time the star would have left the AGB. The effective temperature () at AGB is in the range of 2000–3000 K, and the current effective temperature of R Sct is in the range 4000–6000 K. Using the time since the mass-loss reduction of 2000 yr, we obtain a rate of increase of the stellar temperature –. This rate can be compared to calculations by Blöcker (Bloecker95) of the temperature gradient as function of the post-AGB evolutionary time scale (in terms of yr K, Fig. 6 in his paper). The post-AGB time is calculated from the end of the high mass-loss rate. The rate we find for R Sct is reproduced for the early post-AGB evolution by the model tracks of stellar (core) mass range of 0.61, 0.57 and 0.55 M. These masses are at the lower end of post-AGB mass ranges, and may indicate a progenitor star with low initial mass.
Together with the evolution towards higher , the period of the star will also reduce as the stellar radius becomes smaller. R Sct is one of the oldest variable stars known, discovered in 1785 by Edward Pigott, observing from York. He observed the star regularly until 1803. Later it was observed extensively by Argelander from Bonn, between 1843 and 1862, and very good coverage is available from this time. This long-term light curve allows us to search for evidence of period evolution.
If all RV Tau stars are post-AGB, they are expected to evolve at constant luminosity towards higher effective temperatures. We use the period equation for AGB stars
| (1) |
from Wood (Wood90), where is the period in days, and are the stellar radius and mass in solar units. Taking , where is the luminosity, we can rewrite the equation as
| (2) |
This implies that the rate of period change is closely related to the temperature evolution:
| (3) |
The right-hand side corresponds to the calculated temperature increase of . Using the present period of 140 days, a change of days per century is expected. This should be easily detectable in the amateur archives and historical observations. Zsoldos (Zsoldos95) has noted the lack of observed secular period changes in other RV Tau stars and stressed that the low-mass post-AGB interpretation must be considered uncertain.
We have analyzed published observations of R Sct to search for evidence of period decrease. Individual visual observations were taken from the databases of the AFOEV111http://cdsweb.u-strasbg.fr/afoev/english.htx, the BAAVSS222http://www.britastro.org/vss and the VSOLJ333http://www.kusastro.kyoto-u.ac.jp/vsnet/VSOLJ/vsolj.html, which extend back over more than a century. The top panel of Fig. 6 shows the light curve after averaging into 5-day bins. The deep minima occur with a period of about 140 days, and they alternate with the much shallower secondary minima. We used wavelet analysis (Bedding et al. Bedding98) to measure period evolution in both the 140-day period and its 70-day harmonic. These are shown in the middle and bottom panels of Fig. 6, respectively. While R Sct shows substantial period jitter, there is no evidence for a secular trend in the mean period during the past century.


The evolution of the primary and harmonic periods is plotted in Fig. 7 as open symbols. We also show closed symbols which are derived from wavelet analysis of earlier published dates of minima. Those data are sparse, with some measurements around 1800 and then a large gap until 1860.
Period determinations during the 1800s were also made by the observers themselves. The values are somewhat scattered, but fall into two groups: around 60 days and around 70 days. A summary of these determinations can be found in Müller & Hartwig (Mueller18). As they discuss, Pigott found periods of 63 and 61.5 days, based on the pre-1800 observations. Westphal found 68.8 and 60.56 days, both determinations based on the same data! Argelander found 60 days in 1844, based on one year of observations, but later derived 71 days from a 15-year light curve. Schmidt, in 1879, was the first to derive the fundamental period and found 140 days.
All determinations before Schmidt clearly refer to the harmonic period. The reason is that the observers measured the times of maxima and minima and used these in their analysis: the primary and secondary minima were not distinguished in the published observations. Since the two corresponding frequency groups differ by about 1 cycle per year, it seems probably that one of these periods is an alias of the other. The current (harmonic) period is about 70 days (e.g., 70.6 days measured by Pollard et al. Pollard96). It therefore seems that the (harmonic) period has been about 70 days for as long as it has been measured. (Ascribing reality to the 60-day period would further worsen the discrepancy with eq. (3), since it would give a period evolution with the wrong sign.)
We re-reduced Argelanders observations (A1869) to check his period determination. The Fourier power spectrum shows a significant peak at 145.0 days, plus numerous weaker peaks in two ranges, centred at 140 and 70 days. Thus we confirm his period, but it is clear that the true dominant period was already evident in these data. This analysis also confirms the period stability of R Sct.
In conclusion, over the past two hundred years there is no evidence for a change of more than 2 days in the harmonic period, corresponding to 4 days in the main period. This limit is a factor of 5 below the predictions from Eq. (3).
Percy et al. (Percy91) analyzed 150 years of data for R Sct and reported that a sudden decrease of 1.0 d occurred in the harmonic period in 1941. However, their calculation of 0.07 day/year as the implied average rate of period change during the 150 years of observation is incorrect. The correct value is ten times smaller ( day/year). Thus, their conclusion that R Sct shows a period decrease in good agreement with evolutionary models is not valid.
The lack of evidence for period evolution implies that R Sct is presently not evolving towards higher temperature. This is in contrast to the post-AGB tracks and suggests alternative evolutionary phases should be explored, in agreement with the discussion by Zsoldos (Zsoldos95).
The past mass-loss rate of R Sct is of order M yr. This is rather low for the final mass-loss rate of the AGB, which is expected to be more than M yr (Bowen & Willson Bowen91). In addition, the abundance of -process elements for R Sct is low. One possible explanation is that R Sct may not yet have reached the tip of the AGB (Giridhar et al. Giridhar00).
It is therefore possible that R Sct is still an AGB star. A sudden decrease of the mass-loss rate on the AGB is expected following the thermal pulse: the lower luminosity during the quiescent helium burning gives both a higher temperature and a lower mass-loss rate (Zijlstra et al. Zijlstra92, Vassiliadis & Wood Vassiliadis93, BlöckerBloecker95). The period evolution slows down and reverses during the helium-burning phase. The phase lasts for . This phase may fit the period evolution, and time scale for the detached dust shell, quite well.
We therefore suggest the possibility that R Sct is not a post-AGB star, but is an AGB star in the helium-burning phase of the thermal-pulse cycle.

5 Conclusions
We find HO, SiO, CO, and CO in the ISO/SWS spectra of R Sct. HO emission dominates the near- and mid-infrared spectra. The molecules are probably located in a spherical extended atmosphere. Pulsations may gradually lift up the gas from the photosphere to the extended atmosphere. Molecular formation appears to take place in the extended atmosphere.
The column density estimated from the infrared SiO bands is comparable to that in Mira variables, however, the current dust mass-loss rate of R Sct is lower than Mira variables by two orders of magnitudes. The high effective temperature may prevent dust formation around this star.
While a high mass-loss rate in the past is indicated by an excess at 60 m, and by the CO millimeter wavelength emission, the current mass-loss rate is two orders of magnitude lower: the dust mass-loss rate M yr. The reduction in the mass-loss rate, and the time scale, can be explained if R Sct is a low-mass post-AGB star. However, the period evolution is too slow for post-AGB evolution. We therefore suggest that R Sct may be an AGB star in the helium-burning phase of the thermal-pulse cycle.
As future work, monitoring of the infrared photometric bands could help in understanding the structure of the extended atmosphere in this star, as well as in Mira variables. The infrared light curve of Mira variables shows a phase delay of maximum phase by about =0.1. For the infrared variability of Mira variables, dust might be important (e.g. Winters et al. Winters94), but molecules in the pulsating atmosphere contribute as well (Matsuura et al. Matsuura02). If the same infrared phase delay is found for R Sct the contribution of molecules on the infrared light-curve will be strengthened. In Table 2, the infrared photometry shows slightly fainter magnitudes at phase 0.07 (JD=244,3051.31). More frequent observations of the infrared light curve could find a phase delay.
Acknowledgements.
We acknowledge Dr. Mattei and the American Association of Variable Star Observers (AAVSO) for light curve of R Sct. Ten-micron data for R Sct, listed in the appendix, was taken with TIMMI-2 on ESO 3.6 m telescope. We gratefully thank the instrumental team and support astronomers for their assistance. The advice by Dr. Kester for IRAS was useful. This research was supported by PPARC grant. I.Y. acknowledges support by Grant-in-Aid for Encouragement of Young Scientists (No. 13740131) from Japan Society for the Promotion of Science.Appendix A Infrared photometry
Infrared photometric data taken from the literature are listed in Table 2. The data are taken from Gehrz (Gehrz72), Lloyd Evans (LloydEvans85), Goldsmith et al. (Goldsmith87), and Shenton et al. (Shenton94). The zero points for the IRAS bands are taken from Wainscoat et al. (Wainscoat92). The flux density of the ISO/SWS spectra is converted to magnitude, using filter transmission in van der Bliek et al. (vanderBliek96) and zero points in Evans (Evans93) the for L- and M-bands. For N- and Q-bands, effective centre wavelengths and widths in Evans (Evans93) are used. We measured an N-band magnitude with TIMMI-2 on 3.6 m Telescope of ESO on 4 August, 2001, using a narrow band filter at 10.4 m. HD 133774 was used as a calibration source adopting the template in Cohen (Cohen99). The zero point for the 10.4 m filter is calculated from the spectrum of Vega (Cohen et al. Cohen95).
| JD | Phase | IRAS 12 | IRAS 25 | Ref | |||||||||||||
|---|---|---|---|---|---|---|---|---|---|---|---|---|---|---|---|---|---|
| 2440000+ | |||||||||||||||||
| Uncertain | 2. | 8 | 1. | 8 | 1. | 4 | 0. | 9 | 1 | ||||||||
| 2682. | 31 | 0.64 | 2.88 | 2.33 | 2. | 04 | 1. | 53 | 2 | ||||||||
| 2999. | 36 | 0.72 | 2.78 | 2.28 | 2. | 02 | 1. | 51 | 2 | ||||||||
| 3051. | 31 | 0.07 | 3.38 | 3.04 | 2. | 80 | 2. | 33 | 2 | ||||||||
| 6243. | 61 | 0.61 | 2.84 | 2.26 | 2. | 00 | 1. | 49 | 3 | ||||||||
| 6248. | 53 | 0.64 | 1. | 50 | 0. | 85 | 3 | ||||||||||
| 6253. | 50 | 0.68 | 2.84 | 2.26 | 2. | 00 | 1. | 49 | 3 | ||||||||
| 6991. | 48 | 0.80 | 3.10 | 2.52 | 2. | 26 | 1. | 77 | 1. | 15 | 0. | 36 | 0. | 46 | 4 | ||
| 7000. | 49 | 0.86 | 3.10 | 2.49 | 2. | 22 | 1. | 65 | 4 | ||||||||
| 7040. | 25 | 0.15 | 3.11 | 2.57 | 2. | 36 | 1. | 91 | 1. | 67 | 0. | 93 | 0. | 01 | 4 | ||
| 8840. | 36 | 0.49 | 3.06 | 2.46 | 2. | 26 | 1. | 91 | 4 | ||||||||
| 8895. | 36 | 0.86 | 2.84 | 2.31 | 2. | 10 | 1. | 76 | 4 | ||||||||
| Uncertain | 0.74 | 0.03 | 5 | ||||||||||||||
| 10153. | 24 | 0.60 | 1. | 81 | 1. | 36 | 0. | 98 | 0. | 00 | 0.75 | 0.05 | 6 | ||||
| 12125. | 55 | 0.75 | 7 | ||||||||||||||
1: Gehrz (Gehrz72).
2: Lloyd Evans (LloydEvans85).
3: Goldsmith et al. (Goldsmith87).
4: Shenton et al. (Shenton94).
5: IRAS data. IRAS observed R Sct three times, and
no variability has been found (Var flag is 0 %).
6: Estimate from the ISO/SWS data. Filter transmission of van der Bliek et al.
(, ; vanderBliek96) and
IRAS Explanatory Supplement (iras-es) are adopted.
and band are estimated from effective centre wavelength and width in
Evans (Evans93).
7: ESO/TIMMI-2 observations. Not broad -broad band but narrow -band
filter
(10.4).
Observed between April 1970 and April 1971.
Using a narrow band filter centred at 10.8 m.
Zero magnitudes are taken from Evans (Evans93).
Zero magnitudes are taken from Wainscoat et al. (Wainscoat92).
Phases from JD=2442682.31 to JD=2446253.50 are estimated from
the light curve in Mattei (Mattei85; Mattei90).