The origin of [Fe II] emission in NGC 4151
Abstract
The centre of NGC 4151 has been observed in the J-band with the SMIRFS integral field unit (IFU) on the UK Infrared Telescope. A map of [Fe II] emission is derived, and compared with the distributions of the optical narrow line region and radio jet. We conclude that, because the [Fe II] emission is associated more closely with the visible narrow-line region than with the radio jet, it arises mainly through photoionization of gas by collimated X-rays from the Seyfert nucleus. The velocity field and strength with respect to Pa are found to be consistent with this argument. The performance of the IFU is considered briefly, and techniques for observation and data analysis are discussed.
keywords:
galaxies: active - galaxies: Seyfert - galaxies: jets - galaxies: nuclei - instrumentation: spectrographs - techniques: spectroscopic1 Introduction
Seyfert galaxies exhibit strong emission lines from forbidden electronic transitions—notably those of oxygen, nitrogen and sulphur at visible wavelengths [Seyfert 1943] and iron in the near-infrared [Rieke & Lebofsky 1981, Simpson et al. 1996]. These transitions can occur where ions are excited by collisions with electrons, yet can decay radiatively before subsequent collisions lead to de-excitation [Peterson 1997, Osterbrock 1989]. Hence the lines are associated with low-density regions of ionized hydrogen, where free electrons are abundant but the timescale for collisions is sufficiently long.
Some species, including neutral oxygen and Fe+, have similar ionization potentials to hydrogen, so do not survive where it is fully ionized. The most favourable conditions for [O I] and [Fe II] emission arise in partially ionized zones, the extent of which influences the observed intensity. Since H II regions around stars normally give way sharply to neutral gas beyond the Strömgren radius, their [O I] and [Fe II] lines are relatively weak. The central spectra of Seyferts, in contrast, indicate the presence of extensive partially-ionized hydrogen clouds as well as very highly-ionized species. These differences are explained somewhat naturally if the emission line clouds in Seyferts are photoionized by the ‘power-law’ continuum of the central active galactic nucleus (AGN), which is spectrally flatter than a black body [Osterbrock 1989, Mouri et al. 1990]. Numerical simulations [Ferland & Netzer 1983, Mouri et al. 2000] lend credence to this scenario.
The second mechanism which can generate enhanced zones of [O I] and [Fe II] emission is shock excitation of gas [Osterbrock 1989]. This appears to be the dominant cause in starburst galaxies, where shocks due to supernova remnants are important and supernovae have been associated directly with enhanced [Fe II] [Lester et al. 1990, Greenhouse et al. 1991, Forbes et al. 1993, Greenhouse et al. 1997]. Comparison of observed spectral line ratios with recent numerical models helps to distinguish between shocking and photoionization [Mouri et al. 2000], and indeed proves consistent with the former dominating in starbursts and the latter in Seyfert nuclei. Doppler broadening can also be used to check for kinematic disturbances.
Long-slit spectroscopy of Seyfert galaxies has revealed a spatially extended narrow line region (ENLR) in the visible (at radius greater than 4 arcsec in the case of NGC 4151) beyond the central narrow-line region (NLR). Unger et al. (1987) traced the bright [O III] lines at 4960Å and 5007Å, generated in fully-ionized regions, along with H (4861Å) in a sample of galaxies. The features were shown to have minimal line-of-sight velocity structure consistent with simple rotation, and line ratios characteristic of high excitation levels, pointing once again to photoionization. Subsequent studies [Penston et al. 1990, Robinson et al. 1994] have tended to support this conclusion. The elongated, sometimes visibly conical morphology of ENLR (and NLR resolved with the Hubble Space Telescope: HST) points to a link with collimated radiation from the nucleus [Unger et al. 1987, Mulchaey et al. 1996, Evans et al. 1993].
In the near-infrared, the origin of strong, extended [Fe II] emission in Seyfert galaxies has been somewhat controversial, with evidence for both shock excitation and photoionization occurring. It has been argued [Greenhouse et al. 1991] that shocks must be important because iron in our interstellar medium is mainly condensed onto grains which shocks can destroy via sputtering [Savage & Sembach 1996]. However, recent studies [Simpson et al. 1996, Mouri et al. 2000] indicate that the ratio [Fe II]/[O I] in both Seyferts and starbursts is consistent with the usual depletion levels of iron and oxygen from the gaseous phase, and that certain other signs of grain destruction are absent. Even if metal enhancement is not the dominant factor, it is likely that shocks due to outflows along the radio jets of AGN do make some contribution to emission from partially-ionized zones [Simpson et al. 1996, Morse et al. 1996]. In particular, Knop et al. 1996 find that whilst [Fe II] in NGC 4151 seems kinematically compatible with the ENLR, the 1.257 feature is broader than the nearby Pa line
NGC 4151 is both a natural candidate in which to study [Fe II] excitation and an important test case for understanding the structure of active galaxies. It is one of the brightest nearby Seyfert galaxies (, km s-1), yet eludes firm classification in the framework of unified AGN models [Antonucci 1993]. The highly extended narrow line emission and radio jet [Perez et al. 1989, Pedlar et al. 1993] are characteristic of a Seyfert 2 nucleus, whose collimation axis is almost perpendicular to the line of sight. However, the object also exhibits the strong broad lines and variability of a Seyfert 1 [Maoz et al. 1991], suggesting quite a different orientation. NGC 4151 has therefore been the subject of many past projects involving slit spectroscopy and narrow-band imaging.
An unusual feature which facilitates the present investigation is the pronounced misalignment between the ENLR at position angle 50∘ [Perez et al. 1989, Evans et al. 1993, Kaiser et al. 2000], and radio jet at [Pedlar et al. 1993, Mundell et al. 1995]. Whatever its origin, this provides an opportunity to associate [Fe II] directly with the optical ENLR and/or radio jet, by tracing the emission along both axes. If a clear separation can be made, it will be possible to determine the relative influence of ionization by collimated X-rays and shocking by outflowing radio plasma. Such a task is inherently suited to integral field spectroscopy, which can form a complete, homogeneous picture without prior assumptions, slit alignment problems or the waveband limitations of a filter.
The intrumentation is discussed in the next section, followed, in Section 3, by details of the observations. In Section 4, we present the method of data reduction and analysis which presents particular challenges since the technological limitations required the fibre outputs to overlap at the slit. However this does not degrade the data provided that the field is critically sampled at the IFU input [Allington-Smith & Content 1998]. Finally, the results are discussed in Section 5 and compared with other work.
2 Instrumentation for integral field spectroscopy
The SMIRFS-IFU is an experimental 72-fibre integral field unit [Haynes et al. 1999, Lee 1998] feeding the CGS4 spectrograph[Wright et al. 1993] at the UK Infrared Telescope (UKIRT). It provides integral field spectroscopy in the J and H bands via lensed fused-silica fibres. It was designed and built by the Astronomical Instrumentation Group at Durham University as a prototype for much larger integral field units: TEIFU on the William Herschel Telescope[Murray et al. 2000] and the GMOS-IFU on Gemini [Allington-Smith et al. 2000]. Futher details may be found in Haynes et al. (1999).
SMIRFS is designed to intercept the telescope beam without modification to existing instrumentation, but consequently requires removal of the CGS4 calibration unit. In place of this module, the SMIRFS slit projection unit feeds light from the fibre bundle into the long-slit, circumventing the usual beam path; the IFU input is connected to another port of the UKIRT instrument support structure. As a result of this arrangement, any reference observations must be taken using the main telescope aperture.
At the image plane, a hexagonal microlens array provides optimal coupling to the slow telescope beam and avoids dead space between fibres (see Haynes et al. for more information). The field of view is arcsec, with 0.62 arcsec spacing between adjacent fibre centres. A second set of microlenses at the output restore the correct focal ratio for CGS4. When using the long camera, each fibre projects a spot whose FWHM is 1.8 pixels at the detector, giving a comparable spectral resolution to the standard 2 pixel wide slit. These spots are spaced two pixels apart, placing the instrument on the borderline between the ‘maximally packed’ and ‘resolved peaks’ categories defined by Turner (2001), although throughput variations obscure the regular pattern in practice. Since there is only one field, sky subtraction is performed by nodding the telescope off source.
The capability of the SMIRFS-IFU was previously demonstrated in a June 1997 commissioning run. Its throughput relative to CGS4 alone was measured to be 50%; since then, minor adjustments have been made to improve performance.
3 Observations
3.1 Science programme
NGC 4151 was observed with the SMIRFS-IFU on 15–17 February 1998, as part of a sample of Seyfert galaxies. Details of the measurement parameters are presented in table 1. The selected region of the J-band includes both [Fe II] and Pa, at rest wavelengths of 1.2567m and 1.2818m respectively. Previous studies have sometimes used [Fe II] at 1.6435m and Br at 2.1655m; such measurements are equivalent to ours, because the same upper energy level of Fe+ is involved. Since, however, the longer-wavelength lines are much further apart, they cannot be observed together at high dispersion and their ratio is more sensitive to differential extinction along the line of sight. The J-band [Fe II] feature is also brighter, and the uncooled SMIRFS better suited to working in that regime.
| Instrument | CGS4 + SMIRFS-IFU |
|---|---|
| Camera | 300mm |
| Grating | 150 lines/mm |
| Diffraction order | 3 |
| Filter | B1 |
| Spectral range | 1.25–1.31m |
| Spectral FWHM | Å |
| Spectral sampling | 2.1Å |
| IFU field | ′′ |
| Spatial FWHM | ′′ |
| Spatial sampling | ′′ |
| Detector | InSb |
| Gain | 6 e-/data number |
| Read noise | 23 e- |
| Dark current | e/s |
| Single exposure | 180s 2 detector positions |
| Central exp. | 48 minutes on source |
The spatial resolution quoted in table 1 is for the final, combined data set; it was estimated by producing images of the unresolved [S IX] line and Pa broad line. These FWHM values correspond to the Nyquist scale, suggesting that the seeing disc was undersampled—the implications are discussed briefly in §4.
The long axis of the IFU was orientated at east of north, along the optical ENLR of the galaxy. The field of view, however, only covers the inner NLR at [Winge et al. 1999], which is orientated less favourably at 60∘ [Kaiser et al. 2000]. With arcsecond resolution, this gives 1′′ FWHM separation from the radio axis. Hence a mosaic was made of several telescope pointings around the nucleus.
Target centering was performed with the aid of a dedicated program, which derives a rough map of the illuminated input elements from the data. For the peripheral mosaic positions, it was necessary to rely on specified telescope offsets from the centre. Each position was observed in turn, following the repeated sequence object–sky–object; this maximizes the time on source without giving unequal object and sky exposures at individual pointings. The 180s integration time was just long enough for the background to dominate the read noise and dark current. The whole mosaic was repeated until the full exposure was reached.
In the absence of the calibration unit, sky emission lines were used as a wavelength reference. Some arc lamp observations were also taken through the telescope. The IFU was flat-fielded using the illuminated dome and the twilight sky, whilst a detector flat was made with the calibration unit, prior to the installation of SMIRFS. The bright F and A stars BS4572 and HD105601 were observed in order to calibrate the spectral response of the instrument and measure sky absorption features.
3.2 IFU set-up and characteristics
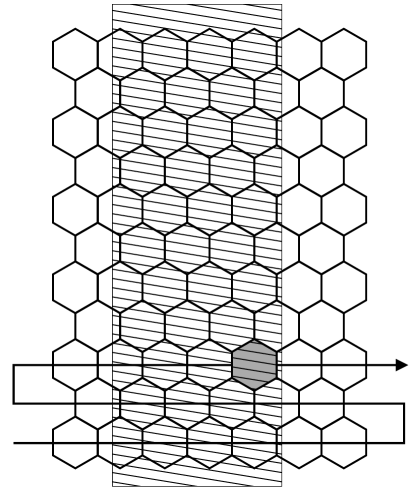
The IFU was aligned at the focal plane by projecting a laser beam back through the fibres onto the UKIRT secondary mirror. The CGS4 slit was set parallel to the row of fibre outputs, before adjusting the optics of the slit projection unit so that fibres were imaged two pixels apart in the spectrograph. The two pixel magnification was verified by illuminating the IFU with a mask in place, generating an image of the fibre slit at the detector with a gap for every input row. Since the mapping of the input to the slit reverses every row, to ensure that elements are adjacent both at the input and output (Fig. 1), the distance between illuminated band centres at the detector alternates about the row separation. By fitting a straight line to the centroids, the magnification was measured as pixels/fibre.
The J-band throughput of the IFU was measured by comparing observations of the standard stars HD 84800 and BS 4069, taken with the CGS4 slit and the SMIRFS-IFU respectively. Examination of the point-spread function (PSF) indicates that truncation of the seeing disc by the 4′′ slit did not cause significant light loss. The difference in airmass was small, giving an expected error due to atmospheric extinction of . It was found that the throughput is 50%, consistent with the figure of 49% from the 1997 commissioning run [Lee 1998].
Variations in the fibre transmissions were quantified by extracting a flat-field spectrum for each element (see §4.2) and integrating in wavelength (Fig. 2). The values therefore include crosstalk from neighbouring fibres. For Gaussian profiles with FWHM 1.8 pixels, the contribution from either neighbour is 10% of the total. Ignoring further smoothing due to interpolation and any correlation between throughputs, the measured and true RMS values are thus related as follows:
The measured RMS, , indicates the signal-to-noise fluctuation; it is 8% overall or 6% excluding the dead fibre and some vignetted elements. The corresponding values of , which characterizes the fibre bundle, are 10% and 7% respectively. It is concluded that whilst careful flat-fielding is important, inherent differences in the signal-to-noise ratio are reasonably modest.

The point spread function does not vary substantially between fibres. Whilst a previous estimate [Haynes et al. 1999] indicates that some profiles are up to 20% broader than others, the PSF is only known to an accuracy of 10%. Any variations at this level will contribute slightly to the Nyquist-scale noise in line width maps. The effect on line flux noise is negligible, since the broadening is a fraction of a pixel. Any inhomogeneities introduced by the fibres can be smoothed out to some extent by combining observations with slight spatial offsets.
4 Data reduction and analysis
4.1 Overview
Data were reduced in IRAF, using several purpose-written scripts and programs alongside standard tasks. As discussed in Turner (2001), the best method of dealing with fibre spectra depends largely on their separation and FWHM at the detector. For the SMIRFS-IFU, spectra are much more densely packed than in a multi-object design, precluding the use of existing extraction software. New tasks were also needed for reconstructing and working with the observed –– volumes in the form of datacubes, and for bad pixel correction. Because the slit maps to the field of view in a complex way, flexure in the spectrograph cannot be compensated by re-centring the target (this would be true anyway for off-centre mosaic positions). Observations must therefore be co-added after conversion to datacubes, rather than in their raw format. This requires effective bad pixel correction for integration pairs.
Turner (2001) presents an alternative reduction method for fibre-IFU data, inspired by the very dense packing of spectra, one per row, in TEIFU [Murray et al. 2000]. With the long CGS4 camera, the raw format of SMIRFS-IFU data is intermediate between that of TEIFU and multi-object designs. Since fibres are imaged with a FWHM of 1.8 pixels, the output pattern is almost critically sampled and is acceptable to interpolate in pixel coordinates. Moreover, the two pixel fibre separation is large enough that moderate smoothing by the interpolant will be small in relation to the image resolution. At the same time, flexure-related errors and undersampling at the IFU input rule out much gain in precision through TEIFU-style reduction. Hence, as for most fibre-based instruments, the reduction is based on extracting 1D spectra.
Finding absolute fibre positions on the detector after flexure is complicated by vignetting at the slit ends, which prevents direct location of the first and last elements. With an already limited field of view, it was decided to rely on the single broken fibre for measuring offsets between frames, rather than masking off row ends at the input to create regular gaps. This is usually adequate, if somewhat awkward and instrument-specific.
With 0.62′′ elements at the IFU input, undersampling is potentially an important issue. Inspection of various observations (with and without SMIRFS) indicates that the seeing during the February 1998 run was 0.9′′, including integration over the input microlenses; this figure is relatively favourable for such coarse sampling. A very basic simulation of spatial frequency propagation through the instrument shows that, depending on the alignment of fibres, pixels and image features, aliased frequencies in the data can have amplitudes up to 10% of the mean [Turner 2001]. However, the Fourier spectrum is only affected significantly above 80% of the Nyquist frequency, so moderate smoothing during extraction and reconstruction can easily eliminate much of the contamination. In principle, offset observations can be combined with phase shifts such that aliasing is removed [Lauer 1999], but in this case the main effect would be to amplify noise because the offsets are not known or controlled precisely (and the seeing varies). Nevertheless, simply co-adding datacubes after alignment on a common grid does suppress residual alias components, which add out of phase like noise. At the end of the reduction process, aliasing artifacts are not a major source of error.
4.2 Calibration and extraction
Each observation consists of two integrations, offset by one detector pixel in the spectral direction to account for bad pixels. These raw frames are largely obscured by non-uniform dark current. The first step was to subtract a sky pair from an object pair, removing dark current in the process. However, this double use means that sky frames cannot be smoothed spatially to reduce their noise level before subtraction. The result was then divided by a detector flat-field image, obtained with the calibration unit before the IFU was installed.
A less accurate dark frame, taken earlier in the night, was also subtracted from the object separately. This reveals the fibre throughput pattern so that the dead fibre can be located. Ideally, this would be done using a sky minus dark image, but flexure of a fraction of a pixel can occur even between consecutive pointings. This is important for image reconstruction, but less so for sky subtraction—assuming Gaussian fibre profiles and an offset of 0.3 pixels, the sky residual due to throughput variations is likely to be around 3%, falling below the noise level.
A program was written to combine the pairs of offset, sky subtracted frames with bad pixel removal. This makes a crude noise estimate based on the RMS residuals between the two images; any input pixel which differs from the median of its neighbours by more than a specified number of standard deviations is excluded. The procedure can sometimes truncate narrow arc lamp emission lines, whose gradients can be much greater than the noise level, but is safe for the galaxy spectra (which have had sky lines subtracted already). Any obvious remaining blemishes were removed manually.
Spectra were straightened with respect to detector rows by applying a small pre-determined shift to each column. A curvature model was constructed by measuring the centroid of a suitable image at each wavelength and fitting a low-order polynomial to the values. Interpolation was performed using a cubic spline, which is good for dealing with slightly undersampled data. Inspection of corrected frames verifies that the curvature is practically constant along the slit and hence independent of flexure. The maximum difference between columns is 0.7 rows.
Absolute fibre positions were found by summing the straightened object minus dark image in wavelength and fitting the dead fibre position using standard IRAF routines. The corresponding sky subtracted image was resampled so that fibres fell at the mid-points between odd pairs of rows. These pairs were combined with the blkavg task, producing a stack of extracted fibre spectra (boundary rows were discarded). Sometimes spatial gradients make the dead fibre difficult to identify, but the procedure can be repeated if a reconstruction appears distorted.
The stack of extracted spectra was divided by a fibre flat, created in the same way but averaged over its wavelength range. Sky emission lines in the object minus dark image were used for wavelength calibration. These allow correction of grating offsets between observations and also provide an absolute calibration. The spectra from every observation were interpolated onto a suitable standard grid, truncating the end few pixels which fell outside the common range. The error in determining the relative offsets is around 0.2Å. The error in the linear wavelength fit is 0.7Å, which is more than adequate for the present work. Separate solutions were not determined for the spectra within each observation; variation along the slit (Å) is smaller than the final random velocity errors in the mosaic and much smaller than the true gradient in the galaxy.
Finally, the stack was divided by a continuum-normalized stellar spectrum, to remove telluric absorption features. A Pa line in one of the stars was interpolated over. Unfortunately, the mosaicing process makes it difficult to re-observe the standard stars frequently, so there was sometimes a non-negligible difference in airmass from the galaxy. Although the main absorption band at 1.269m has been removed effectively in the final data, there may be some absorption residuals at around 2% of the continuum level.
4.3 Construction of datacubes and mosaicing
Sets of extracted spectra were interpolated spatially at each wavelength step, onto a square grid of 0.15′′ pixels.111We used the method of Renka and Cline[Renka 1983] for convenience. The constituent datacubes of each mosaic cycle were combined with appropriate offsets using the program mosaic, which has been included as a prototype task in the imspec package [Turner 2001]. This calculates the smallest common grid from a list of pointings and resamples the images at each wavelength using a tapered sinc function. The precise interpolation method is not important, since the datacube grids are much finer than the resolution of the data. A mask image is also produced, recording the number of input pixels contributing at each point.
Unfortunately, telescope pointing errors of a fraction of a fibre are evident. This is partly because a dichroic mirror is used to guide on the target at visible wavelengths whilst observing in the infrared; the two images drift apart as atmospheric dispersion changes with the airmass along the line of sight. Modelling this effect may systematically reduce errors, but was outside the scope of the current project. There may consequently be some image distortion at the points of overlap; mosaicing nevertheless reveals any wider-scale extension of spectral features within the noise limit of the data. For the NGC 4151 observations, emission turns out to be confined mainly to the central field; three mosaic positions with appreciable signal-to-noise, offset diagonally east and west, were finally used for mapping.
After constructing each separate mosaic, the resulting datacubes were combined using comcubes, also included in imspec. This is very similar to mosaic, but calculates the offsets between datacubes by locating the centroids of the intensity peaks after integrating in wavelength. The individual overlap masks are also combined to show the total number of data points contributing at each output pixel. The final datacube is divided by the mask, to scale the pixels correctly.
The spectral response of the instrument was determined by fitting piecewise polynomials to the continua of the standard star observations, dividing the results by black-body curves appropriate for their spectral types. This was achieved using the standard, sensfunc and calibrate tasks in the IRAF onedspec package. The response varies at the level of 5%, and with atmospheric absorption features already removed it is not strongly dependent on airmass. The accuracy to which the curve can be determined is limited mainly by the wings of absorption lines in the stars and atmosphere, which are difficult to distinguish from modulation in the continuum. The final datacube was divided by the response function using calibrate directly and the values normalized to a unit mean.
4.4 Mapping the flux and velocity field
A velocity map was obtained from the combined mosaic. Spectra with mean fluxes below 2.5% of the central value (about ) were not included, since line emission is barely detected at the corresponding distance. The NOAO task rvidlines was used to measure a combined [Fe II] and narrow Pa redshift for each spectrum. This is more reliable for low signal-to-noise peripheral points than using [Fe II] alone. The results show that differences in the velocity fields of the two lines are comparable with the measurement errors and small compared to the line widths. Hence any deviations introduced by Pa will not affect line strength measurements significantly. The plain text results from rvreidlines were redirected into a file and converted to a 2D image using listoim in imspec.
Line fluxes were measured using the specmap task in imspec. This reads the datacube, velocity map and a list of wavebands for line and continuum estimates, producing a flux map as output. The measurement bands and linear continuum estimates can be overplotted on the spectra for verification. Over the wavelength range observed, there is little pure continuum to provide a suitable reference for [Fe II], but experimenting with different bands shows that the derived spatial profiles are robust.
An excitation map, showing the strength of [Fe II] relative to Pa, was also produced. Since this involves dividing one image by the other, the result is sensitive to noise where emission is weak. The map was therefore created using line images from a spatially smoothed version of the datacube. Rough line width estimates were made by examining individual spectra with implot and splot.
5 Results and comparison with other data

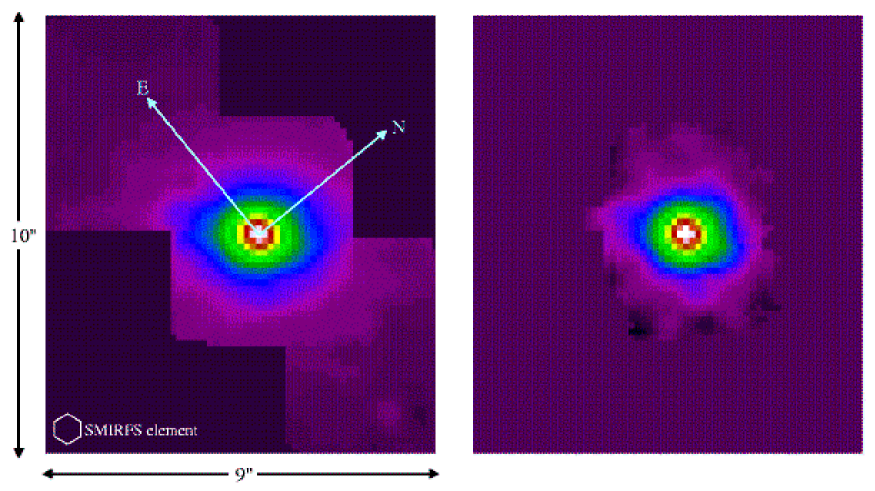
A wavelength-integrated image of NGC 4151 is shown in Fig. 3(a). Whilst some horizontal broadening is caused by the IFU, because spectra overlap, there is also a real NW–SE extension of the continuum, following the stellar distribution seen in optical images. Fig. 3(b) is an image of the Pa broad line (including the narrow line at 6% of the total), which gives an indication of the spatial resolution.
A central spectrum is presented in Fig. 4; this includes the broad and narrow Pa components, [Fe II] and [S IX]. There may also be contributions from a weaker 1.2703m [Fe II] feature, superimposed on the blue wing of the Pa broad line, and He I at 1.2791m, to the left of the Pa narrow line. The small bump to the right of [S IX] is probably due to imperfect removal of atmospheric absorption features.
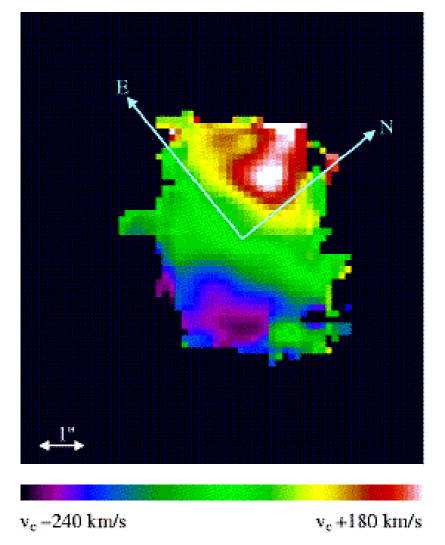
The combined [Fe II] and Pa velocity map (Fig. 5) traces the rotation of gas about an axis projected at a position angle of 110∘. It is broadly consistent both with previous slit measurements of the same features [Knop et al. 1996] and with optical spectroscopy of the NLR [Mediavilla & Arribas 1995, Winge et al. 1999]. Estimates of the line widths are complicated by the Pa broad line shape, lack of clear continuum and modest signal-to-noise ratio off centre. The line profiles have not been modelled with multiple components, but their overall deconvolved widths are close to the values found by Knop et al, who note that the width of [Fe II] relative to Pa suggests a contribution from shock excitation. At the centre, the FWHM values are approximately 400 km s-1 for [Fe II] and 250km s-1 for Pa. Both lines are broader in the brightest parts of the surrounding extended emission (see below), reaching 600 km s-1 and 400 km s-1 respectively. Additional broadening in the direction of the radio jet is not evident.
As an alternative to Knop et al.’s suggestion that the greater velocity width of the [Fe II] emission is due to a contribution from shock excitation, we note that our result is consistent with that for a sample of Seyfert 2 galaxies [Veilleux et al. 1997]. Veilleux et al. cite this as evidence that the two lines are emitted in different volumes of gas. We also note that Kaiser et al. (2000) found different components in the velocity field of NGC4151 revealed by [OIII] emission. They suggested that the low velocity dispersion component arises from smooth flow in the gravitational field of the galaxy while the high dispersion component results from an outflowing wind. Our result could arise if the Pa/[Fe II] ratio was higher in the low dispersion component than in the high dispersion component.
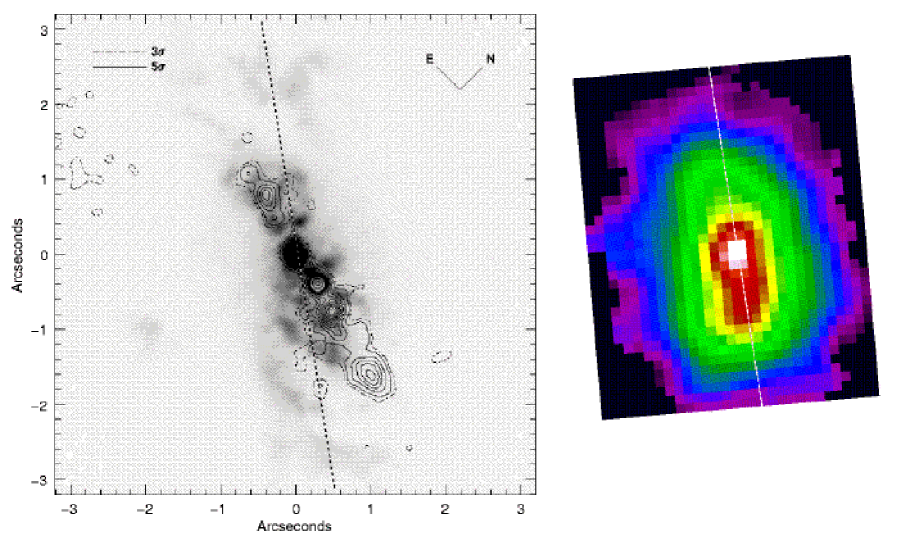
The spatial distribution of [Fe II] is mapped in Fig. 6, alongside examples of individual spectra. The image profile is extended along both axes of the IFU with an intrinsic RMS of 0.3–0.4′′ horizontally and 0.9–1.0′′ vertically (FWHM 0.8′′ and 2.2′′ respectively assuming a gaussian distribution). The narrowest point is at the intensity peak, as might be expected for a biconical shape. Although these scales are comparable to the image resolution, it is clear that the [Fe II] is aligned closer to the optical line emission than to the radio axis. The best fit to the slope of the horizontal centroid has a PA of 54∘, part way between the NLR and ENLR axes. For the data to fit the radio axis equally well, either end of the outside (25%) contour would have to be displaced by 0.8′′.
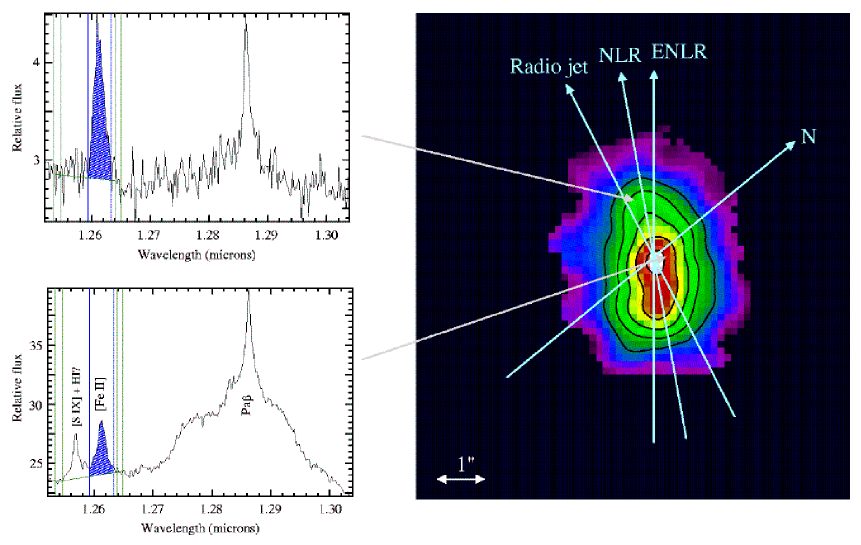
Fig. 7 compares the [Fe II] map directly with a narrow-band HST image of [O III] line emission [Kaiser et al. 2000] and a contour map of the radio jet at 8 MHz [Mundell et al. 1995]. It can be seen that the region over which [Fe II] is detected in the SMIRFS data corresponds to the extent of the narrow line region. If there were a strong correspondence with the radio jet, one might expect a more elongated distribution, resolving some knot structure at , where the outflow interacts with gas. Although detection of the larger-scale ENLR would have provided a better separation, the spatial association of [Fe II] with photoionized gas is more convincing than with shocking by radio plasma. The F502N filter used for imaging [O III] covers almost all of the NLR velocity range [Hutchings et al. 1999, Kaiser et al. 2000], so represents the total emission well. It is perhaps interesting to note that [Fe II] appears better correlated with the positions of low velocity dispersion clouds, plotted in [Kaiser et al. 2000], than the NLR as a whole. However, this is at variance with our previous suggestion that the greater velocity width of the [Fe II] line compared with Pa suggests an association with the high dispersion component.
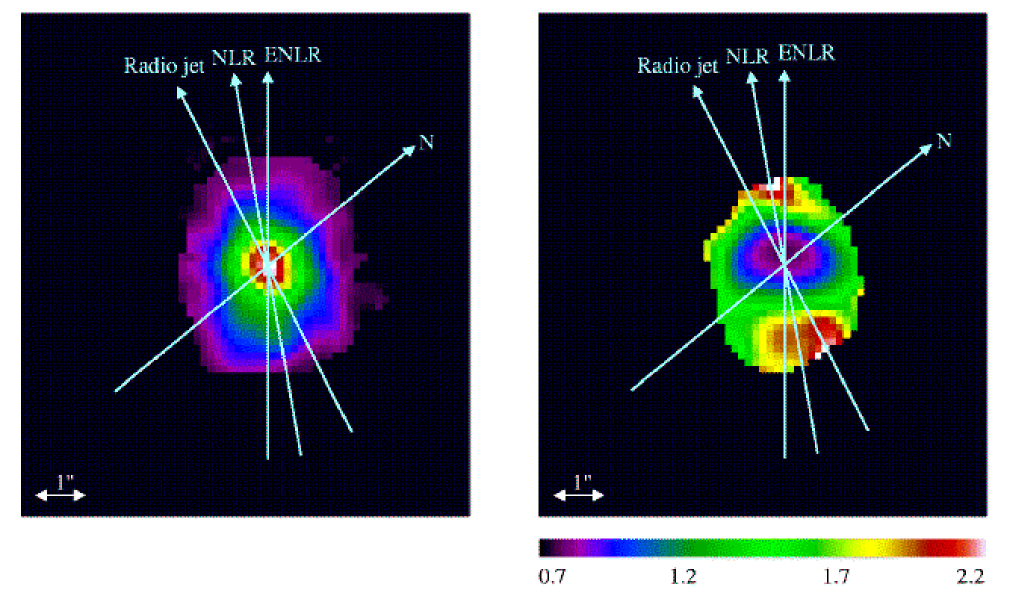
The Pa narrow line is slightly extended in both directions, and has a faint wing out to 1.5′′ South-West of the centre, where the NLR is brightest. Fig. 8 shows both the Pa flux and [Fe II]/Pa ratio. Since Pa falls off fairly rapidly from the centre, the ratio is highly sensitive to noise artifacts. The datacube was therefore smoothed with a 0.9′′ wide Gaussian kernel before producing the excitation map, preserving minimal resolution of spatial structure. The line ratio is 0.7 at the centre and along the radio jet at the edges. A dip near the centre is to be expected for photoionization, since the strong incident flux creates large fully ionized zones, favouring Pa over [Fe II] [Mouri et al. 2000]. The high areas could reflect an enhancement of [Fe II] emission by shocks, but the line images are more indicative of a drop in Pa at those points, with respect to [O III], than of strong [Fe II]. To the South-West, a few highly-ionized clouds may just happen to give stronger Pa away from the radio axis, whilst to the North-East, the NLR is angled slightly more towards the radio jet anyway.
6 Conclusions
The distribution of [Fe II] emission at the centre of NGC 4151 has been mapped in two dimensions, using the innovative SMIRFS-IFU. Although the line is only detected over a few spatial resolution elements, it is evident that its image profile is better aligned with the visible narrow line region than with the radio jet. The study therefore suggests that [Fe II] arises primarily through photoionization of gas, by collimated X-rays from the Seyfert nucleus. The mean velocity field is consistent with this interpretation, indicating that [Fe II], Pa and the NLR all have similar bulk kinematics. Likewise, the variation in [Fe II]/Pa is compatible with photoionization dominating. As suggested by previous authors, shock excitation by outflowing radio plasma may make a secondary contribution to the emission. However, the evidence for this comes mainly from line widths, whereas tentative measurements suggest, if anything, that [Fe II] is broader along the NLR than the radio jet.
Despite the small field and prototypical nature of the IFU, these results demonstrate the utility of integral field spectroscopy in investigating the properties of active galaxies. Without a two dimensional field, it would have been very difficult to determine the spatial orientation of the line emission. Narrow-band imaging can also fulfil this requirement, given appropriate filters, but follow-up spectroscopy is then required to form a complete picture. The experience gained with the SMIRFS-IFU and associated data analysis has paved the way for subsequent projects, both technical and observational.
Reduction of the IFU data has highlighted a few important observational issues. In particular, location of spectra on the detector is difficult, and it is recommended that more than one reference gap between fibres should be available in future work. With a number of sources of error and inhomogeneity, the availability of multiple observations at each position has been very valuable.
Whilst the results presented here support the argument for [Fe II] originating in photoionized gas, there is no doubt that observations at high spatial resolution, as well as of the wider ENLR, will provide further insight into the nature of NGC 4151 and other Seyfert galaxies. With a bright, point-like nucleus, NGC 4151 is an ideal target for J-band observations with adaptive optics. This would provide a useful counterpart to the Hubble Space Telescope observations of [O III] emission, which have revealed the cloud structure and detailed kinematics of the NLR. In conjunction with recent models of photoionized and shock excited gas, comparison of optical and infrared lines in individual clouds would provide important information about the physical conditions and kinematic structure of the NLR. The misalignment with the radio jet will again help determine its influence on the ambient gas.
Acknowledgements
The authors thank George Dodsworth and Ian Lewis for their work on the design and construction of the SMIRFS IFU and Ray Sharples, Ian Parry and Reynier Peletier for their valuable contributions. The United Kingdom Infrared Telescope is operated by the Joint Astronomy Centre on behalf of the U.K. Particle Physics and Astronomy Research Council.
References
- [Allington-Smith & Content 1998] Allington-Smith J.R. and Content R. 1998, PASP, 110, 1216-1234.
- [Allington-Smith et al. 2000] Allington-Smith J.R., Content R., Dodsworth G.N., Murray G.J., Ren D., Robertson, D. J., Turner, J.E.H. and Webster, J. 2000, SPIE 4008, 1172-1180.
- [Antonucci 1993] Antonucci R., 1993, ARA&A, 31, 473-521.
- [Evans et al. 1993] Evans I.N., Tsvetanov Z., Kriss G.A., Ford H.C., Caganoff S. and Koratkar A. P., 1993, ApJ, 417, 82.
- [Ferland & Netzer 1983] Ferland G.J. and Netzer H., 1983, ApJ, 264, 105-113.
- [Forbes et al. 1993] Forbes D.A., Ward M.J., Rotaciuc V., Blietz M., Genzel R., Drapatz S. van der Werf P.P. and Krabbe A., 1993, ApJ, 406, L11-L14.
- [Greenhouse et al. 1991] Greenhouse M.A., Woodward C.E., Thronson H.A., Rudy R.J., Rossano G.S., Erwin P. and Puetter R.C., 1991, ApJ, 383, 164-173.
- [Greenhouse et al. 1997] Greenhouse M.A., Satyapal S., Woodward C.E., Fischer J., Thompson K.L., Forrest W.J., Pipher J.L., Raines N., Smith H.A., Watson D.M. & Rudy R.J., 1997, ApJ, 476, 105-112.
- [Haynes et al. 1999] Haynes R., Lee D., Allington-Smith J., Content R., Dodsworth G., Lewis I., Sharples R., Turner J., Webster J., Done C., Peletier R., Parry I. & Chapman S.. 1999, PASP 111, 1451
- [Hutchings et al. 1999] Hutchings J.B., Crenshaw D.M., Danks A.C., Gull T.R., Kraemer S.B., Nelson C.H., Weistrop D., Kaiser M.E. and Joseph C.L. 1999, AJ, 118, 2101-2107.
- [Kaiser et al. 2000] Kaiser M.E., Bradley L.D., Hutchings J.B., Crenshaw D.M., Gull T.R., Kraemar S.B., Nelson C.H., Ruiz J., and Westrop, D., 2000, ApJ, 528, 260-275.
- [Knop et al. 1996] Knop R.A., Armus L., Larkin J.E., Matthews K., Shupe D.L., and Soifer B.T., 1996, AJ, 112, 81.
- [Lauer 1999] Lauer T.R., 1999, PASP 111, 227-237.
- [Lee 1998] Lee D., 1998, PhD thesis, University of Durham.
- [Lester et al. 1990] Lester D.F. Gaffney, N. Carr, J.S. & Voy, M., 1990, ApJ, 352, 544-560.
- [Maoz et al. 1991] Maoz D., Netzer H., Mazeh T., Beck S., Almoznino E., Leibowitz E., Brosch N., Mendelson H. and Laor A. 1991, ApJ, 367, 493-506.
- [Mediavilla & Arribas 1995] Mediavilla E. & Arribas S., 1995, MNRAS 276, 579-591.
- [Morse et al. 1996] Morse J.A., Raymond J.C. and Wilson A.S. 1996, PASP, 108, 426.
- [Mouri et al. 1990] Mouri H., Nishida M., Taniguchi Y. and Kawara K. 1990, ApJ, 360, 55-62.
- [Mouri et al. 2000] Mouri H., Kawara K. and Taniguchi Y. 2000, ApJ, 528, 186-200.
- [Mulchaey et al. 1996] Mulchaey J.S., Wilson A.S. and Tsvetanov Z., 1996, ApJS, 102, 309.
- [Mundell et al. 1995] Mundell C.G., Pedlar A., Baum S.A., O’Dea C.P., Gallimore J.F. and Brinks, E., 1995, MNRAS, 272, 355-362.
- [Murray et al. 2000] Murray G., Allington-Smith J., Content R., Dodsworth G., Dunlop C., Haynes R., Sharples R. anad Webster J., 2000, SPIE 4008, 611-622
- [Osterbrock 1989] Osterbrock D.E., 1989, ‘Astrophysics of Gaseous Nebulae and Active Galactic Nuclei’ Mill Valley: University Science Books.
- [Pedlar et al. 1993] Pedlar A., Kukula M.J., Longley D.P.T., Muxlow T.W.B., Axon D.J., Baum S., O’Dea C. and Unger S. W., 1993, MNRAS, 263, 471.
- [Penston et al. 1990] Penston M.V. et al. 1990, A&A, 326, 53-62.
- [Perez et al. 1989] Perez E., Gonzalez-Delgado R., Tadhunter C. and Tsvetanov Z., 1989, MNRAS, 241, 31P-36P.
- [Peterson 1997] Peterson B., 1997, ‘An Introduction to Active Galactic Nuclei’, Cambridge University Press
- [Renka 1983] Renka R.L., 1983, ACM Trans. Math. Software, 9, 440-442.
- [Rieke & Lebofsky 1981] Rieke G.H. & Lebofsky M.J., 1981, ApJ, 250, 87-97.
- [Robinson et al. 1994] Robinson A. et al. 1984, A&A, 291, 351-391.
- [Savage & Sembach 1996] Savage B.D. and Sembach K.R., 1996, ARA&A, 34, 279-330.
- [Seyfert 1943] Seyfert K., 1943, ApJ, 97, 28.
- [Simpson et al. 1996] Simpson C., Ward M., Clements D.L. and Rawlings, S, 1996, MNRAS, 281, 509-521.
- [Turner 2001] Turner J.E.H., 2001, PhD Thesis, University of Durham
- [Unger et al. 1987] Unger S.W., Pedlar A., Axon D.J., Whittle M., Meurs E.J.A. and Ward, M.J. 1987, MNRAS 228, 671-679.
- [Veilleux et al. 1997] Veilleux S, Goodrich R.W. and Hill G.J., 1997, ApJ, 477, 631-680.
- [Winge et al. 1999] Winge C., Axon D.J., Macchetto F.D., Capetti A. and Marconi, A, 1999, ApJ, 519, 134-152.
- [Wright et al. 1993] Wright G.S., Mountain C.M., Bridger A., Daly P.N., Griffin J.L. and Ramsay Howat, S.K. 1993, SPIE, 1946, 547-557.