COMPTEL Observations of the Gamma-Ray Blazar PKS 1622-297
We report results of observations and analyses on the -ray blazar PKS 1622-297, with emphasis on the COMPTEL data (0.75 - 30 MeV) collected between April 1991 and November 1997. PKS 1622-297 was detected as a source of -rays by the EGRET experiment aboard CGRO in 1995 during a -ray outburst at energies above 100 MeV lasting for five weeks. In this time period the blazar was significantly ( 5.9 ) detected by COMPTEL at 10-30 MeV. At lower COMPTEL energies the detection is marginal, resulting in a hard MeV spectrum. The combined COMPTEL/EGRET energy spectrum shows a break at MeV energies. The broad-band spectrum (radio - -rays) shows that the -ray emission dominates the overall power output. On top of the 5-week -ray outburst, EGRET detected a huge flare lasting for 1 day. Enhanced MeV emission (10 - 30 MeV) is found near the time of this flare, suggesting a possible time delay with respect to the emission above 100 MeV. Outside the 5-week flaring period in 1995, we do not detect MeV emission from PKS 1622-297.
Key Words.:
rays: observations — galaxies: active — galaxies: quasars: individual: PKS 1622-2971 Introduction
The EGRET experiment aboard the Compton Gamma-Ray Observatory (CGRO) has detected roughly 90 blazar-type Active Galactic Nuclei (AGN) at -ray energies above 100 MeV (Hartman et al., 1999). Ten of these were also detected by COMPTEL measuring at lower-energy -rays in the 0.75 - 30 MeV band, e.g. CTA 102 and 3C 454.3 (Blom et al., 1995a), PKS 0528+134 (Collmar et al., 1997a), PKS 0208-512 (Blom et al., 1995b), 3C 273 and 3C 279 (Hermsen et al., 1993; Williams et al., 1995; Collmar et al., 2000). They are often detected during -ray flaring periods reported by EGRET at energies above 100 MeV. Another such example is the blazar PKS 1622-297 discussed in this paper. It was detected by the CGRO experiments OSSE, COMPTEL and EGRET at -ray energies during a 5-week flaring period between June 6 and July 10, 1995 (Kurfess et al., 1995; Collmar et al., 1997b; Mattox et al., 1997).
The quasar PKS 1622-297 has a redshift of z = 0.815 (Wright & Otrupcek, 1990) and is located at (l,b) = (348.82∘,13.32∘). It is a known radio source with a flat radio spectrum (flat-spectrum radio quasar) (Kühr et al., 1981; Steppe et al., 1993), showing polarization of 4.6 at 5 GHz (Impey & Tapia, 1990). In the optical band PKS 1622-297 is a weak source with typical visual magnitudes around 20 to 21 mag (e.g. Torres & Wroblewski, 1984; Saikia et al., 1987). X-rays of PKS 1622-297 were detected by ROSAT with a flux of (3.20.8)10-13 erg cm-1 s-1 in the 0.1-2.4 keV energy band (Mattox et al., 1997).
In June and July 1995 the quasar was observed to be flaring at -ray energies above 100 MeV by EGRET. The COMPTEL experiment also detected the source at MeV -ray energies in this period. Preliminary COMPTEL results, reported by Collmar et al. (1997b), provide a source detection at a significance level of 5 and a hint for flux variability in the energy range 10-30 MeV. After the -ray outburst was recognized a target-of-opportunity (ToO) observation for CGRO was declared (June 30 - July 10, 1995) which caused the OSSE experiment (0.05 - 10 MeV) to participate in observing PKS 1622-297. The quasar was detected by OSSE at 6 . The simultaneous EGRET and OSSE spectra are consistent with a simple power-law shape with photon index 1.87 (Mattox et al., 1997). On top of this -ray outburst, EGRET observed a huge -ray flare with intraday variability, which occurred around June 24, 1995 and lasted for 1 day (Mattox et al., 1997). Its peak flux of (173)10-6 ph cm-2 s-1 is among the brightest ones ever observed from any blazar by EGRET.
| VP | Date | Object | Offset angle | Effective exposure | CGRO Phases |
| (dd/mm/yy) | days | ||||
| 5.0 | 12/07/91-26/07/91 | Gal. Center | 20.6∘ | 5.0 | Phase I |
| 16.0 | 12/12/91-27/12/91 | SCO X-1 | 12.8∘ | 5.6 | |
| 23.0 | 19/03/92-02/04/92 | CIR X-1 | 28.3∘ | 2.2 | |
| 27.0 | 28/04/92-07/05/92 | 4U 1543 | 19.7∘ | 1.7 | |
| 210.0 | 22/02/93-25/02/93 | Gal. Center | 9.7∘ | 0.6 | Phase II |
| 214.0 | 29/03/93-01/04/93 | Gal. Center | 9.7∘ | 0.7 | |
| 219.4 | 05/05/93-06/05/93 | Gal. Center | 2.68∘ | 0.5 | |
| 223.0 | 31/05/93-03/06/93 | Gal. Center | 16.9∘ | 0.7 | |
| 226.0 | 19/06/93-29/06/93 | GAL 355+05 | 10.3∘ | 2.1 | |
| 229.0 | 10/08/93-11/08/93 | GAL 5+05 | 18.0∘ | 0.2 | |
| 232.0 | 24/08/93-26/08/93 | GAl 348+00 | 13.4∘ | 0.4 | |
| 232.5 | 26/08/93-07/09/93 | GAl 348+00 | 13.4∘ | 2.6 | |
| 302.3 | 09/09/93-21/09/93 | GX 1+4 | 13.0∘ | 2.6 | Phase III |
| 323.0 | 22/03/94-05/04/94 | GAL 357-11 | 25.9∘ | 4.3 | |
| 324.0 | 19/04/94-26/04/94 | GAl 015+05 | 26.9∘ | 2.5 | |
| 334.0 | 18/07/94-25/07/94 | GAL 009-08 | 29.5∘ | 2.1 | |
| 336.5 | 04/08/94-09/08/94 | GRO J1655-40 | 13.4∘ | 1.5 | |
| 338.0 | 29/08/94-31/08/94 | GRO J1655 | 11.5∘ | 0.6 | |
| 414.3 | 29/03/95-04/04/95 | GRO J1655-40 | 12.8∘ | 2.0 | Phase IV |
| 421.0 | 06/06/95-13/06/95 | Gal. Center | 14.5∘ | 2.2 | |
| 422.0 | 13/06/95-20/06/95 | Gal. Center | 15.2∘ | 2.1 | |
| 423.0 | 20/06/95-30/06/95 | Gal. Center | 19.2∘ | 3.2 | |
| 423.5 | 30/06/95-10/07/95 | PKS 1622-297 | 3.0∘ | 2.8 | |
| 508.0 | 14/12/95-20/12/95 | GAL 005+00 | 21.3∘ | 1.7 | Phase V |
| 516.1 | 18/03/96-21/03/96 | GRO J1655-40 | 10.9∘ | 0.8 | |
| 524.0 | 09/07/96-23/07/96 | GX 339-4 | 17.8∘ | 3.8 | |
| 529.5 | 27/08/96-06/09/96 | GRO J1655-40 | 11.5∘ | 2.7 | |
| 624.1 | 04/02/97-11/02/97 | Gal 16+00 | 28.5∘ | 2.0 | Phase VI |
During the CGRO mission (April 1991 to June 2000), COMPTEL has conducted many observations of PKS 1622-297. We used the first 6 years of data to study the MeV behaviour of PKS 1622-297 (i.e., the data before the second reboost of CGRO in 1997 which changed the background environment for COMPTEL). We describe the COMPTEL observations in Sect. 3. In Sect. 4 we report the main COMPTEL results on detections, light curves and energy spectra, and compare them to the results in neighboring energy bands, in particular to the EGRET ones. We discuss our findings in the framework of current -ray emission scenarios for blazars in Sect. 5, and finally summarize in Sect. 6.
2 Instrument and data analysis
The imaging Compton Telescope COMPTEL is sensitive to -rays in the energy range 0.75-30 MeV with an energy-dependent energy resolution between 5 and 10 and an angular resolution of 1∘ - 2∘. It consists of two layers of detectors (upper and lower) which are separated by 1.58 m. An incident photon is first Compton scattered in one of the upper detectors and then – ideally – completely absorbed in one of the lower detectors. Two orthogonal coordinates (, ), describing the direction of the scattered -ray, can be obtained from the interaction locations in the two detector layers. The Compton scatter angle, , can be calculated from the measured energy deposits in the two detectors. Therefore the direction of the incident photon is located on a projected circle on the sky. The scatter direction (, ) and the Compton scatter angle () constitute a three-dimensional data space in which the spatial response of the instrument is cone-shaped. For more details about the COMPTEL instrument see Schönfelder et al. (1993).
There are two standard imaging methods, maximum-likelihood and maximum entropy, for the COMPTEL data analysis in this three-dimensional data space. Flux estimates and statistical significances can be obtained by applying the maximum-likelihood method. The quantity -2ln, where is the likelihood ratio of two hypotheses (background, background + source) provides the detection significance for a -ray source (de Boer et al., 1992). This -2ln quantity has a distribution (3 degrees of freedom) for a unknown point source (search modus) and a distribution for a known source (check at a given position). In order to estimate the COMPTEL background the standard filter technique (Bloemen et al., 1994) was applied. Because PKS 1622-297 is located towards the inner Galaxy, models of the diffuse galactic emission (bremsstrahlung, inverse-Compton radiation) were included in the analysis. An isotropic component describing the extragalactic diffuse emission was included as well. For flux estimates we assumed point spread functions with an E-2 power law shape for the source input spectrum. We note that the derived fluxes are weakly dependent on this particular choice.
3 Observations
From the beginning of the CGRO mission in April 1991 up to the second reboost of CGRO in April 1997, which changed the background environment at lower (4.3 MeV) COMPTEL energies significantly, PKS 1622-297 was many times within the COMPTEL field-of-view (fov). This time period covered 230 CGRO viewing periods (VP) typically lasting 1 to 2 weeks each, and 6 so-called CGRO Phases each covering a time period of roughly 1 year. For our analysis we selected 28 pointings (see Table 1) for which the angle between the COMPTEL pointing direction and the source direction was less than 30∘. As listed in Table 1, CGRO viewing period (VP) 229.5 is added to VP 229.0 because the pointing was the same. In summary, between April 1991 and February 1997 PKS 1622-297 was 215 days within 30∘ of the COMPTEL pointing direction, resulting in a total effective exposure (100% COMPTEL pointed directly to the source) of 59.2 days.
| Period | 0.75-1 | 1-3 | 3-10 | 10-30 |
|---|---|---|---|---|
| VP 421.0 | 23.5 | 22.3 | 10.3 | 3.21.5 |
| VP 422.0 | 50.6 | 20.1 | 7.8 | 2.71.4 |
| VP 423.0 | 38.4 | 23.6 | 9.4 | 5.91.4 |
| VP 423.5 | 18.7 | 16.3 | 4.23.0 | 1.81.0 |
| Flaring state | 10.1 | 9.7 | 2.51.7 | 3.50.6 |
| Quiescent state | 6.0 | 4.4 | 1.7 | 0.8 |
4 Results
4.1 Source detections
EGRET reported a strong detection of 25 with a large -ray flux during the -ray outburst period in 1995 (Mattox et al., 1997). Outside this period only marginal evidence for the source, i.e. a low flux level, is found by EGRET (Fig. 1). According to the measured EGRET flux, we define two -ray states for PKS 1622-297: a ’-ray flaring’ state covering the 4 VPs 421.0 to 423.5, and a ’-ray quiescent’ state which covers the remaining 24 pointings. In the rest of the paper, we will refer to the relevant observational periods/times as the ’-ray flaring’ and ’-ray quiescent’ periods.

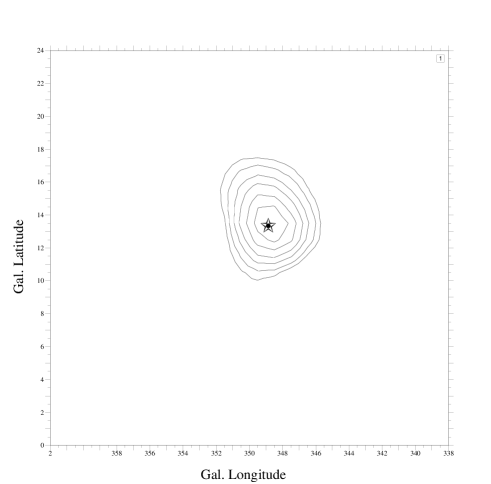
COMPTEL imaging analysis revealed evidence for PKS 1622-297 during the 5-week flaring period in 1995. In the sum of these data the quasar is detected in the uppermost COMPTEL band (10 - 30 MeV) with a significance of 5.9 , assuming -statistics for a known source (Fig. 2). Below 10 MeV the detection of the source is only marginal ( 1.5 in the 3-10 MeV band) or non-detections occur (below 3 MeV). Evidence for the source in the 10-30 MeV band is found in each of the 4 individual VPs, typically at the a 2-significance level. Outside this -ray flaring period in 1995 PKS 1622-297 is detected marginally by COMPTEL only in Phase 5+6 in the 10-30 MeV band (Fig. 1). The relevant flux results are given in Table 2.
4.2 Time variability
During the first 6 years of the CGRO mission, PKS 1622-297 was strongly variable at -ray energies above 100 MeV with the major outburst in 1995. Due to the poorer statistics, the detection of time variability cannot easily be claimed by COMPTEL. Nevertheless, the COMPTEL detections and non-detections in the 10-30 MeV band still follow the EGRET trend on long (Fig. 1) as well as on short time scales (Fig. 3). On long terms (years) the maximum flux is reached during CGRO Phase 4 (October 1994 to October 1995), which comprises the -ray outburst period in 1995. On shorter time scales (weeks), during the -ray flare state, evidence for PKS 1622-297 is found in each VP by EGRET as well as by COMPTEL. Both flare-state light curves do not show strong flux variability (Fig. 3).


On even shorter time scales (days), however, Mattox et al. (1997) report a short huge flare on top of the -ray high state light curve, which occurred within VP 423.0 (flux maximizing at TJD 9892.77) and lasted for 1 day (Fig. 4). We searched the COMPTEL data for a possible MeV counterpart by subdividing VP 423 into 3 parts according to the EGRET light curve: a pre-flare (TJD 9888.8 - 9892.7), on-flare (TJD 9892.7 - 9895.6), and post-flare part (TJD 9895.6 - 9898.6). The on-flare part covers the time period of TJD 9892.7-9893.7, during which the short huge flare peaked in flux reaching a value of (173)10-6 ph cm-2 s-1 at energies 100 MeV (Mattox et al., 1997). The 10-30 MeV light curve is shown in Fig. 4. It is obvious that the MeV emission is stronger in the flare and post-flare period than during other parts. The combination of on-flare and post-flare periods provides a 5 detection of the source and clearly shows enhanced MeV emission around the time of the major EGRET flare (Fig. 4). Fitting three data points, pre-flare, combination of on-flare and post-flare, and the flux for VP 423.5 by assuming a constant flux, results in a -value of 9.4, which, with 2 degrees of freedom, corresponds to a probability of 910-3 for a constant flux or roughly 2.6 for a variable flux. We note that the highest COMPTEL flux is found immediately after the flare in the EGRET band (Fig. 4). This suggests a time delay of a few days between the two bands in the sense that the higher energies -rays come first.
4.3 Energy spectra
We generated two separate MeV spectra of PKS 1622-297: a ’-ray flaring’ spectrum by combining the COMPTEL data of the 4 relevant VPs and a ’-ray quiescent’ spectrum by combining the rest of the observations (24 VPs). A fit to the flaring spectrum results in a photon index of 0.65 (Table 3). Due to the marginal detections at energies below 10 MeV the spectral index cannot be constrained well. However, a ’hard’ (2, ) MeV shape is obvious (Fig. 5). This shows that during the -ray outburst period the MeV band is still on the rising part of the IC emission. No meaningful conclusions can be derived for the spectrum of the quiescent state, because only upper limits were obtained. A comparison of both spectra shows that during the flaring state the 10-30 MeV flux was at least 4 times larger than during the rest.
| Data | PL-Index | I0 | E0 | |
|---|---|---|---|---|
| () | (10-8cm-2 s-1 MeV-1) | (MeV) | ||
| VPs 421.0-423.5 (0.75 MeV - 30 MeV) | 0.65 | 588.0 | 3.0 | 0.34 |
| VPs 421.0-423.5 (30 MeV - 10 GeV) | 2.15 | 0.26 | 294.8 | 2.56 |
| VPs 421.0-423.5 (0.75 MeV - 10 GeV) | 2.03 | 0.54 | 200.0 | 4.26 |
| VP 423.5 (0.05 MeV - 10 GeV) | 1.84 | 1.6 | 100.0 | 1.31 |
| Data | I0 (200 MeV) | Eb | |||
|---|---|---|---|---|---|
| (MeV) | |||||
| VPs 421.0-423.5 (0.75 MeV - 10 GeV) | 2.15 | 0.60 | 1.18 | 16.2 | 2.06 |
| (fixed) | (fixed) | ||||
| VP 423.5 (0.05 MeV - 10 GeV) | 2.57 | 1.49 | 0.78 | 630.0 | 0.67 |
The EGRET spectrum (30 MeV to 10 GeV) of the -ray flaring state is consistent with a power-law shape and a photon index of 2.150.07 (Table 3, Fig. 5). If combined with the simultaneous COMPTEL spectrum a spectral break becomes evident.
Fitting a simple power-law model,
| (1) |
where the parameter is the photon index, and I0 the differential flux at the normalization energy E0, results in an unacceptable reduced -value of 4.26 (Table 3). To improve on that we applied a broken power-law model of the form
| (2) |
where is the high-energy spectral index, the break in the spectral photon index towards lower energies ( = - ), and Eb the break energy. With a reduced of 2.1 this model significantly improves the fit, proving quantitatively the spectral turnover. By fixing the parameters I0 and to the values obtained by fitting a power-law model to the EGRET data only, we derive information on the spectral break. Best-fit values of = 1.18 and Eb = 16.2 MeV are derived. The 1 errors are obtained by adding 2.3 to the minimum -value as is appropriate for 2 parameters of interest (Lampton et al., 1976). However, due to the insignificance of the COMPTEL data at energies below 10 MeV the low-energy slope () could not be constrained.


The EGRET spectra of the 4 flare-state VPs have been analyzed individually assuming power-law shapes. Within uncertainties the 4 derived photon indices are identical (Table 4). We then have combined the EGRET and COMPTEL spectra of these 4 VPs to check for possible spectral variability during the -ray outburst over a broader energy band (Fig. 6). The COMPTEL 10-30 MeV flux follows for each VP generally the extrapolation of the EGRET spectrum except from VP 423, where the flux is slightly above the EGRET extrapolation. The non or marginal detections at energies below 10 MeV indicate a hard MeV spectrum and – together with the EGRET spectral shape – a spectral break at MeV energies for VP 421, even taking into account the errors on the spectral index (Fig. 6).
| Observations | Photon Index | Integral flux |
|---|---|---|
| Periods | () | ( 10-8 ph cm-2 s-1) |
| VP 421.0 | 2.330.16 | 233.135.7 |
| VP 422.0 | 2.060.11 | 321.833.5 |
| VP 423.0 | 2.130.10 | 267.134.9 |
| VP 423.5 | 2.110.11 | 242.123.2 |
After the -ray activity of PKS 1622-297 had been recognized by EGRET, a target-of-opportunity (ToO) observation for CGRO was declared and carried out in VP 423.5 with participation of OSSE. This provided a measurement of the spectrum down to 0.05 MeV. Mattox et al. (1997) reported that the OSSE and EGRET data can each be represented by similar power-law shapes with photon indices of 2.00.2 and 2.20.1, respectively (Fig. 7). However, fitting a simple power-law shape to the combined OSSE/EGRET data, they obtained a photon index of 1.870.02. We have added the simultaneous COMPTEL data to this spectrum. Fitting the combined simultaneous OSSE/COMPTEL/EGRET spectrum with a simple power-law shape results in a reduced of 1.31 and photon spectral index of 1.840.02 (Table 3). If one fits a broken power law model using the formula described in Eq. (2) an improved reduced of 0.67 (Table 3) is derived. However, the break parameters cannot be constrained significantly. The measurements are too uncertain to constrain the spectral shape.
4.4 Multiwavelength observations
During the CGRO ToO -ray observation, measurements at lower energies were conducted as well. IUE observed the source on July 1, 5, 6, 8 and found time variability of its flux (Bonnell et al., 1995). Optical observations indicated that the quasar was very active in June and July. A R-band light curve for the 1995 flaring period is given in Fig. 8. The source is 3 - 5 magnitudes brighter than previously observed (e.g. Torres & Wroblewski, 1984; Saikia et al., 1987) and shows flux variability larger than a factor of 2 within 1 day (TJD 9902-9903). Due to the sparse sampling in the optical, flux correlations between optical and -ray energies cannot be identified.


The Effelsberg 100-m radio telescope conducted 4 observations at the frequency of 10.45 GHz and 1 observation at 32 GHz between June 22 and July 20, 1995. No significant flux increase compared to previous measurements was found at the two frequencies (Reich et al., 1998). Using these (quasi) simultaneous multiwavelength observations, we generated the multiwavelength spectrum of PKS 1622-297 during its -ray high state (Fig. 9). The spectrum shows that the -rays are dominating the bolometric luminosity by far, and that the luminosity peak is at MeV energies. This is similar to other such -ray loud flat-spectrum radio quasars like PKS 0528+134 (e.g. Collmar et al., 1997a) and 3C 279 (e.g. Hartman et al., 2001; Collmar et al., 2001).
5 Discussion
During the first 6 years of the CGRO mission, the radio-loud quasar PKS 1622-297 was observed several times by the CGRO instruments EGRET and COMPTEL. -ray emission at energies above 100 MeV was detected by the EGRET experiment in June and July 1995, and also simultaneously by COMPTEL at lower -ray energies; in particular in the 10-30 MeV band. An energy flux (10 MeV - 10 GeV) of 2.6710-9 erg cm-2 s-1 is obtained from the combined COMPTEL/EGRET spectrum during that period. For a Friedmann universe with q0=1/2 and H0=75 km s-1 Mpc-1, we derive an isotropic luminosity of 4.471048 erg s-1. The corresponding minimum mass of the putative central black hole for Eddington-limited accretion is about 3.551010 M⊙ in the Thompson regime, and about 3.4108 M⊙ when the Klein-Nishina cross section for Compton scattering of the high energy -ray photons is taken into account. The limit on the Schwarzschild radius is then given as Rs 1.11014 cm, which is a factor of 2 lower than obtained by Mattox et al. (1997).
Many COMPTEL results suggest that the MeV band is a spectral transition region for the -ray emission of blazars (e.g. Hermsen et al., 1993; Bloemen et al., 1995; Collmar et al., 1997a) . This becomes obvious by multifrequency observations of these sources which show that their luminosities often peak at MeV energies, and – if no MeV observations are available – by the fact that the soft -ray spectra measured by EGRET have to match the hard X-ray spectra. EGRET revealed that blazars are always variable at -ray energies (e.g. Mukherjee et al., 1997) . The observational facts of short-term variability ( days) and simultaneously large luminosities imply a very compact emission region. In order to avoid the problem of - absorption in such regions of extreme photon densities, emission of the -rays from a relativistic jet is generally assumed (e.g. Blandford & Rees, 1978).
The current scenario for modeling such blazars involves plasma blobs or shocked regions filled with charged particles confined within a relativistic jet. The -ray photons are generated by inverse-Compton (IC) scattering of low-energy photons off a population of relativistic electrons and positrons. The primary accelerated particles are still unknown: they can be either leptons of a pair-plasma (e.g. Maraschi et al., 1992; Dermer & Schlickeiser, 1993) or protons (e.g. Mannheim & Biermann, 1992). For the leptonic models, the soft target photons can be either self-generated synchrotron photons in the so-called synchrotron self-Comptonization (SSC) process (e.g. Maraschi et al., 1992; Bloom & Marscher, 1996) or these photons can originate external to the jet – i.e. from an accretion disk – in the so-called external Comptonization (EC) process. The EC models can be subdivided according to the origin of the soft photons, into whether the soft photons travel directly from the accretion disk into the jet (e.g. Dermer et al., 1992; Dermer & Schlickeiser, 1993), or whether the soft accretion disk photons are first scattered by the broad-line region, and hence have an isotropic distribution (e.g. Sikora et al., 1994). Because all mentioned processes are physically valid, it is reasonable to consider that they all contribute, however with different weights (e.g. Böttcher & Dermer, 1998). For example, Böttcher & Collmar (1998) have first applied such a modeling to explain the spectral variability of the -ray blazar PKS 0528+134. They argued that the SSC component dominates during -ray low states while the EC emission dominates in the flaring periods. Recently, it was applied to model the multifrequency emission of the blazar 3C 279 by Hartman et al. (2001).
PKS 1622-297 fits into the above mentioned scenario. During the 5-week flaring state, it showed a variable flux at EGRET energies. On top of that EGRET detected a short huge flare, showing a rapid flux increase by a factor of 4 in less than 7 hours and a corresponding isotropic -ray luminosity of 2.91049 erg s-1 (Mattox et al., 1997). Both facts strongly argue for Doppler boosted emission. Mattox et al. (1997), assuming a co-spatial production of X-rays and -rays, derived an optical depth for - absorption of = 330 at 1 GeV. Subsequently, the Doppler factor for the bulk motion in the jet then has to be larger than 8.1. COMPTEL finds enhanced MeV emission during that period, however with the trend of a time delay (see Sect. 4.2). The MeV photons may come later than the higher energy photons due to cooling effects in the relativistic plasma. The relativistic electrons can loose their energy via synchrotron or inverse Compton radiation with a loss rate of , where is the Lorentz factor of a given electron. The characteristic electron life time is and, in terms of energy E (E ) for the produced -ray photon, is E-1/2 (e.g. Kazanas et al., 1998). This illustrates that the life time of relativistic electrons decreases through a cooling process of producing higher energies -ray photons, while the electron population could stay longer by producing lower energies -ray photons. Therefore, a time delay of the low-energy -ray photons seems possible from such a simple scenario of energy-dependent cooling times for a relativistic electron jet. Numerical calculations show, however, that the case of time lags between different energy bands is more complicated. Dermer et al. (1999) studied the behavior of blazar flares on their time-dependent lags by assuming that a nonthermal plasma is injected over a finite time interval in the comoving frame and cools by synchrotron and SSC radiation. They argued that the SSC radiation will dominate the cooling process if the total energy injected in the nonthermal electrons is very high. Their numerical results show little time lags between the MeV and GeV light curves in the case of a SSC-dominated cooling process. Sikora et al. (2001) assumed that the EC process dominates the high energy -ray emission during a flare, and consequently took additionally the EC process as cooling mechanism into account. They considered the -ray flare event in two parts: 1) radiative flares caused by a radiative cooling process like EC emission, and 2) adiabatic X-ray and soft -ray flares generated via adiabatic energy losses of a low-energy electron/positron population in the jet. Since adiabatic flares decay much slower than the radiative ones, the MeV light curve should lag the GeV one. Time lags of several days should occur between the two energy bands according to their numerical simulations. Our study on the pre-flare, on-flare and post-flare parts of VP 423 provides, for the first time some evidence – though with marginal statistical significance – for a possible time delay of a few days between the MeV and 100 MeV photons. The delay time is consistent with the expected cooling times in Sikora et al. (2001).
We observe a ’hard’ MeV spectrum of PKS 1622-297 during the flare state, which indicates that the COMPTEL band is still on the rising part of the IC emission. The combined COMPTEL/EGRET spectrum reveals a spectral break indicating that for the flaring state the IC emission peaks on average around 16 MeV. The spectral break is larger than 0.5 in index which cannot be explained by single-component emission models like SSC and one-component, time-integrated EC models. If compared to the -ray quiescent state, a flux increase could be proven only for the high-energy part of the COMPTEL band. This might indicate that the -ray flare is mainly a high-energy -ray phenomenon. This -ray behaviour resembles the one of PKS 0528+134 (Collmar et al., 1997a), which during -ray flaring episodes showed a spectral break at MeV energies and a power-law shape during -ray quiescent states. This was interpreted as evidence for an additional spectral component showing up during -ray flaring periods. Subsequently the -ray spectrum of PKS 0528+134 was modeled by a multi-component scenario consisting of a broad SSC and a narrow EC components (Böttcher & Collmar, 1998; Mukherjee et al., 1999). Very recently such a multi-component model was successfully applied to multi-epoch multi-frequency data of the -ray blazar 3C 279 (Hartman et al., 2001), which is a similar source as PKS 1622-297. Due to the similarity of the -ray behaviour of PKS 1622-297 in the flaring state, we shall interpret our measurements also in such a multi-component scenario: a combination of SSC and EC processes. The measured -ray spectrum from 50 keV to 10 GeV for VP 423.5, the only one in which OSSE contributed, provides tentative support for such a multi-component scenario. The extrapolation of the best-fit OSSE slope significantly underestimates the MeV fluxes, indicating such an additional component at MeV energies. A spectral upturn somewhere between 0.5 and 10 MeV is suggested by Fig. 7. This agrees well with the model fits on PKS 0528+134 and 3C 279, which provide a transition from an SSC dominated spectral part to an EC dominated one at roughly 0.5 MeV (Mukherjee et al., 1999; Hartman et al., 2001). However, this indication is not statistically forcing, because the OSSE slope (: 2.00.2, Mattox et al., 1997) is consistent within error bars with the power-law fit to all data (: 1.840.02; Fig. 7; Tab. 3).
The SSC and the EC emission processes have different dependencies on the Doppler factor D = ((1-cos))-1 of the jet, where = (1-)-1/2 is the bulk Lorentz factor of the relativistic jet plasma, the bulk velocity in units of the speed of light, the angle between the direction of motion of jet and the line of sight. According to Dermer et al. (1997), the EC component has a stronger dependence () on the Doppler factor than the SSC component () and dominates at higher (e.g. MeV) energies (e.g. Böttcher & Collmar, 1998). The parameter is the spectral index of the initial particle distribution function. For example, if we take 3 as is generally assumed by Böttcher & Collmar (1998) in their modeling of the -ray emission of PKS 0528+134, then the dependence of the two components on Doppler factor differs by a factor of D2. By taking D 8.1 as was estimated by Mattox et al. (1997) for the short huge flare, the difference could be 66. Therefore large flux changes can be more efficiently promoted by an EC component, which - in the assumed SSC and EC multi-component scenario - makes the huge -ray flare at energies 10 MeV during VP 423 likely to be an EC emission event. This interpretation is supported by the fact, that COMPTEL detects the flare only above 10 MeV, which indicates a sharply rising MeV spectrum.
6 Summary
A complete study of PKS 1622-297 using 6 years of COMPTEL data is reported in this paper. PKS 1622-297 is detected by COMPTEL in its 10-30 MeV band as an MeV emitter at a significance level of 5.9 during a 5-week -ray flaring period in 1995. No evidence for the source is found in the rest of the observations. Comparing the average flux of the flaring state to the one of the quiescent state provides a flux increase by a factor of at least 4 at the upper COMPTEL energies. During the -ray high state, the 5-week average MeV spectrum shows a hard shape and a spectral break is indicated by comparing the MeV spectrum to the EGRET one at energies above 30 MeV. The spectral break in the simultaneous COMPTEL/EGRET spectra suggests that the peak of the IC emission is around 16 MeV. In this respect PKS 1622-297 is similar to PKS 0528+134 and the same emission scenario might be at work. A model with two components, SSC and EC, can in principle explain the observed -ray behaviour.
On top of the 5-week -ray activity, EGRET observed a huge short (1 day) flare. COMPTEL also detects this event in its uppermost (10-30 MeV) band. The 10-30 MeV light curve shows that the MeV emission is still high, when the EGRET flux above 100 MeV has already ceased, suggesting a time delay between the 2 bands, which however is at a marginal significance level. Modelling -ray flare events by assuming that the EC process dominates can provide time lags of several days (Sikora et al., 2001) in agreement with the indications found in our analysis of PKS 1622-297.
Acknowledgements.
This research was supported by the German government through DLR grant 50 QV 9096 8, by NASA under contract NAS5-26645, and by the Netherlands Organization for Scientific Research NWO. The authors would like to thank the anonymous referee for his/her helpful comments.References
- Blandford & Rees (1978) Blandford, R. D., & Rees, M. J. 1978, in Pittsburgh Conference on BL Lac Objects, A. M. Wolfe, Univ. Pittsburgh Press, 328
- Bloemen et al. (1995) Bloemen, H., Bennett, K., Blom, J. J., et al. 1995, A&A, 293, L1
- Bloemen et al. (1994) Bloemen, H., Hermsen, W., Swanenburg, B. N., et al. 1994, ApJS, 92, 419
- Blom et al. (1995a) Blom, J. J., Bloemen, H., Bennett, K., et al. 1995a, A&A, 295, 330
- Blom et al. (1995b) Blom, J. J., Bloemen, H., Bennett, K., et al. 1995b, A&A, 298, L33
- Bloom & Marscher (1996) Bloom, S. D., & Marscher, A. P. 1996, ApJ, 461, 657
- de Boer et al. (1992) de Boer, H., Bennett, K., Bloemen, H., et al. 1992, in Data Analysis in Astronomy IV, eds. V. Di Gesù, L. Scarsi, R. Buccheri, et al., (New York: plenum Press), 241
- Bonnell et al. (1995) Bonnell, J. T., Shrader, C. R., Hartman, R. C., et al. 1995, IAU circular 6186
- Böttcher & Dermer (1998) Böttcher, M., & Dermer, C. D. 1998, ApJ, 501, L51
- Böttcher & Collmar (1998) Böttcher, M., & Collmar, W. 1998, A&A, 329, 57
- Collmar et al. (1997a) Collmar, W., Bennett, K., Bloemen, H., et al. 1997a, A&A, 328, 33
- Collmar et al. (1997b) Collmar, W., Bennett, K., Bloemen, H., et al. 1997b, in Proceedings of the Fourth Compton Symposium, eds. C. D. Dermer, M. S. Strickman, J. D. Kurfess (New York: AIP Conf. Proc. 410), 1341
- Collmar et al. (2000) Collmar, W., Reimer, O., Bennett, K., et al. 2000, A&A, 354, 513
- Collmar et al. (2001) Collmar, W., Schönfelder, V., Zhang, S., et al. 2001, in Proceedings of the -Ray Astrophysics 2001, eds. S. Ritz, N. Gehrels, C. R. Shrader (New York: AIP Conf. Proc. 587), 271
- Dermer et al. (1997) Dermer, C. D., Sturner, S. J., & Schlickeiser, R. 1997, ApJS, 109, 103
- Dermer et al. (1992) Dermer, C. D., Schlickeiser, R., & Mastichiadis, A. 1992, A&A, 256, L27
- Dermer & Schlickeiser (1993) Dermer, C. D., & Schlickeiser, R. 1993, ApJ, 416, 458
- Dermer et al. (1999) Dermer, C. D., Li, H., & Chiang, J. 1999, Astro. Lett. and Communications, 39, 1
- Hartman et al. (1999) Hartman, R. C., Bertsch, D. L., Bloom, S. D., et al. 1999, ApJS, 123, 79
- Hartman et al. (2001) Hartman, R. C., Böttcher, M., Aldering, G., et al. 2001, ApJ, 553, 683
- Hermsen et al. (1993) Hermsen, W., Aarts, H. J. M., Bennett, K., et al. 1993, A&AS, 97, 97
- Impey & Tapia (1990) Impey, C. D., & Tapia, S. 1990, ApJ, 354, 124
- Kazanas et al. (1998) Kazanas, D., Titarchuk, L. G., & Hua, X. M. 1998, ApJ, 493, 708
- Kühr et al. (1981) Kühr, H., Witzel, A., Pauliny-Toth, I. I. K., & Nauber, A. 1981, A&AS, 45, 367
- Kurfess et al. (1995) Kurfess, J. D., Grove, J. E., McNaron-Brown, K., et al. 1995, IAU circular 6185
- Lampton et al. (1976) Lampton, M., Margon, B., & Bowyer, S. 1976, ApJ, 208, 177
- Mannheim & Biermann (1992) Mannheim, K., & Biermann, P. L. 1992, A&A, 253, L21
- Maraschi et al. (1992) Maraschi, L., Ghisellini, G., & Celotti, A. 1992, ApJ, 397, L5
- Mattox et al. (1997) Mattox, J. R., Wagner, S. J., Malkan, M., et al. 1997, ApJ, 476, 692
- Mukherjee et al. (1997) Mukherjee, R., Bertsch, D. L., Bloom, S. D., et al. 1997, ApJ, 490, 116
- Mukherjee et al. (1999) Mukherjee, R., Böttcher, M., Hartman, R. C., et al. 1999, ApJ, 527, 132
- Reich et al. (1998) Reich, W., Reich, P., Pohl, M., Kothes, R., & Schlickeiser, R. 1998, A&AS, 131, 11
- Saikia et al. (1987) Saikia, D. J., Ashok, K. S., & Cornwall, T. T. 1987, MNRAS, 224, 379
- Schönfelder et al. (1993) Schönfelder, V., Aarts, H., Bennett, K., et al. 1993, ApJS, 86, 657
- Sikora et al. (1994) Sikora, M., Begelman, M. C., & Rees, M. J. 1994, ApJ, 421, 153
- Sikora et al. (2001) Sikora, M., Blazejowski, M., Madejski, G., & Moderski R. 2001, in Proceedings of the 4th Integral Workshop, eds. A. Gimenez, V. Reglero, C. Winkler (ESA SP-459), 259
- Steppe et al. (1993) Steppe, H., Paubert, G., Sievers, A., et al. 1993, A&AS, 102, 611
- Torres & Wroblewski (1984) Torres, C., & Wroblewski, H. 1984, A&A, 141,271; and erratum, A&A, 160, 406
- Williams et al. (1995) Williams, O. R., Bennett, K., Bloemen, H., et al. 1995, A&A, 298, 33
- Wright & Otrupcek (1990) Wright, A., & Otrupcek, R. 1990, PKSCTA90 catalog