Optical observations of the supernova remnant G 69.4+1.2
We performed deep optical observations of the area of the new supernova remnant G 69.4+1.2 in the emission lines of O iii, HN ii and S ii. The low ionization images reveal diffuse and filamentary emission in the central and south, south–west areas of our field. Estimates of the S ii/H ratio suggest that the detected emission in these areas originates from shock heated gas, while the strong extended source in the north must be an H ii region. The medium ionization image of O iii shows a single filament close to the field center. Emission from O iii is not detected elsewhere in the field but only in the north from LBN 069.96+01.35. Deep long–slit spectra taken at the position of the O iii filament suggest shock velocities 120 km s-1, while in other areas velocities around 50 km s-1 are expected. The sulfur lines ratio indicates electron densities less than 120 cm-3. The absolute H flux is 5 erg s-1 cm-2 arcsec-2. The optical emission is very well correlated with the radio emission, especially in the south west. The soft X–ray emission detected in the ROSAT All-Sky survey shows a satisfactory degree of correlation with the optical data in the south–west suggesting their association.
Key Words.:
ISM: general – ISM: supernova remnants – ISM: individual objects: G 69.4+1.21 Introduction
Most of the known supernova remnants have been discovered during radio surveys through their non–thermal synchrotron emission. A few remnants have been discovered by their optical or X–ray emission. The detection of X–ray emission in the direction of G 69.7+1.0 was reported by Asaoka et al. (asa96 (1996)). They found a 3° long arc in the east–west direction in the ROSAT All–Sky survey extending for 0°.8 in the south–north direction. The arc is convex to the north, its west end reaches the area of CTB~80, while the maximum surface brightness is found close to its south central areas. The Wolf-Rayet star WR 132 is found at a close angular distance but it is not expected to contribute to the morphology and energetics of the X–ray arc. WR 132 is considered to be at a distance of 4.4 kpc (Miller and Chu mil93 (1993)), much further than the estimated distance of 1 kpc to the arc (Asaoka et al. asa96 (1996), Lu & Aschenbach lu01 (2001)). Yoshita et al. (yos00 (2000)) observed the area adjacent to G 69.7+1.0 using the ROSAT and ASCA satellites. They detected diffuse thermal X–ray radiation with an average temperature of 0.42 keV attenuated by a neutral hydrogen column density of 1.6 1021 cm-2. This diffuse structure extends for 1° in the east–west direction and was designated as AX~J2001+3235 or G 69.4+1.2. Yoshida et al. (yos00 (2000)) proposed that the incomplete shells in radio and optical wavelengths around the X–ray emission are associated to the remnant. The source AX J2001+3235 is actually the central part of the extended arc reported by Asaoka et al. (asa96 (1996)). Lu & Aschenbach (lu01 (2001)) fit the ROSAT pointed data with a two temperature Raymond–Smith model and obtained a neutral hydrogen density of 1.3 1021 cm-2 and temperatures of 0.24 keV and 1.17 keV. They proposed that the whole 3° long X–ray arc is G 69.4+1.2. Radio emission at 4850 MHz (Condon et al. con94 (1994)) seems correlated with the X–ray emission, although its nature (thermal or non–thermal) is not clear yet since radio spectral data are not available.
In order to improve our knowledge on this new supernova remnant and check whether the large optical shell is related to the X–ray emission we performed deep optical observations of the area around G 69.7+1.0 in major optical emission lines. Information about the observations and the data reduction is given in Sect. 2. In Sect. 3 and 4 we present the results of our imaging observations and the results from the long–slit spectra. Finally, in Sect. 5 we discuss the physical properties of the remnant.
2 Observations
2.1 Optical images
The observations presented in this paper were performed with the 0.3 m Schmidt Cassegrain telescope at Skinakas Observatory. The field of G 69.4+1.2 was observed in August 20 and 21, 2001. The observations were performed with a 1024 1024 Tektronix CCD which had a pixel size of 19 m resulting in a 70′ 70′ field of view and an image scale of 4″ per pixel. A journal of the observations including exposure times and filter characteristics are given in Table 1. The appropriate continua, also listed in Table 1, were subtracted from the low and medium ionization images. The final images in each filter are the average of the individual frames where appropriate, while the astrometric calculations utilized the HST Guide star catalogue. Two uncalibrated images in HN ii and O iii were obtained with the 1.3 m Ritchey–Cretien telescope at Skinakas Observatory and a 1024 1024 SITe CCD. The exposure time of each frame was 1800 sec and the image scale is 0″.5 per pixel. These frames were centered close to the position where the spectra were taken (see § 2.2). All coordinates quoted in this work refer to epoch 2000.
We employed standard IRAF and MIDAS routines for the reduction of the data. Individual frames were bias subtracted and flat-field corrected using well exposed twilight flat-fields. The spectrophotometric standard stars HR5501, HR7596, HR7950, HR9087 and HR718 (Hamuy et al. ham92 (1992), ham94 (1994)) were used for absolute flux calibration.
2.2 Optical spectra
Long–slit spectra were obtained on July 28, 2001 using the 1.3 m Ritchey–Cretien telescope at Skinakas Observatory. The data were taken with a 1300 line mm-1 grating and a 800 2000 SITe CCD covering the range of 4750 Å – 6815 Å. The slit had a width of 77 and, in all cases, was oriented in the south-north direction. The slit center was located at = 20h01m33s, = 32°43′30″ and two exposures were obtained, each of 3900 sec. The spectrophotometric standard stars HR5501, HR7596, HR7950, HR9087, and HR718 (Hamuy et al. ham92 (1992), ham94 (1994)) were observed in order to calibrate the spectra.
| FWHM | ||||||
| Filter | (Å) | (Å) | Telescope | Date (UT) | Framesa | Exposureb (s) |
| HN ii | 6560 | 75 | 0.3 m | 20–21 Aug., 2001 | 2 | 4800 |
| S ii | 6708 | 20 | 0.3 m | 20 Aug., 2001 | 2 | 4800 |
| O iii | 5005 | 28 | 0.3 m | 21 Aug., 2001 | 3 | 7200 |
| Cont red | 6096 | 134 | 0.3 m | 20–21 Aug., 2001 | 8 | 1440 |
| Cont blue | 5470 | 230 | 0.3 m | 21 Aug., 2001 | 4 | 720 |
| HN ii | 6570 | 75 | 1.3 m | 11 Aug., 2001 | 1 | 1800 |
| O iii | 5014 | 28 | 1.3 m | 11 Aug., 2001 | 1 | 1800 |
a Number of individual frames
b Total exposure times in sec
3 Imaging of G 69.4+1.2
3.1 The HN ii and S ii line images
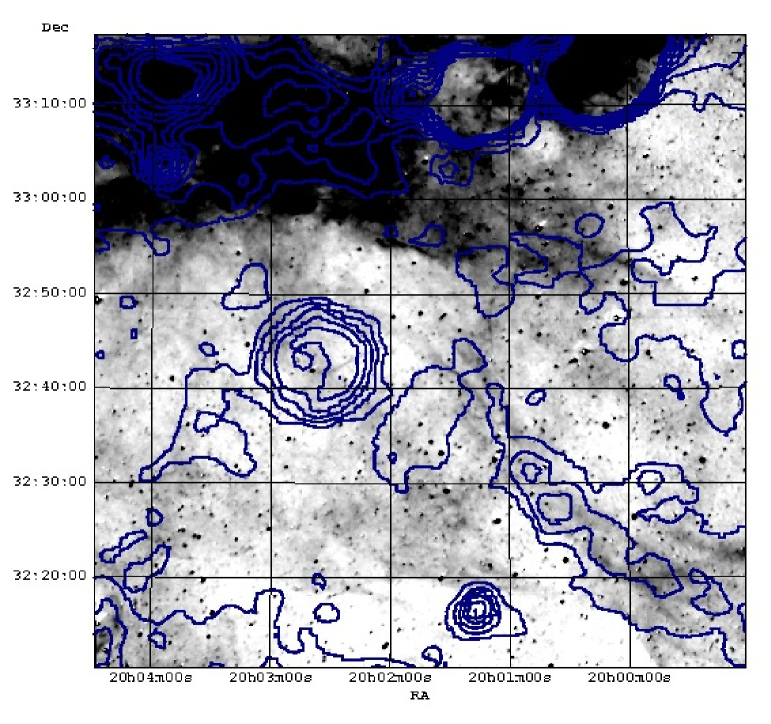
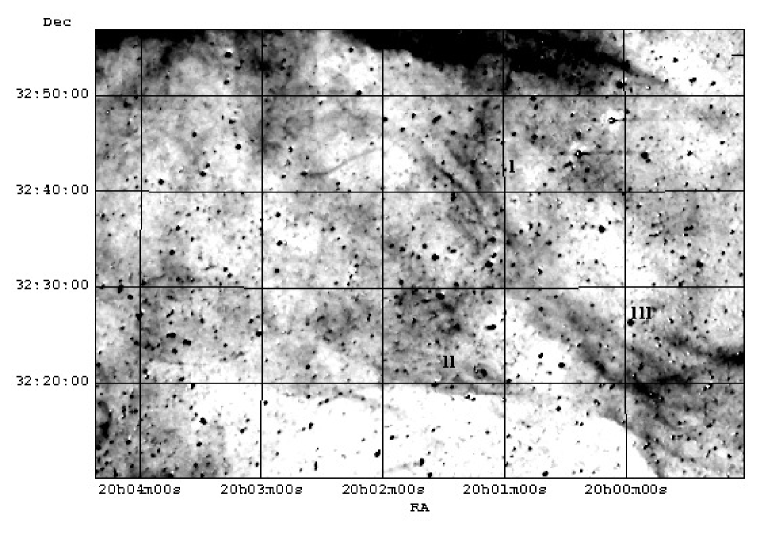
Our field (Fig. 1) includes the known supernova remnant G 69.7+1.0 as well as the strong and extended H ii region LBN 069.96+01.35 (Lynds lyn65 (1965)). We detect diffuse emission and a filamentary structure at the area where G 69.7+1.0 lies, however, it is not clear if this emission is associated with this remnant or G 69.4+1.2. More emission line structures are detected in the south areas of our field. The pulsar PSR 2002+3217 is within the field of view but no emission is detected from this source. In Fig. 1 we also show the radio emission at 4850 MHz (Condon et al. con94 (1994)) in contours scaling linearly from 1.2 10-4 Jy/beam to 9 10-2 Jy/beam. The radio data were retrieved from SkyView maintained by NASA/HEASARC. The HN ii image shows filamentary emission extending from the field center to the south west. Two filaments running parallel for 15′ are present around 20h01m and 32°40′. In addition, more emission features are found to the south between 32°20′ and 32°30′. The same morphological characteristics observed in the HN ii image are also seen in the S ii image (Fig. 2). However, some differences do exist among the two images. The east one of the two filaments ( 20h01m15s, 32°40′) mentioned above does not appear continuous in the S ii image but gaps in intensity along the filament are seen. The emission measured in the S ii image itself is quite strong relative to the HN ii emission. In Table 2, we list typical fluxes measured in several locations (areas I, II, III in Fig. 2) within the field of G 69.4+1.2 including the H ii region LBN 069.96+01.35 (LBN 159). The N ii6548, 6584 Å lines and the H line contribute equally in the HN ii filter and the corresponding fluxes in Table 2 include all these lines. However, the sulfur lines at 6716 Å and 6731 Å are not transmitted equally in the S ii filter because its bandpass is narrower than that of the HN ii filter. Thus, the sulfur fluxes quoted in Table 2 include 100% of the 6716 Å line and 18% of the 6731 Å line. Since the images are flux calibrated, the HN ii and S ii frames can be used to study the nature of the detected emission. We estimate S ii/H values of 0.9 in the south, south–west suggesting emission from shock heated gas, while in several locations of LBN 069.96+01.35 we estimate values of 0.4 indicating H ii emission. In order to obtain these quantitative estimates we proceeded as follows. Since our S ii filter does not measure the total sulfur flux we assumed a ratio of I(6716 Å)/I(6731 Å) of 1.4, appropriate for evolved remnants, and the filter transmissivities (100% at 6716 Å and 18% at 6731 Å) to estimate the total sulfur flux. In addition, we assumed that the H flux is typically 90% or greater of the N ii6548, 6584 Å flux for evolved remnants while for H ii regions this percentage is less than 50%–60%. Under these assumptions we estimate that S ii/H 2.7([S ii/HN ii)observed.
| Area I | Area II | Area III | LBN 159 | |
|---|---|---|---|---|
| HN ii | 40 | 30 | 40 | 90 |
| S ii | 12 | 14 | 16 | 20 |
| O iii | 7 | – | – | 10 |
Fluxes are median values over several 40″
40″
boxes as measured in the corresponding filters
and in units of erg s-1 cm-2 arcsec-2
See §3.1 for more details
3.2 The O iii image
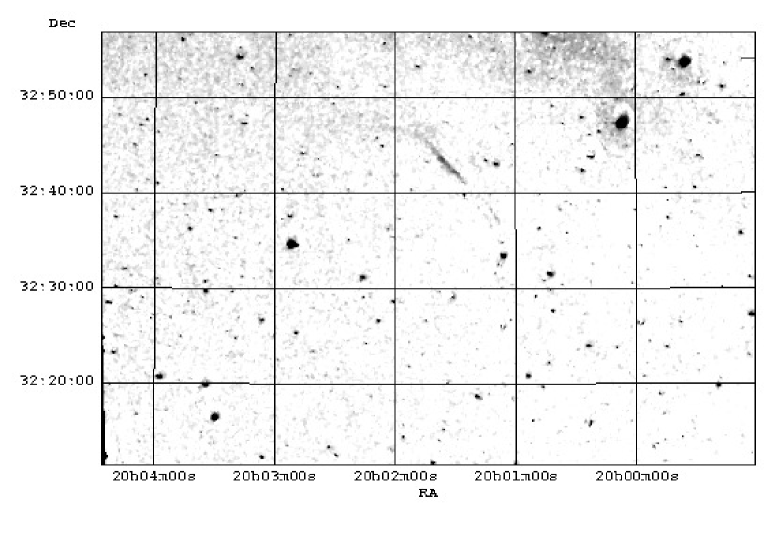
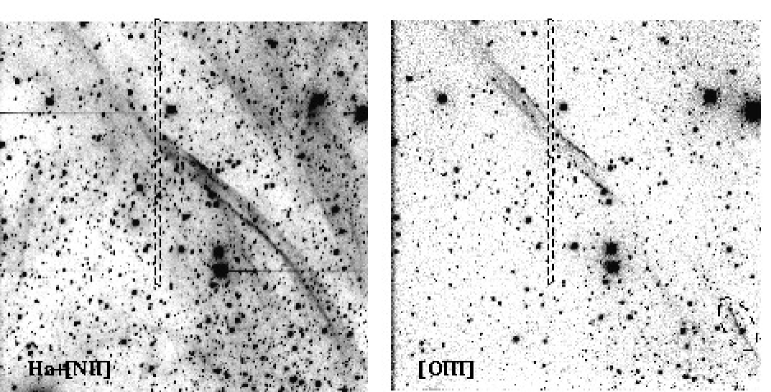
The morphology of the medium ionization line of O iii (Fig. 3) is markedly different from that seen in the HN ii and S ii images. Typical fluxes measured in the O iii calibrated image are also given in Table 2. A filament is detected close to the field center around at 20h01m33s and 32°43′30″. This filament is not continuous over its full extent but there is a gap of 4′. This probably reflects inhomogeneities in the interstellar “clouds” resulting in strong variations of the shock velocity upon which the O iii flux depends crucially (Cox & Raymond cox85 (1985)). An 8′.5 8′.5 square area has been imaged in better angular resolution (0″.5 per pixel) with the 1.3 m telescope through the HN ii and O iii interference filters (Fig. 4). The arrows in Fig. 4 indicate the location of the slit center. A wider field was observed by Miller and Chu (mil93 (1993)) during their study of the nearby Wolf-Rayet star WR 132. Our images show very narrow filamentary structures as well as diffuse emission. The HN ii image shows a 1′ wide lane free of emission to the west of the observed filament but across this gap diffuse emission is present. The projected angular width of the filament seen in the low ionization image is 16″, while the width of the filament seen in the medium ionization line of O iii is only 5″. At the very south–west edge of the high resolution image O iii filamentary emission is again detected (see also Fig. 3). This emission is enclosed by the dashed ellipse in Fig. 4. The failure to detect O iii emission where the HN ii emission is strong suggests that these lines are anti-correlated. No O iii emission is detected in other areas of the remnant, including those areas where diffuse or filamentary HN ii or S ii emission is observed.
4 The long–slit spectra from G 69.4+1.2
The deep low resolution spectra were taken at the location of the bright O iii filament. As is evident from Fig. 4 the corresponding H emission is expected to be weaker. The spectra clearly demonstrate the fact that the observed emission must originate from shock heated gas (Table 3). Note that the fluxes quoted in Table 3 are expected to differ from those given in Table 2 since the latter are averages over a sufficient number of pixels at different locations around the field observed, while the former refer to the very restricted position of the slit. Note also that the slit was placed at the position of bright O iii emission and not H emission. The H emission at the slit location is much weaker than at neighbour positions as is evident from Fig. 4. The ratio of the sulfur lines approaches the low density limit indicating low electron densities (e.g. Osterbrock ost89 (1989)). However, given the errors on the individual sulfur fluxes, we estimate that electron densities less than 120 cm-3 (1) or 200 cm-3 (2) are allowed. The spectra display strong O iii emission relative to H suggesting shock velocities greater than 100 km s-1 (Cox & Raymond cox85 (1985), Hartigan et al. har87 (1987)). We note here that the signal to noise ratios quoted in Table 3 do not include calibration errors which are 10%.
5 Discussion
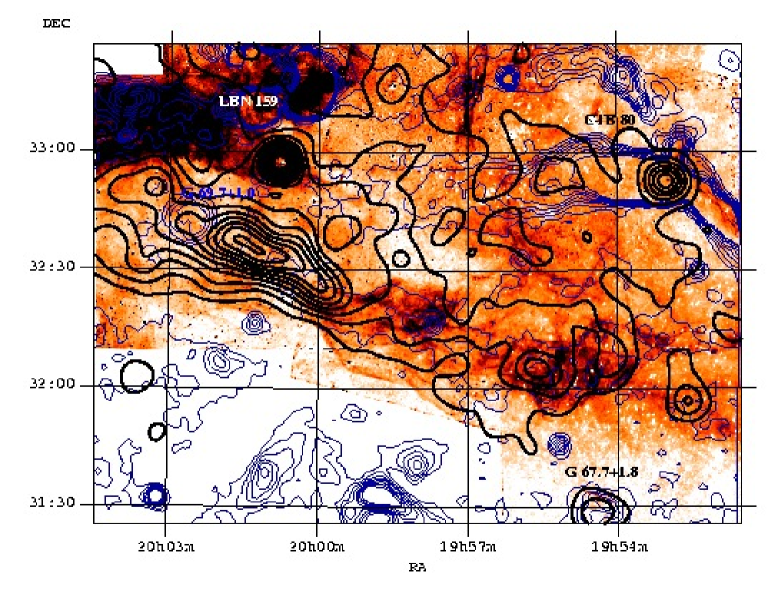
We performed the first deep optical observations of the immediate vicinity of the new supernova remnant G 69.4+1.2 in major emission lines. The CCD images obtained reveal diffuse and filamentary emission, in the low ionization lines, in the south, south–west areas. The survey of Parker et al. (par79 (1979)) was examined but we were not able to identify the structures that we have detected in this work. This is probably due to the lower resolution and sensitivity of this survey. The supernova remnant G 69.7+1.0 lies within our field but we did not find any strong evidence to claim the detection of optical emission from this remnant. The flux calibrated images allow us to conclude that the bright extended source LBN 069.96+01.35 is an H ii region, while the structures detected in the central and south areas of our field result from emission of shock heated gas since their S ii emission is strong relative to H. Note here that LBN 069.96+01.35 is found in the north part of the large optical shell reported by Yoshida et al. (yos00 (2000)) to be associated with the X–ray emission. In order to understand better the properties of G 69.4+1.2 we combined published data on G 67.7+1.8 and CTB 80 (Mavromatakis et al. 2001a , 2001b ) with the current data to create a 2°.8 1°.8 mosaic in HN ii (Fig. 5) . In this figure we overlaid the 4850 MHz radio data (thin contours; Condon et al. con94 (1994)) as well as public ROSAT All–Sky survey data (thick contours; see also Lu & Aschenbach lu01 (2001)). It is clear from the wide–field optical image that the filamentary structures detected in the south–west (Figs. 1, 2) extend further to the west, up to 19h54m. The radio emission, although weak, is very well correlated with the optical line emission all the way from 19h54m to 20h01m (Figs. 1, 5). Even though good quality radio data at other wavelengths are not available, the nature of the radio emission is probably non–thermal given the strong sulfur line emission seen in the optical data. Thus, we propose that the detected line emission is the optical counterpart of the radio emission seen at 4850 MHz. The question that naturally arises is whether the optical or radio emission is related to the soft X–ray emission. Clearly, the possibility that they are not related and simply overlap cannot be excluded. In this case we would have to propose the detection of a candidate remnant, different from G 69.4+1.2, based on our observational evidence. However, the nature of the optical emission and possibly that of the radio, the common orientation of the observed emission (south–west to north–east) and the fact that the outer soft X–ray contours roughly trace the south boundaries of the optical and radio emission would favor the association of the optical radiation with the emission detected in the ROSAT All–Sky survey.
The image in the medium ionization line of O iii shows a filament close to the field center, while no other O iii emission is detected except from the H ii region. We note that this remnant belongs to the class of remnants which show prominent O iii emission only in a specific portion of their emission like CTB 1 (Fesen et al. fes97 (1997)), CTB 80, G 114.3+0.3 (Mavromatakis et al. 2001b , mav02 (2002)) and G 17.4-2.3 (Boumis et al. bou02 (2002)). The failure to detect O iii line emission in several locations suggests that the velocity of the shock propagating into the interstellar “clouds” is less than 100 km s-1, while the detection of strong O iii emission relative to H at a specific position implies shock velocities in excess of 120 km s-1 (Hartigan et al. har87 (1987)) assuming complete recombination zones. The relation
| (1) |
given by Fesen & Kirshner (fes80 (1980)) can be used to limit the preshock cloud density nc. The electron density derived from the sulfur line ratio is denoted by and Vs,100 is the shock velocity into the clouds in units of 100 km s-1. This relation allows us to set an upper limit on the preshock cloud density of 2 cm-3. Here we assumed a shock velocity of 120 km s-1 and made use of the upper limit of 120 cm-3 on the electron density (Table 3). However, the relatively high O iii to H ratio in connection with the different morphologies seen in Fig. 4 could suggest that incomplete recombination zones are present in that area. Adopting the calculations of Raymond et al. (ray88 (1988)), a distance of 1 kpc (Asaoka et al. asa96 (1996), Lu & Aschenbach lu01 (2001)) and an edge–on geometry, we estimate an average filament density of 4 cm-3. We note here that in this case a shock velocity of 80 km s-1 would be sufficient to produce the strong O iii emission. However, it is not clear if this velocity could also produce the prominent sulfur emission seen in the images.
We estimate from the flux calibrated images that the total sulfur emission at 6716 Å and 6731 Å is comparable in strength to the total nitrogen emission at 6548 Å and 6584 Å. In addition, emission from O iii is practically absent since it is only present in a very limited area compared to the field observed (Fig. 3). Examination of shock models with full recombination zones shows that these conditions are satisfied only for low shock velocities around 40–60 km s-1 (Hartigan et al. har87 (1987)). Clearly, such velocities can account for the gross absence of the O iii emission. In order to obtain more quantitative estimates we will also use the relation
| (2) |
given by McKee & Cowie (mck75 (1975)). The factor is of the order of 1–2, is the explosion energy in units of 1051 erg, and rs the radius of the remnant in pc. Assuming rs = 28 (Lu & Aschenbach lu01 (2001)), Vs,100 0.5, nc 1 and 1, we estimate an explosion energy of 0.1 which is not far from the value of 0.5 given by Lu & Aschenbach (lu01 (2001)) considering the estimates of the physical quantities and the assumptions made in the equations involved. Furthermore, we can check if pressure equilibrium exists between the cloud and intercloud regions. Using as before the same values for the shock velocity and precloud density and a velocity of the main shock front of 700 km s-1 (Lu & Aschenbach lu01 (2001)), we calculate an intercloud density of 0.01 cm-3. This value is very close to that of 0.02 cm-3 given by Lu & Aschenbach (lu01 (2001)) based on the Sedov–Taylor solution of the X–ray data. These simple calculations show that the optical data are compatible with basic supernova remnant parameters derived from the X–ray data. Nevertheless, new X–ray observations are needed with a better spatial resolution in order to perform a detailed comparison with the optical and radio data. Radio observations are also needed to determine the actual nature of the radio emission in the south, south–west as well as in the north.
6 Conclusions
The area around the new supernova remnant G 69.4+1.2 was observed in major optical lines. New diffuse and filamentary structures were detected in the south, south–west. The flux calibrated images suggest that the majority of the structures result from emission of shock heated gas. Variations in the shock velocity are also observed, while the long–slit spectra taken at the position of prominent O iii emission suggest low electron densities. The optical data seem correlated with the radio data at 4850 MHz and there is also good agreement with the X–ray data although the spatial resolutions are quite different. It is very likely that the optical emission is related to the radio emission and to the extended X–ray arc.
Acknowledgements.
We would like to thank the referee F. Winkler for his comments which helped to clarify the scope of this paper. We would also like to thank B. Aschenbach for providing us a preprint on G 69.4+1.2 (Lu & Aschenbach lu01 (2001)). Skinakas Observatory is a collaborative project of the University of Crete, the Foundation for Research and Technology-Hellas and the Max-Planck-Institut für Extraterrestrische Physik. This research has made use of data obtained through the High Energy Astrophysics Science Archive Research Center Online Service, provided by the NASA/Goddard Space Flight Center.
| Line (Å) | Fa,b |
|---|---|
| 4861 H | 13 (3)c |
| 4959 O iii | 29 (7) |
| 5007 O iii | 106 (23) |
| 6548 N ii | 47 (21) |
| 6563 H | 100 (41) |
| 6584 N ii | 151 (50) |
| 6716 S ii | 98 (34) |
| 6731 S ii | 72 (27) |
| Absolute H fluxd | 5.3 (10) |
| H/H | 7.8 (3) |
| S ii/H | 1.7 (30) |
| F(6716)/F(6731) | 1.4 (21) |
a Uncorrected for interstellar extinction
b Listed fluxes are a signal to noise weighted
average of the individual fluxes
c Numbers in parentheses represent the signal to noise ratio
of the quoted fluxes
d In units of erg s-1 cm-2 arcsec-2
All fluxes normalized to F(H)=100
References
- (1) Asaoka I, Egger, R. and Aschenbach B. 1996, MPE report 263, eds. Zimmermann H. U., Trümper J. E. and Yorke H., p. 233
- (2) Boumis P., Mavromatakis F., Paleologou E.V. 2002, A&A, in press
- (3) Condon J. J., Broderick J. J., Seielstad G. A., Douglas K., Gregory P. C. 1994, AJ 107, 1829
- (4) Cox D. P., Raymond J. C. 1985, ApJ 298, 651
- (5) Fesen R. A., Kirshner R. P. 1980 ApJ 242, 1023
- (6) Fesen R. A., Winkler P.F., Rathore Y., Downes R.A., Wallace D., Tweedy R.W. 1997, AJ 113, 767
- (7) Hamuy M., Walker A. R., Suntzeff N. B., Gigoux P., Heathcote S. R. & Phillips M. M., 1992, PASP, 104, 533
- (8) Hamuy M., Suntzeff N. B., Heathcote S. R., Walker A. R., Gigoux P., Phillips M. M. 1994, PASP 106, 566
- (9) Hartigan P., Raymond J. and Hartmann L. 1987, ApJ 316, 323
- (10) Lu F. J. and Aschenbach B. 2001, to be submitted
- (11) Lynds B. T. 1965, ApJS 12, 163
- (12) Mavromatakis F., Papamastorakis J., Paleologou E. V., and Ventura J. 2000, A&A 353, 371
- (13) Mavromatakis F., Papamastorakis J., Ventura J, Becker W., Paleologou E. V., Schaudel D. 2001a, A&A 370, 265
- (14) Mavromatakis F., Ventura J., Paleologou E. V., Papamastorakis J. 2001b, A&A 371, 300
- (15) Mavromatakis F., Boumis P., Paleologou E. V. 2002, A&A 383, 1011
- (16) Miller G. J. and Chu Y. 1993, ApJS 85, 137
- (17) McKee C. F., Cowie L. 1975, ApJ 195, 715
- (18) Osterbrock D. E. 1989, Astrophysics of gaseous nebulae, W. H. Freeman & Company
- (19) Parker R. A. R., Gull T. R., Kirschner R. P. 1979, An emission–line survey of the Milky Way, NASA SP–434
- (20) Raymond J. C., Hester J. J., Cox. D., Blair W. P., Fesen R. A., Gull T. R. 1988, ApJ 324, 869
- (21) Yoshita K., Miyata E., Tsunemi H. 2000, PASJ 52, 867