Neutral hydrogen in dwarf galaxies
This paper is the second in a series presenting a sample of 29 late-type dwarf galaxies observed with the Westerbork Synthesis Radio Telescope in the 21-cm line of neutral hydrogen (HI). Here we present rotation curves, maps of the velocity field and maps of the velocity dispersion across the sample galaxies.
Key Words.:
Galaxies: irregular dwarf galaxies – HI emission – kinematics1 Introduction.
In this paper we we present the kinematical information extracted from HI maps of the dwarf galaxy sample described by Stil Israel (2002; hereafter Paper I). As neutral atomic hydrogen is one of the most extended observable components of a galaxy, its line emission provides an excellent tool to probe galaxy mass distributions. The dopplershift of a line profile is a direct measure of the projected rotation velocity at the position sampled. Its linewidth is a measure of the macroscopic chaotic motion of the gas and reflects its physical condition. Both rotation and velocity dispersion can be measured out to the edge of the HI distribution, which usually extends far beyond the stellar distribution. In the outer regions, rotational velocities are more or less constant, implying the presence of large amounts of matter even at the largest distances to the center. These rotation velocities are about three times higher than expected if only stars and gas would contribute to the mass; thus the amount of ‘unseen’ or ‘dark’ mass is about an order of magnitude higher than that associated with luminous matter.
| Name | resolution | kinematic center | incl. | fixed/free | PA | scale | ||
| arcsec | degr. | degr. | kpc/′ | |||||
| [1] | [2] | [3] | [4] | [5] | [6] | [7] | [8] | [9] |
| DDO 46 | 13.5 | fixed | 1.4 | |||||
| DDO 47 | 13.5 | fixed | 0.58 | |||||
| 30 | fixed | |||||||
| DDO 48 | 13.5 | free | 4.6 | |||||
| 30 | free | |||||||
| NGC 2537 | 30 | free | 1.9 | |||||
| UGC 4278 | 13.5 | free | 1.9 | |||||
| NGC 2976 | 13.5 | free | 1.0 | |||||
| 30 | free | |||||||
| DDO 83 | 13.5 | free | 2.6 | |||||
| DDO 87 | 30 | free | 1.0 | |||||
| DDO 123 | 13.5 | fixed | 3.3 | |||||
| DDO 133 | 30 | fixed | 1.5 | |||||
| DDO 168 | 30 | free | 1.0 | |||||
| DDO 185 | 30 | free | 2.0 | |||||
| DDO 217 | 30 | free | 2.7 | |||||
Column designations: [1] Object name; [2] resolution of dataset used;
[3] and [4] right ascension and declination (epoch 1950) of kinematic center
and their r.m.s. scatter between radii;
[5] inclination in degrees and its error if it was a free parameter in the fit;
[6] flag indicating whether the inclination was a free parameter;
[7] position angle in degrees and its r.m.s. scatter between radii;
[8] heliocentric systemic velocity in and its r.m.s. scatter between
radii;
[9] radial scale of the rotation curve in kpc/arcmin.
Notes: DDO 168 position angle is mean for radii and ;
DDO 217 position angle is mean for radii larger than arcseconds.
| radius | DDO 46 | DDO 47 | DDO 47 | DDO 48 | DDO 48 | NGC 2537 | UGC 4278 | NGC 2976 | NGC 2976 |
|---|---|---|---|---|---|---|---|---|---|
| ′′ | HR | HR | LR | HR | LR | LR | HR | HR | LR |
| 15 | |||||||||
| 30 | |||||||||
| 45 | |||||||||
| 60 | |||||||||
| 75 | |||||||||
| 90 | |||||||||
| 105 | |||||||||
| 120 | |||||||||
| 135 | |||||||||
| 150 | |||||||||
| 165 | |||||||||
| 180 | |||||||||
| radius | DDO 83 | DDO 87 | DDO 123 | DDO 133 | DDO 168 | DDO 185 | DDO 217 | ||
| ′′ | HR | LR | HR | LR | LR | LR | LR | ||
| 15 | |||||||||
| 30 | 17.61.3 | ||||||||
| 45 | |||||||||
| 60 | 30.00.6 | ||||||||
| 75 | |||||||||
| 90 | 32.30.4 | ||||||||
| 105 | |||||||||
| 120 | 34.41.8 | ||||||||
| 150 | |||||||||
| 180 | |||||||||
| 210 | |||||||||
| 240 |
Note: HR is based on high-resolution (13.5′′) fits; LR is based on low-resolution (30′′) fits.
It is interest to determine the detailed kinematical conditions governing late-type dwarf galaxies. These galaxies are gas-rich, dynamically simple and relatively easy to observe. Their rotation curves trace the distribution of dark matter more directly than those of more massive galaxies, where the mass-to-light ratio of the stellar disk and bulge is a critical parameter. Interestingly, it has been suggested that in some dwarf galaxies, the stellar contribution to the total mass is quite small (Broeils 1992), and that this contribution decreases with decreasing maximum rotation curve velocity (Broeils 1992, Swaters 1999),
2 Velocity field and rotation curve
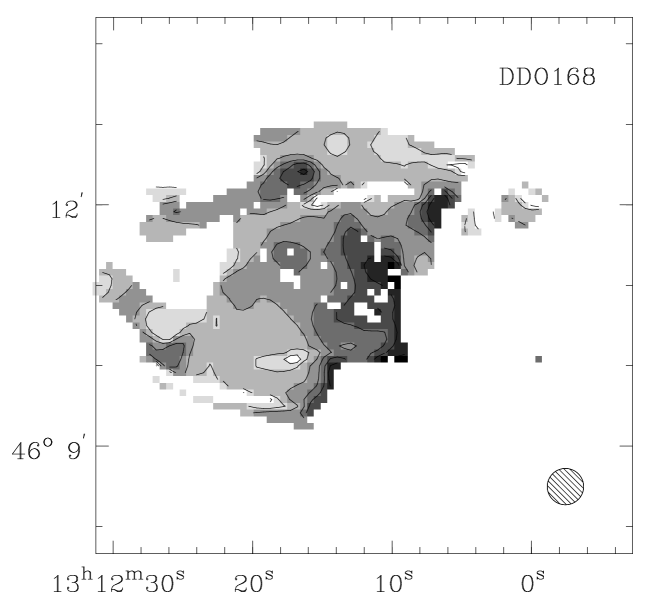
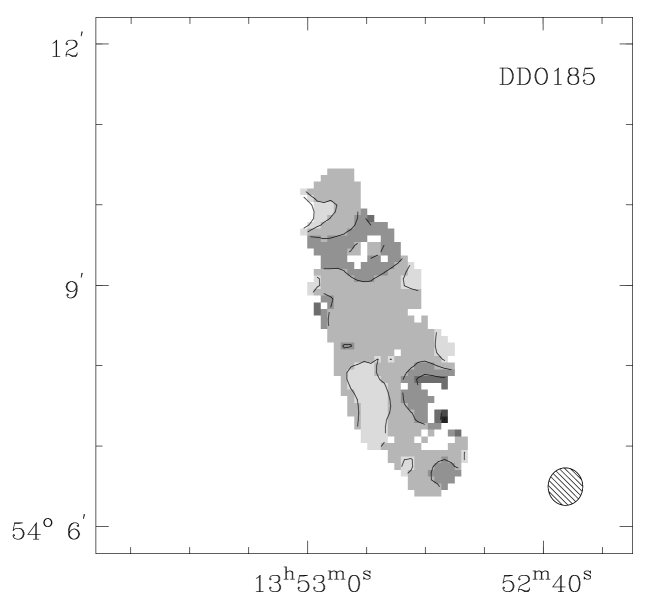
We determined intensity-weighted mean velocities in order to make maximum use of the information contained in spectra with limited signal-to-noise ratios. Noise was further suppressed by only using data from the areas delineated by the cleaning masks (cf. Paper I). The intensity-weighted velocity fields of our galaxy sample are shown in Fig. 4.
We have determined rotation curves by iteratively fitting to the observed velocity field the parameters found with the tilted-ring method (Warner et al. 1973), incorporated in the GIPSY packages as the task ROTCUR (Begeman 1987). Note that the inclination and the location of the kinematic center can be determined only if the rotation curve flattens at the outer radii (i.e. shows the onset of differential rotation). In order to obtain robust solutions, we performed a large number of fits where each parameter was free in 25 to 30 fits, allowing calculation of the r.m.s. scatter of each parameter at all radii. Solution of can also directly be compared to observed major axis position-velocity maps (Sect. 3). Although the product is well-constrained, the separate solutions for and in general are not unique. In particular, at inclination angles , and cannot be fitted independently (Begeman 1987).
Depending on galaxy HI extent and surface brightness, we performed fits on full-resolution () or low-resolution (30′′) data. As a consistency check, we used both low and full resolution data for DDO 47, DDO 48 and NGC 2976. The results are presented in Table 1 and 2. In total, 13 out of 29 galaxies in the sample could so be fitted. For the remainder, a complete analysis was not feasible. There, we required the rotation center to coincide with the HI center of mass which was found to be correct at least for all the objects listed in Tables 1. In addition, we assigned to these objects a low (), average () or high () inclination based on the appearance of the HI isophotes. The results of fits to the high-resolution data, but restricted by these assumptions, are given in Table 3 and Table 4. The center coordinates in Table 3 are those of the HI-intensity-weighted mean position in and . They typically change only by a few arcseconds if different intensity thresholds are applied. The errors quoted for position angle and systemic velocity represent their scatter between different radii. Note that the velocities listed in Table 4 have not been corrected for inclination. These values, as indeed also the position angle, depend only weakly on the assumed inclination.
| Name | HI center of mass | Scale | |||||||
|---|---|---|---|---|---|---|---|---|---|
| ∘ | ∘ | arcsec | ∘ | kpc/′ | |||||
| [1] | [2] | [3] | [4] | [5] | [6] | [7] | [8] | [9] | [10] |
| D 22 | 80 | 157 9 | 0.47 0.04 | 181 2 | 2.9 | ||||
| D 43 | 30 | 145 3 | 0.93 0.03 | 335 11 | 1.4 | ||||
| D 46∗ | 30 | 189 5 | 0.97 0.05 | 226 45 | 1.4 | ||||
| D 47∗ | 30 | 403 4 | 0.85 0.01 | 266 3 | 0.58 | ||||
| D 48∗ | 80 | 245 12 | 0.33 0.02 | 354 2 | 4.6 | ||||
| N 2537∗ | 30 | 219 5 | 0.80 0.04 | 261 6 | 1.9 | ||||
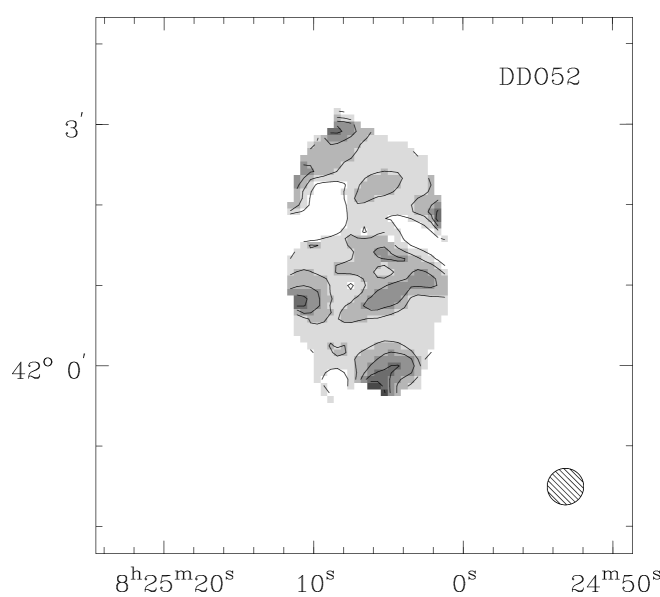
| D 52 | 60 | 204 9 | 0.58 0.04 | 359 3 | 1.5 | ||||
| D 63 | 30 | 307 6 | 0.76 0.02 | 5 2 | 1.0 | ||||
| N 2976∗ | 60 | 316 5 | 0.62 0.01 | 326 1 | 1.0 | ||||
| D 64 | 60 | 210 11 | 0.56 0.05 | 84 4 | 1.8 | ||||
| D 68 | 60 | 300 9 | 0.56 0.03 | 19 2 | 1.8 | ||||
| D 73 | 60 | 135 3 | 0.94 0.03 | 38 15 | 5.2 | ||||
| D 83∗ | 60 | 190 4 | 0.55 0.02 | 56 2 | 2.6 | ||||
| D 87∗ | 60 | 246 5 | 0.86 0.03 | 224 6 | 1.0 | ||||
| M 178 | – | – | – | 91 4 | 0.70 0.06 | 146 7 | 1.5 | ||
| N 3738 | 60 | 182 6 | 0.80 0.05 | 274 10 | 1.5 | ||||
| D 101 | – | – | – | – | – | – | 2.1 | ||
| D 123∗ | 18 | 240 2 | 0.97 0.01 | 197 13 | 3.3 | ||||
| M 209 | 30 | 125 5 | 0.86 0.08 | 206 20 | 1.4 | ||||
| D 125 | 60 | 281 3 | 0.66 0.02 | 118 2 | 1.3 | ||||
| D 133∗ | 30 | 296 5 | 0.86 0.02 | 18 5 | 1.5 | ||||
| D 165 | – | 253 5 | 0.79 0.03 | 93 4 | 1.3 | ||||
| D 166 | 30 | 200 3 | 0.75 0.02 | 46 3 | 4.7 | ||||
| D 168∗ | 60 | 366 5 | 0.82 0.02 | 304 3 | 1.0 | ||||
| D 185∗ | 80 | 302 13 | 0.37 0.02 | 17 1 | 2.0 | ||||
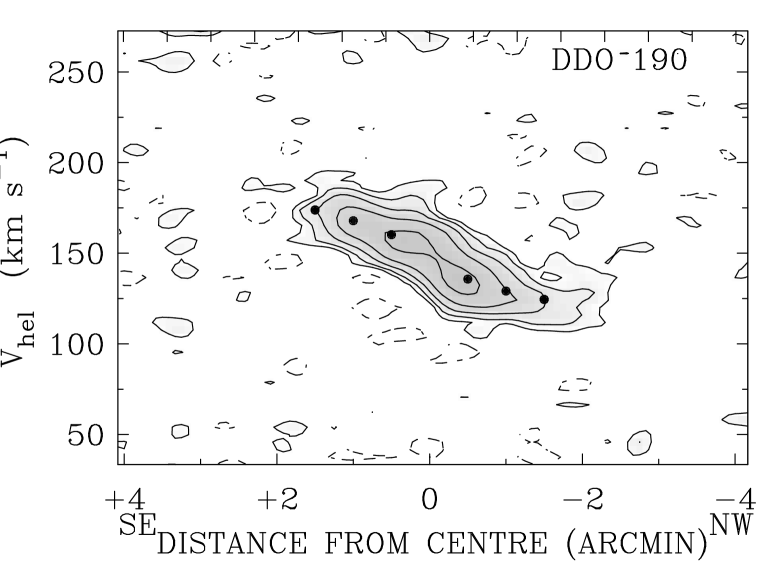
| D 190 | 60 | 201 4 | 0.86 0.03 | 150 7 | 1.7 | ||||
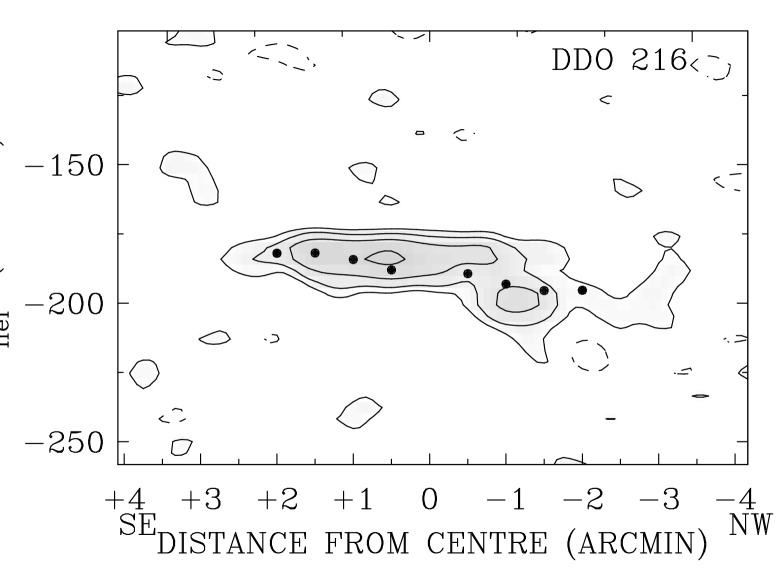
| D 216 | 60 | – | 286 17 | 0.32 0.02 | 130 1 | 0.29 | |||
| D 217∗ | 30 | 472 5 | 0.75 0.01 | 27 2 | 2.7 | ||||
Column designations
[1] Object name;
[2] and [3] right asccension and declination (epoch 1950) of kinematic center and its r.m.s. scatter between radii;
[4] inclination in degrees (see text for explanation);
[5] position angle of kinematic major axis in degrees and its r.m.s. scatter between radii;
[6] systemic velocity in and its r.m.s. scatter between radii;
[7] major axis of ellipse fitted to the contour in the HI column density map;
[8] axial ratio of the ellipse in [7];
[9] position angle of the ellipse major axis in [7];
[10] radial scale of the rotation curve in kpc/arcmin.
Notes: If no error is given, the value is a best estimate.
For galaxies marked with an asterisk, more accurate values are given in
Table 1; they are included here only for comparison purposes.
.
| radius | DDO 22 | DDO 43 | DDO 46∗ | DDO 47∗ | DDO 48∗ | NGC 2537∗ | DDO 52 | DDO 63 | NGC 2976∗ |
| ′′ | |||||||||
| 30 | |||||||||
| 60 | |||||||||
| 90 | |||||||||
| 120 | |||||||||
| 150 | |||||||||
| radius | DDO 64 | DDO 68 | DDO 73 | DDO 83∗ | DDO 87∗ | NGC 3738 | DDO 123∗ | Mk 209 | DDO 125 |
| ′′ | |||||||||
| 30 | |||||||||
| 60 | |||||||||
| 90 | |||||||||
| 120 | |||||||||
| 150 | |||||||||
| radius | DDO 133∗ | DDO 165 | DDO 166 | DDO 168∗ | DDO 185∗ | DDO 190 | DDO 216 | DDO 217∗ | |
| ′′ | |||||||||
| 30 | 9 | ||||||||
| 60 | 17 | ||||||||
| 90 | 26 | ||||||||
| 120 | |||||||||
| 150 |
Notes: See text for fit procedure details. Velocities have not been corrected for inclination, as opposed to results presented in Table 2. For galaxies marked with an asterisk, more accurate values are given in Table 2; values given here are only for comparison purposes. The rotation velocity of DDO 165 was determined from the position-velocity map in position angle .
3 Major axis position-velocity diagrams
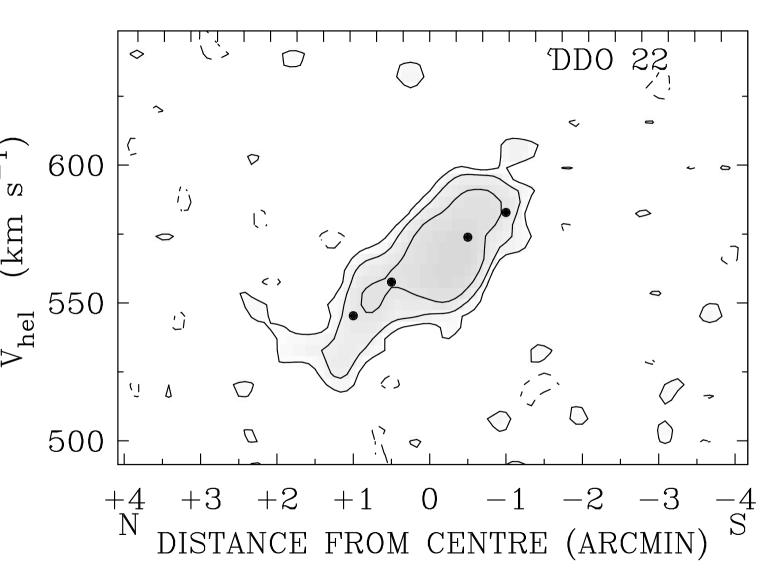
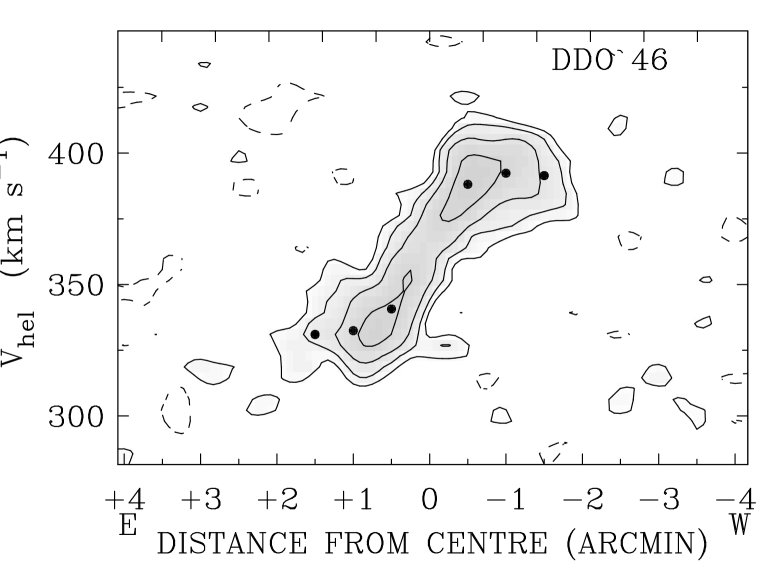
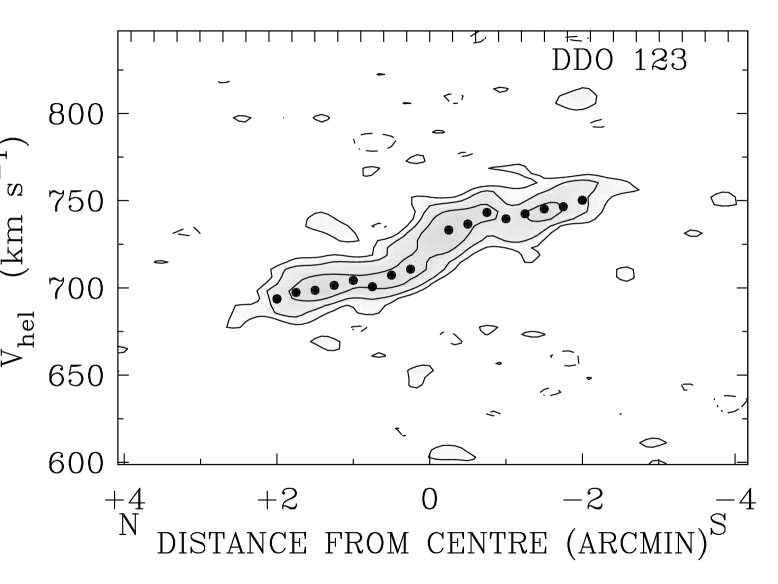
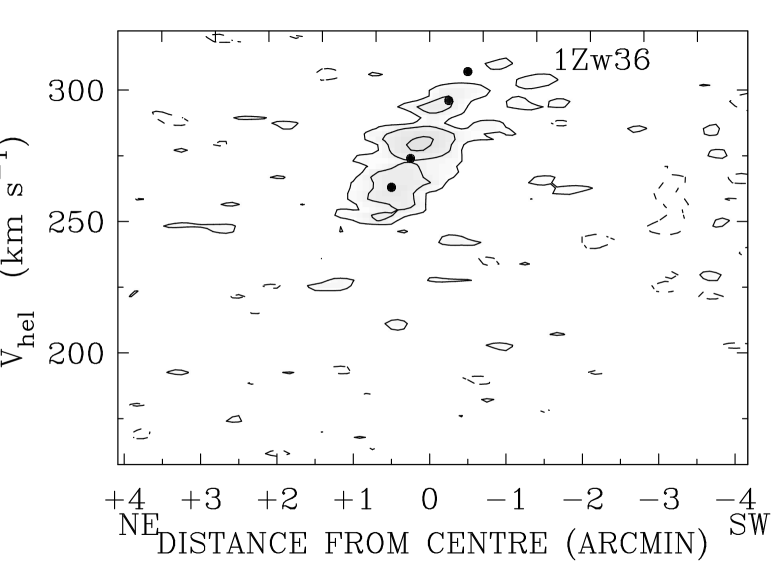
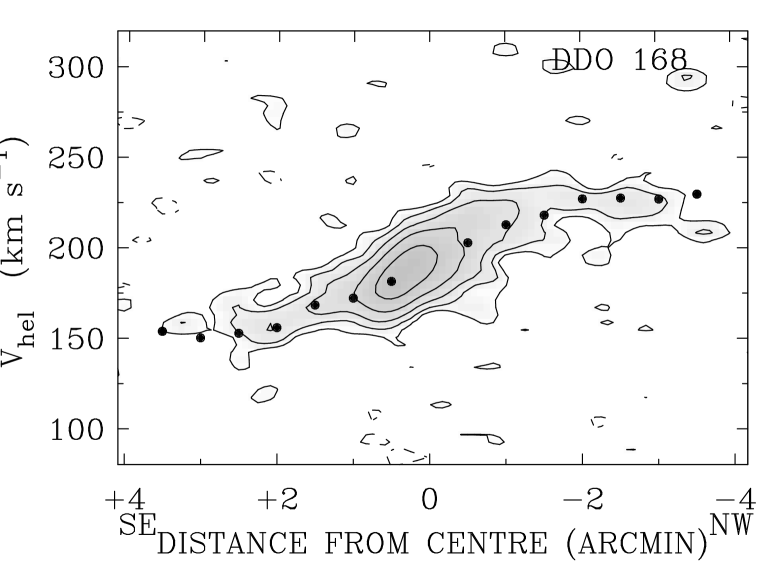
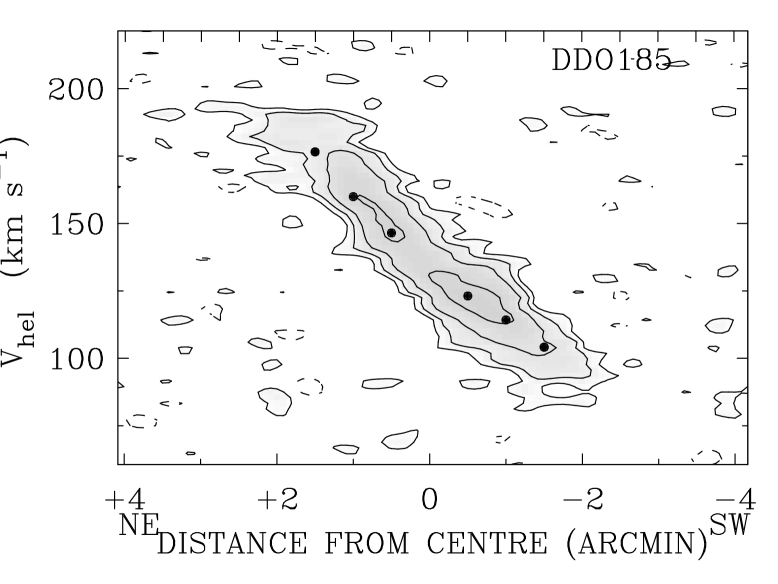
The projected rotation curve, , can be visualized as a position-velocity slice. We include such maps in Fig. 4, which show intensity as a function of position along the kinematic major axis and heliocentric velocity. Position angles and central positions were taken from Tables 1 or 3, in order of preference. We have also included in Fig. 4 the rotation curve points listed in Tables 2 and 4.

Virtually all of the observed galaxies show a velocity gradient. However, in poorly-ordered velocity fields, it is not clear whether or not this represents. In Fig. 1 we show, however, that observed velocity gradients tend to align with the major axis of the HI isophotes, although a few significant misalignments exist suggesting a rotating disk (e.g. DDO 47, DDO 63, DDO 165 and also Sextans A as shown by Skillman et al. 1988). We suspect that much of the width of the distribution in Fig. 1 is caused by errors in the determination of major axis position angle from the HI distribution, although the magnitude of PA is not correlated with the total brightness of the galaxy in HI (or in blue light).
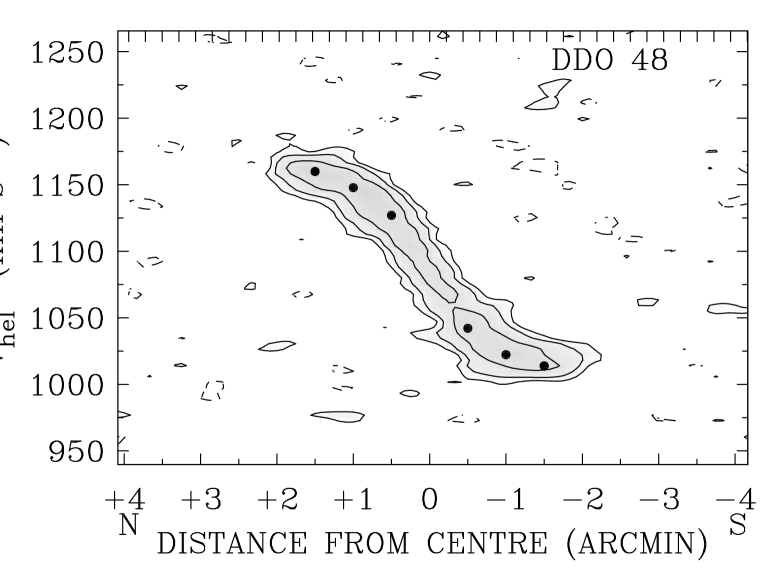
The position-velocity maps of three very-low luminosity dwarf galaxies () betray high ratio of rotational to random velocities: those of DDO 47, DDO 52 and DDO 87. The existence of rotationally supported dwarfs of such low luminosity is remarkable if simple arguments based on the luminosity-linewidth relation for large spirals are applied to dwarf galaxies (Lo et al. 1993, Stil Israel, in preparation). In addition, the rotation curves of DDO 52 and DDO 87 show clear signs of flattening. They illustrate the increase in the number of extremely low luminosity galaxies known to be largely supported by rotation (cf. Carignan & Beaulieu 1989, Côté 1997). Indeed, with the exception of DDO 47 Fig. 4 as well as Tables 2 and 4 include few convincing examples of pure solid-body rotation.
4 Velocity dispersion
The linewidth in a single synthesized beam carries information about the velocity dispersion of the ensemble of HI clouds contained within the beam. This information is, unfortunately, confused with the signatures of other effects such as warps or flares of the HI layer, the extent to which HI structures are resolved, and the rotation velocity gradient over the beam. Warps and flares bring HI from different galactocentric radii into the line of sight, but they only cause confusion in highly inclined galaxies.


Excluding lines of sight with low signal-to-noise ratios, we have used Gaussian fitting to obtain the mean velocity dispersions tabulated in Table 5. To first order, we corrected the maps for finite velocity resolution and linear velocity gradients over the beam according to the relation
where is the dispersion of a Gaussian fitted to the line profile at each position, is the dispersion of a Gaussian corresponding to the velocity resolution of the Hanning-smoothed data, and is the local velocity gradient over the beam, assumed to be of the form . We calculated the velocity gradient at each position from model velocity fields constructed with the rotation curves presented in the previous section. No correction for galaxy inclination was applied. The procedure is described in more detail in Appendix A.
| Name | Name | Name | ||||||
|---|---|---|---|---|---|---|---|---|
| [1] | [2] | [3] | [1] | [2] | [3] | [1] | [2] | [3] |
| DDO 22 | 12.0 | 11.2 | DDO 64 | 10.83.3 | 10.92.5 | DDO 125 | 6.2 | 7.31.5 |
| DDO 43 | 8.42.2 | 9.01.7 | DDO 68 | 10.93.8 | 12.64.4 | DDO 133 | — | 8.22.0 |
| DDO 46 | 9.32.3 | 10.02.2 | DDO 73 | 5.8 | 8.52.8 | DDO 165 | 9.32.9 | 12.03.8 |
| DDO 47 | 8.21.9 | 8.73.2 | DDO 83 | 9.92.4 | 10.02.5 | DDO 166 | 9.1 | 11.63.4 |
| DDO 48 | 9.33.1 | 10.1 | DDO 87 | – | 6.02.0 | DDO 168 | 9.92.9 | 10.63.3 |
| NGC 2537 | 7.2 | 11.55.2 | Mkn 178 | – | 7.6 | DDO 185 | 8.11.6 | 8.81.7 |
| DDO 52 | 6.82.8 | 7.42.3 | NGC 3738 | (12.2) | (18.2) | DDO 190 | 9.22.4 | 10.02.4 |
| DDO 63 | 7.12.1 | 8.92.3 | DDO 123 | 7.42.5 | 9.01.9 | DDO 216 | 6.31.7 | 5.42.6 |
| NGC 2976 | 11.13.5 | 11.83.2 | Mkn 209 | – | 11.5 | DDO 217 | 7.52.7 | 8.62.7 |
Notes: Results are corrected for finite velocity resolution and velocity gradients over the beam as discussed in the text. Velocity dispersion scatter values are given only if the area considered was at at least ten times the synthesized beam area. Column [2] gives mean velocity dispersion and r.m.s. scatter of the velocity dispersion over the galaxy from the full-resolution data, and column [3] the corresponding mean from the low-resolution data.
The high velocity dispersion in NGC 3738 is probably an artifact resulting from too small a beam/velocity gradient correction caused by the marginally resolved steep velocity gradient of the galaxy. Excluding NGC 3738, we find a mean velocity dispersion of at resolution and at resolution. Although the difference between the two results is significant, its magnitude is only 10. Moreover, these values are consistent with those in the literature (Shostak Van der Kruit 1984, Skillman et al. 1988). As the physical area contributing to the measured velocity dispersion increases with galaxy distance squared, we show in Fig. 2 mean velocity dispersions as a function of beam surface area for both the and resolution maps. The systematic increase in mean velocity dispersion with physical beam area increasing by two orders of magnitude is no more than about . As our results are thus effectively insensitive to linear resolution on scales of 0.1 kpc and larger, we may compare the velocity dispersions of galaxies at various distances without fear of introducing large systematic effects.
Finally, we show mean velocity dispersions as a function of inclination in Fig. 3. We used tilted-ring inclinations and, lacking these, inclinations estimated from optical axial ratios assuming an intrinsic axial ratio of 0.15. The result is not sensitive to the exact value of this intrinsic axial ratio. For instance, use of the higher values suggested by the work of Staveley-Smith et al. (1992), increases values by at most 0.08. The upper and lower panels in Fig. 3 show velocity dispersions before and after the correction for inclination. The upper panel shows velocity dispersions increasing at the highest inclinations (; ). This increase has disappeared completely in the corrected set in the lower panel. The widths of local line profiles depend on inclination only through the observed velocity gradient over the beam, which is steeper on average for high inclination angles. Thus, all observed galaxies, irrespective their absolute luminosity (-12.8 mag M -17.6 mag) are have mean velocity dispersions of about 10, very similar to that of spiral galaxy disks. We will return to this result in a forthcoming paper.
The velocity dispersion maps shown in Fig. 4 are corrected for the local velocity gradient over the beam. Note that the steep inner rotation curves of NGC 2537 and NGC 3738 are not completely resolved, resulting in artificially large linewidths.
5 Individual objects
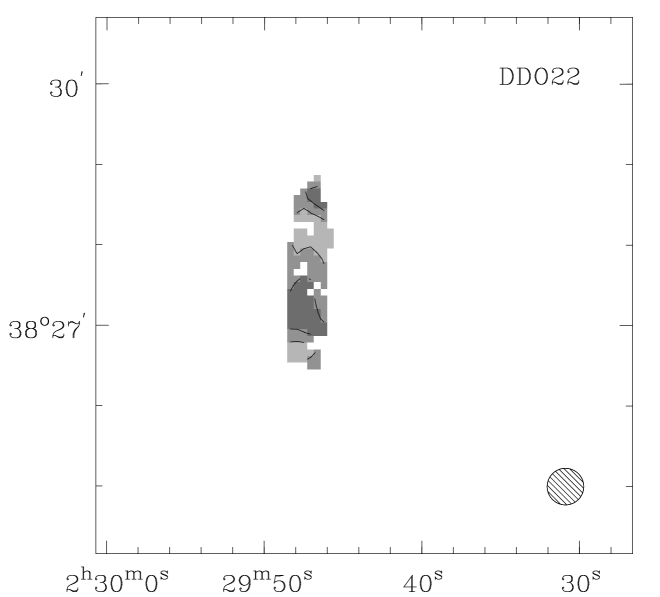
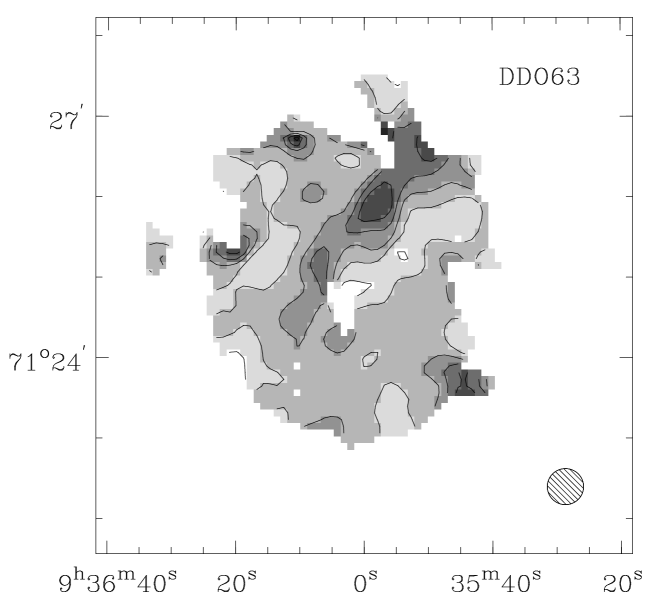
DDO 22: The HI axial ratio suggests that this galaxy is seen at a high inclination. A region of high HI column density is present in the southern side of the galaxy. The kinematic and HI major axes appear to be misaligned.
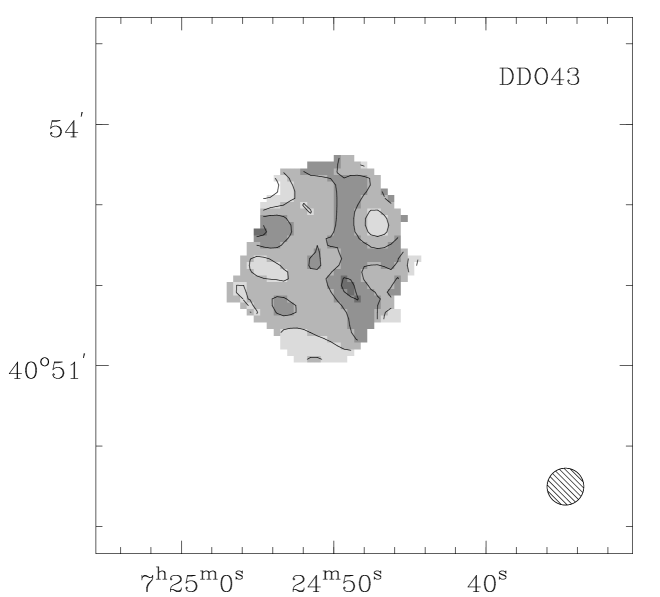
DDO 43: The HI axial ratio indicates a face-on orientation. Parallel velocity contours in a regular velocity field mark a rapidly rising rotation curve. The kinematic and optical major axes are roughly perpendicular.
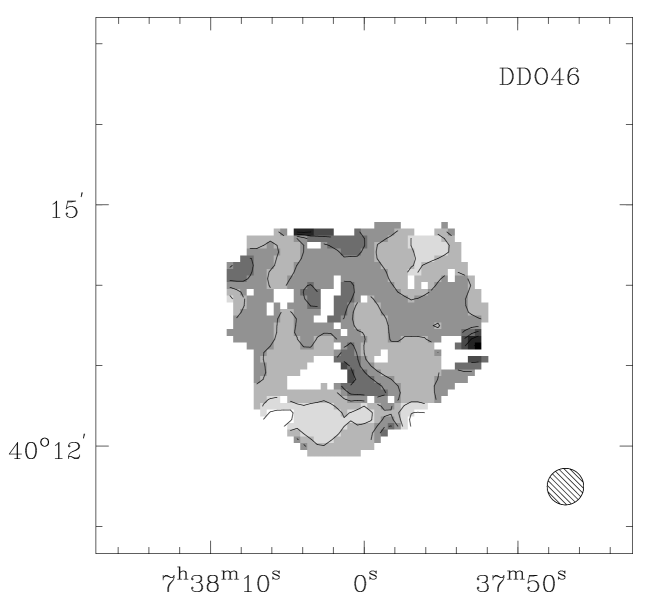
DDO 46: The HI distribution shows a U-shaped high-column density ridge. The velocity field is reasonably symmetric with respect to the kinematic minor axis, but asymmetric with respect to the major axis. The rotation curve is almost flat at the edge of the HI distribution.
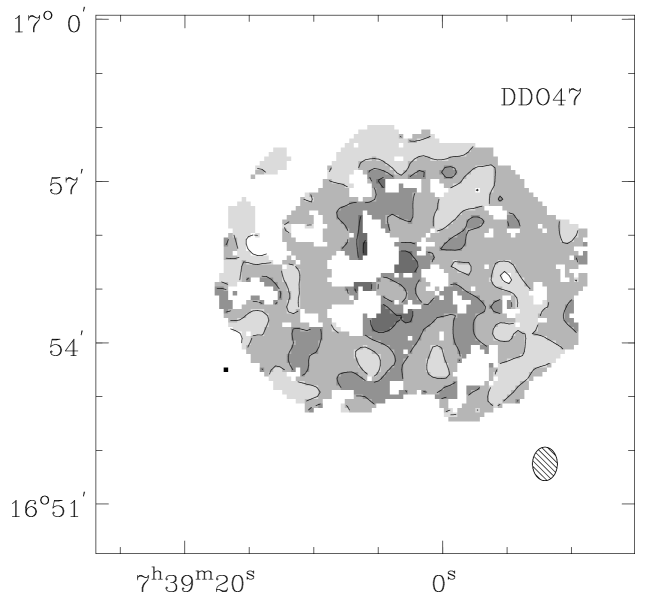
DDO 47: Spiral structure in the outer HI disk was reported by Puche Westpfahl (1994). No optical emission appears associated with the spiral arms. Regularly shaped, elliptical outer HI isophotes suggest a disk seen at low inclination. A number of high column density regions are distributed evenly over the disk. There is a deep hole in the HI distribution at . The velocity field presents one of the few clear examples of solid-body rotation, as does the major axis XV diagram.
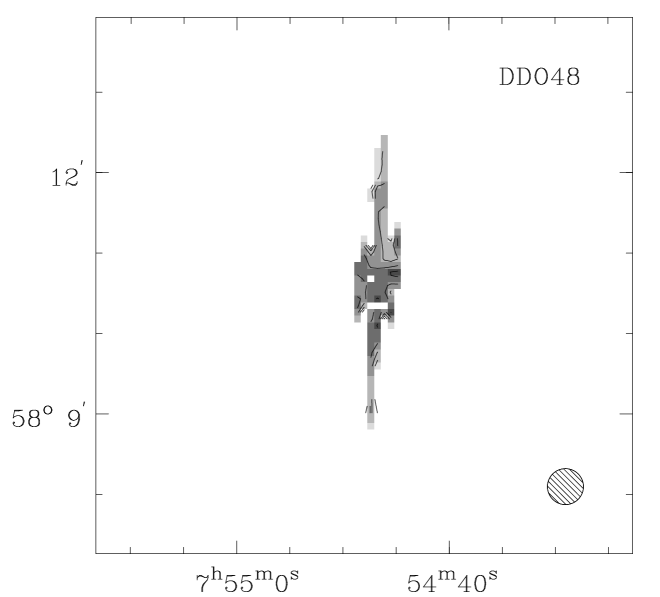
DDO 48: This is probably a nearly edge-on disk with a regular velocity field. The rotation curve rises rapidly near the center and flattens gradually outwards.


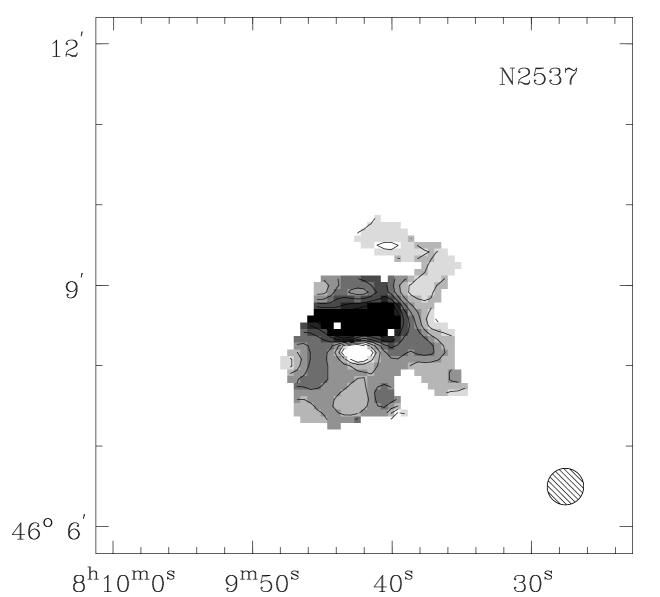


NGC 2537: The HI distribution consists of a U-shaped high column-density ridge. The velocity field, irregular in the north, exhibits the characteristic spider shape of a flattening rotation curve, also evident in the XV map. NGC 2537 is sometimes classified as a Blue Compact Dwarf (BCD) galaxy and is also known as the Bear Paw Galaxy (Schorn 1988). UGC 4278 is a nearby companion. NGC 2537A occurring just east of NGC 2537 on PSS plates is not visible in the HI data. The large linewidths in the center are an artifact of the unresolved velocity gradient.
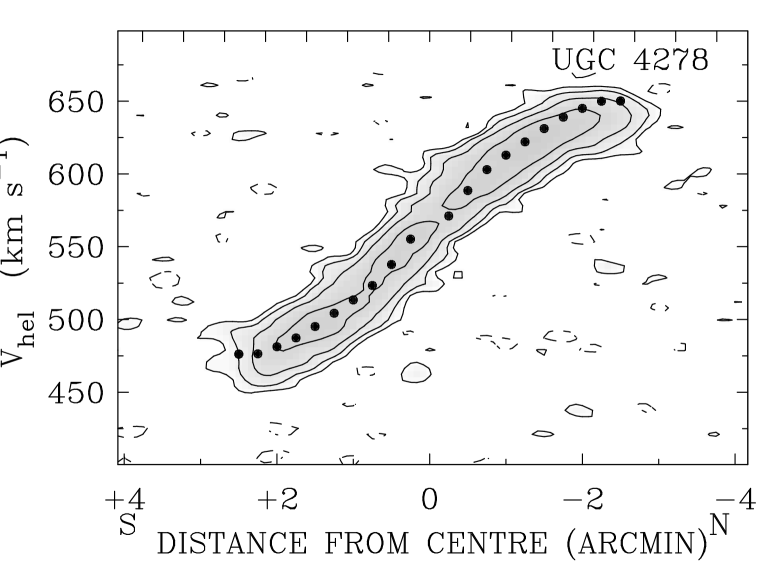
UGC 4278: The rotation curve may show a turnover. NGC 2537 is away at PA = .
DDO 52: Most of the HI is in a low-column-density disk, with a peak . The velocity field is regular with a hint of a flattening rotation curve. The XV diagram shows a rather high ratio of rotational to random velocity, despite its small amplitude.
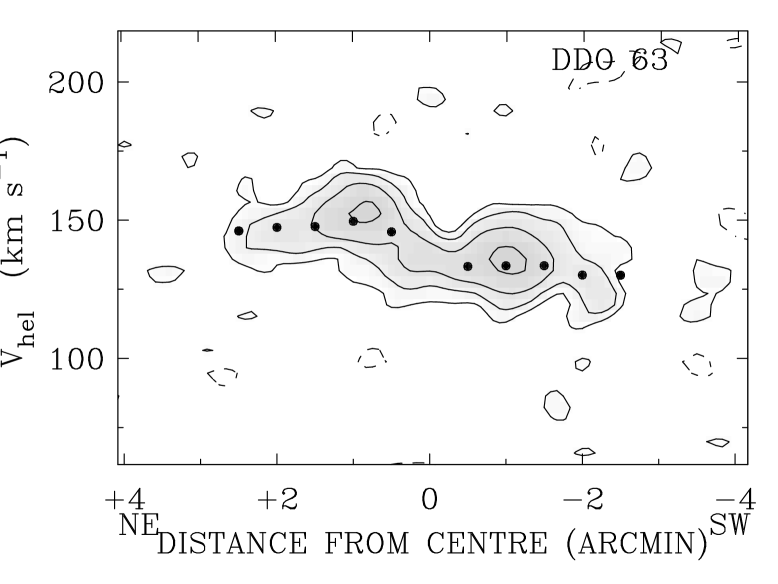
DDO 63: The HI is concentrated in a ring with a high column density, with a five times lower central minimum () at . The kinematic and HI major axes are misaligned by about . The rotation velocity is comparable to the HI velocity dispersion. The ring dominates the XV map. DDO 63 has also been studied by Puche & Westpfahl (1994) and Tully et al. (1978). The latter find the same kinematic/HI axis misalignment, and a comparable well-ordered, small-amplitude rotation velocity.
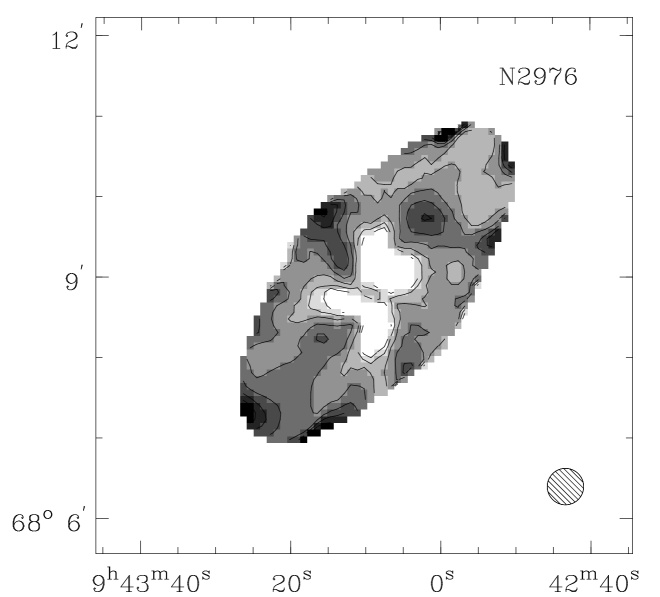
NGC 2976: The outer HI isophotes are well represented by ellipses. The two continuum sources (Paper I) are near to but not precisely coincident with the high HI column density regions () on either side of the galaxy at , (NW) and , (SE). The emission at upper left in the velocity field map is unrelated G alactic foreground HI. The rotation curve flattens near the edge of the HI disk. A detailed optical study of NGC 2976 was presented by Bronkala et al. (1992).
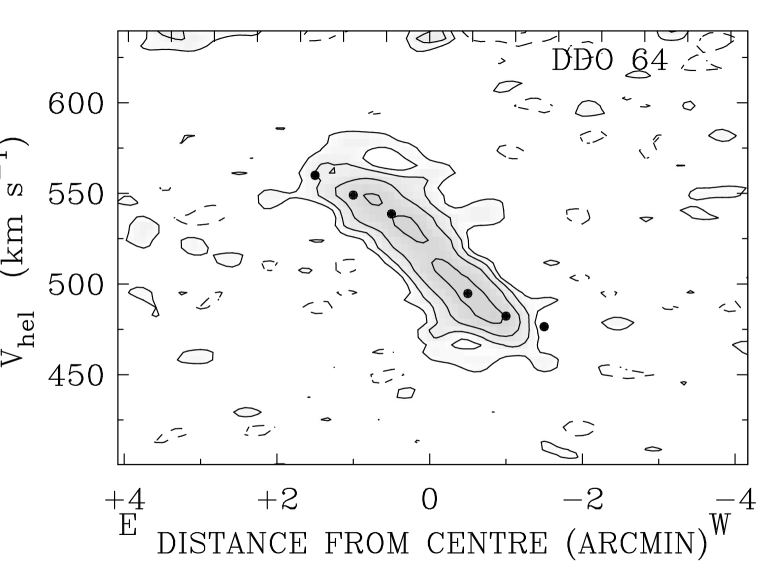
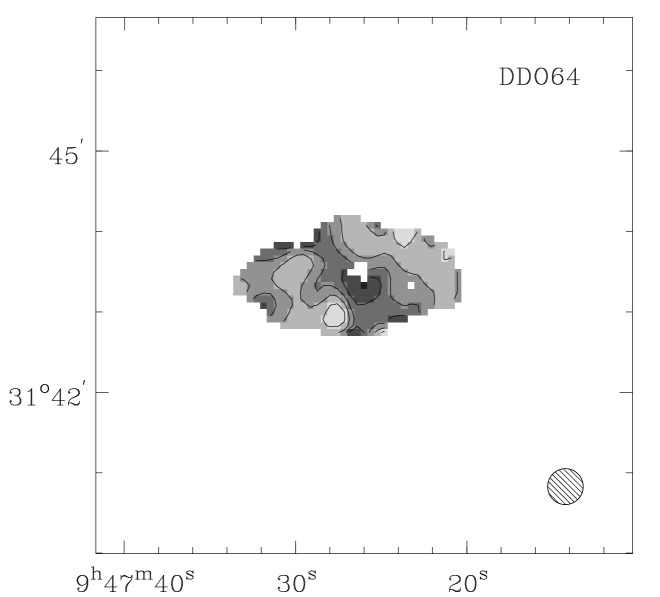
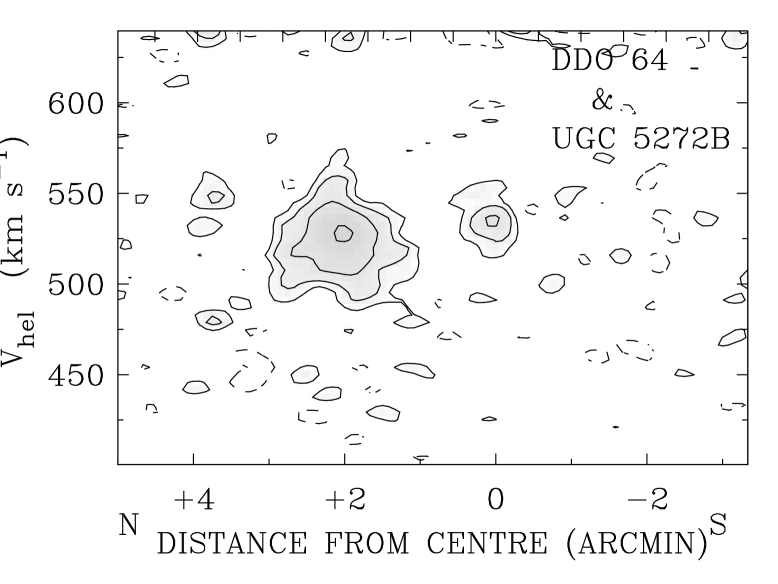
DDO 64: A high-column-density ridge dominates the HI structure of this probably nearly edge-on galaxy. The velocity field is poorly resolved along the minor axis. The XV map shows nearly solid-body rotation with only a hint of flattening. The feature south of DDO 64 is UGC 5272B, the feature north of it is probably noise.
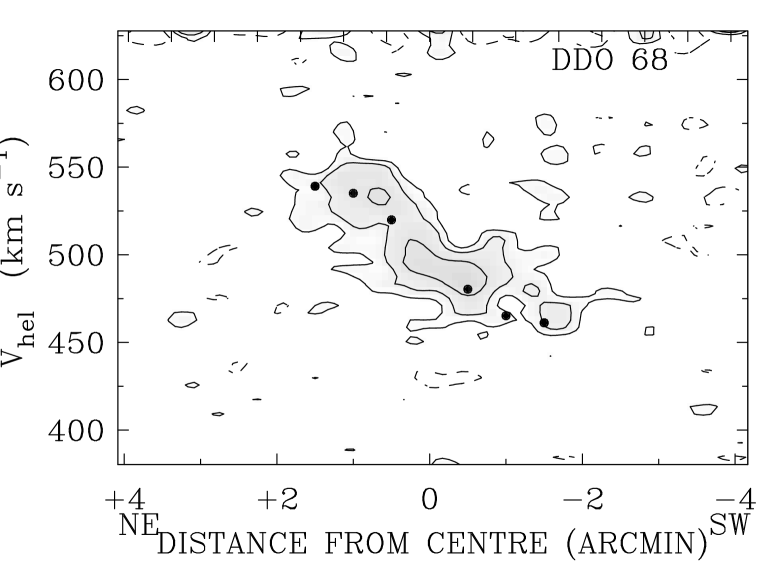
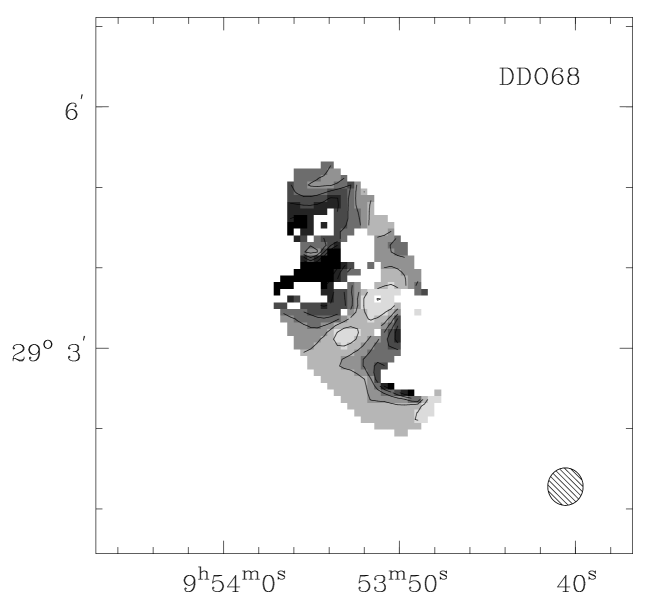
DDO 68: At low column density levels, DDO 68 is reasonably symmetrical. High-column-density regions are found in the north and east of the galaxy. A deep hole devoid of HI emission is located at , . Low signal-to-noise regions contribute to the irregular appearance of the velocity field. The ratio of rotational to random velocity is low.
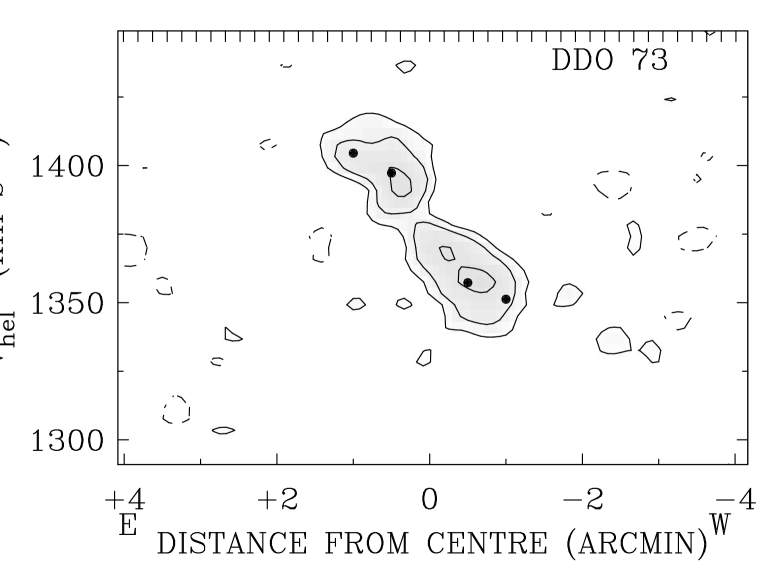
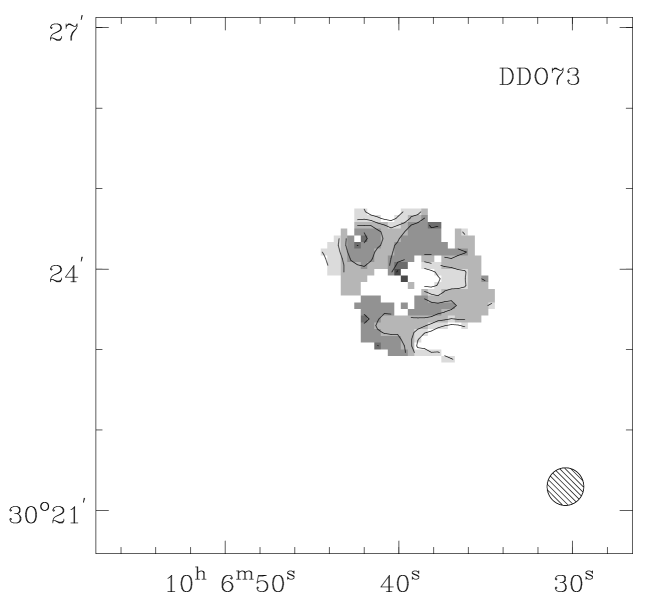
DDO 73: The HI isophotes suggest a nearly face-on orientation. However, both velocity field and XV map indicate projected rotational velocities considerably in excess of the HI velocity dispersion.
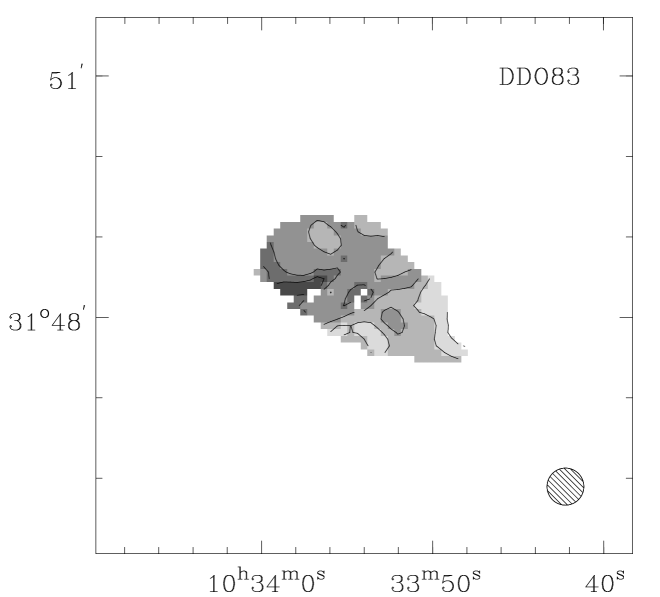
DDO 83: The HI column density is high throughout the galaxy. The velocity field is regular and spider-like. The rotation curve rises strongly near the center and flattens at the edge of the HI disk.
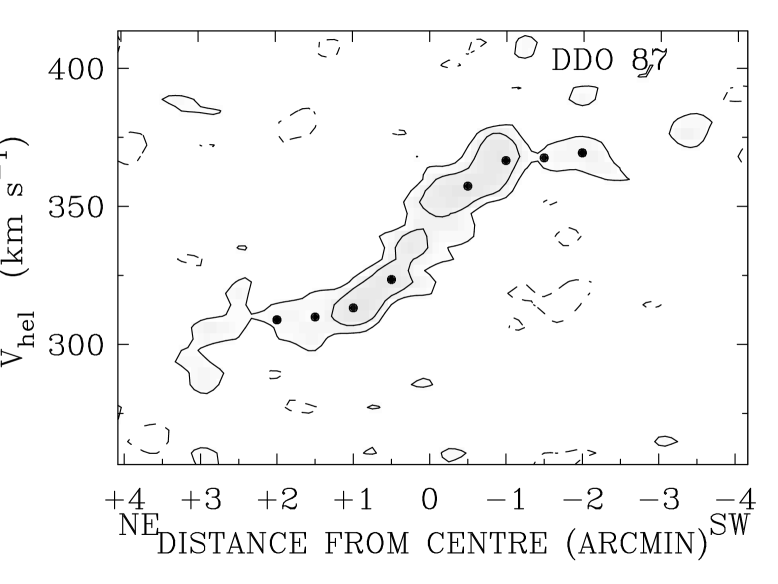
DDO 87: The HI is distributed over a low-column-density disk with a number of small high column density regions, unresolved at resolution. The fragmented appearance of the velocity field is the result of low signal-to-noise ratios. The XV map shows a nearly flat rotation curve in the outer regions. The low luminosity of DDO 87 is inferred from its association with the M81 group (Huchtmeier Skillman 1998).
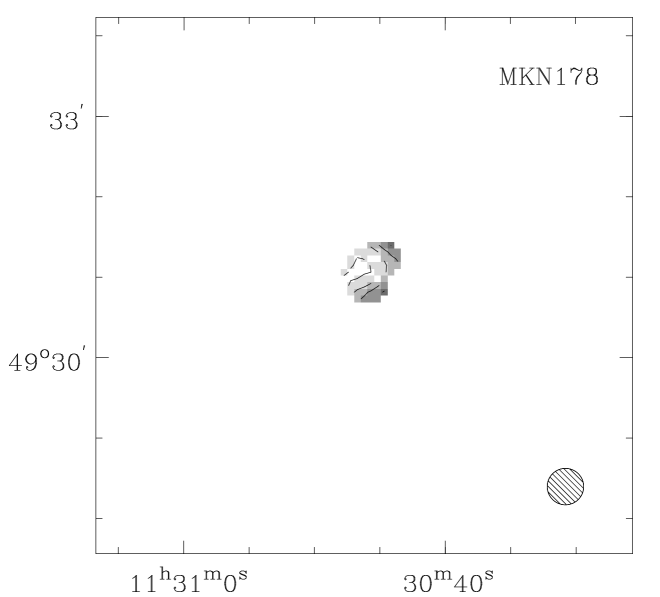
Mk 178: This galaxy is poorly resolved spatially. Its HI structure, kinematics and luminosity are similar to DDO 63, DDO 125 and DDO 165.
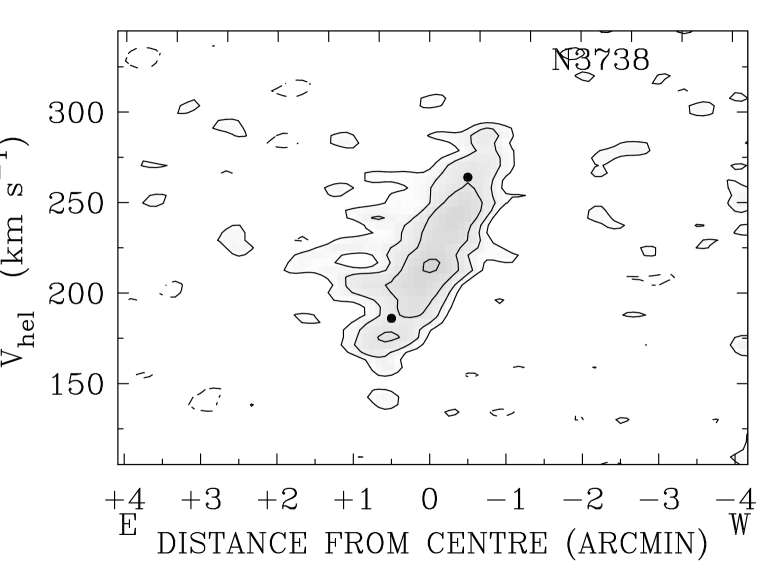
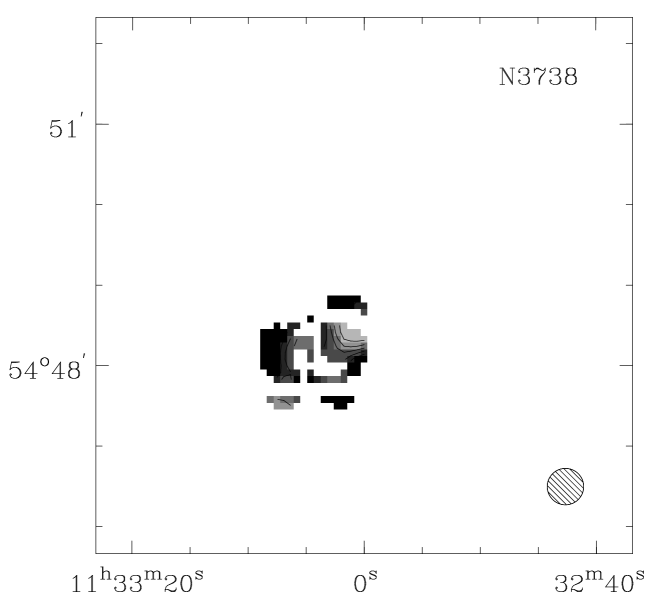
NGC 3738: The HI column density is high everywhere, with a central peak . The velocity profile and the XV map indicate a steep velocity gradient, which is difficult to fit with the tilted ring method. The indicated rotation velocity was fitted by eye to the XV map. The high velocity dispersion is an artifact of the large velocity gradient in this marginally resolved galaxy.
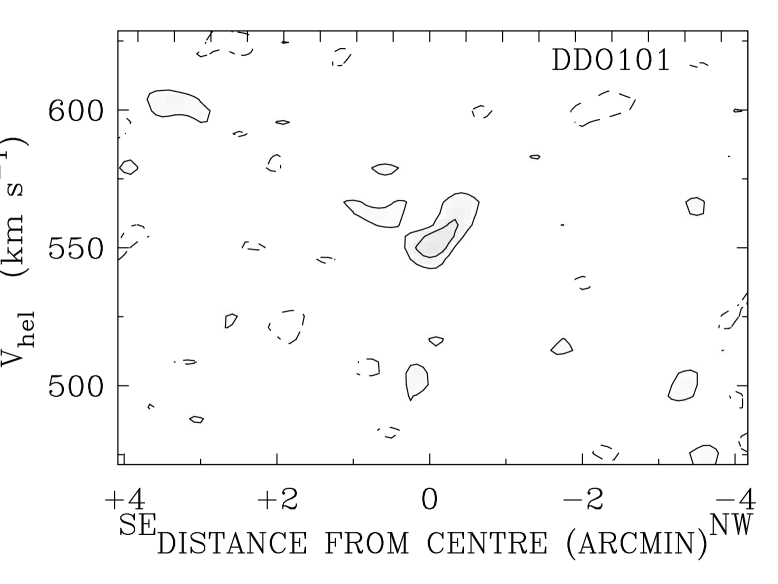
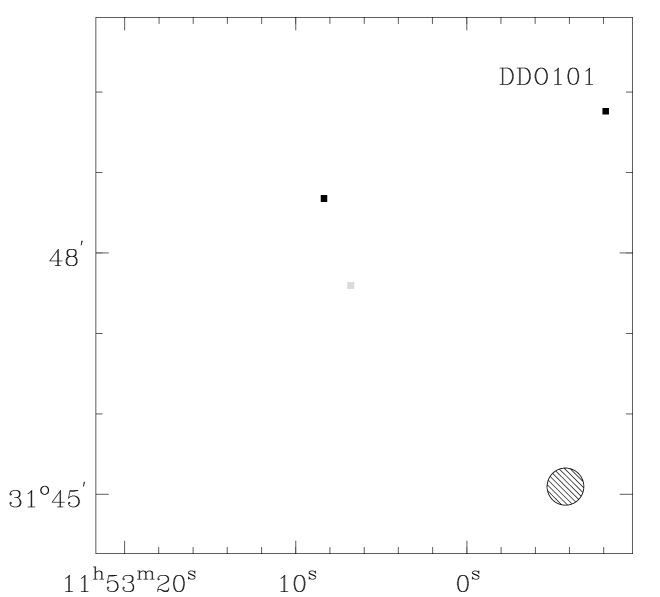
DDO 101: HI extent is too limited to show structure.
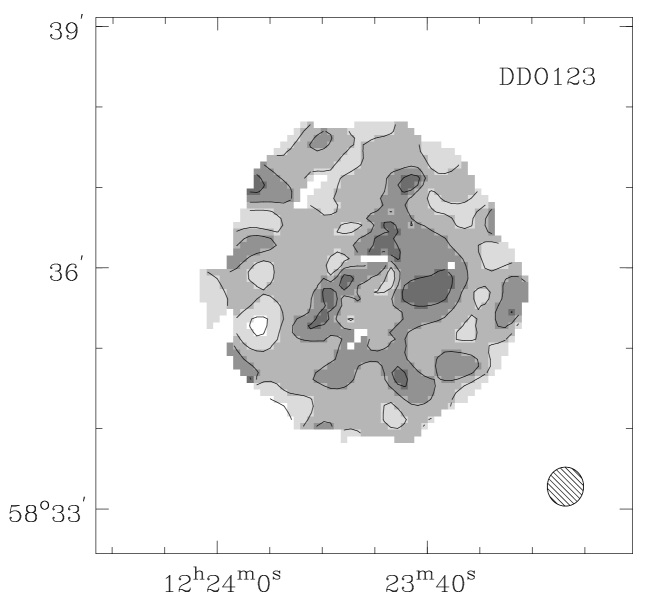
DDO 123: The HI is distributed evenly throughout the disk of this face-on galaxy. Irregularities in the velocity field coincide with low signal-to-noise regions. The rotation curve rises out to the edge of the HI disk.
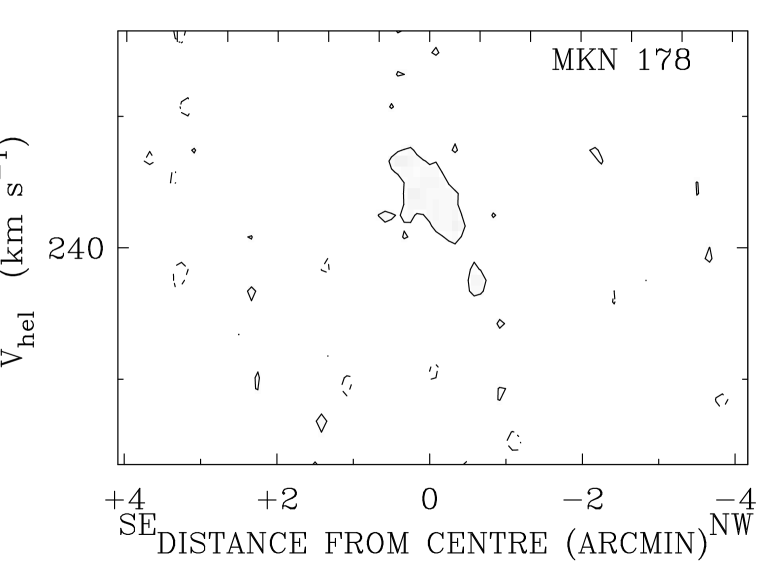
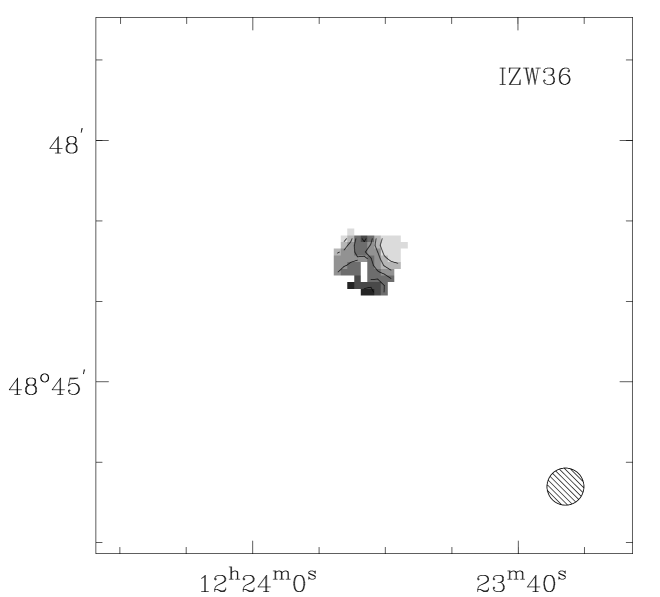
Mk 209: The peak of the high-column-density region is . The velocity field appears regular but could not be fitted properly because of insufficient resolution. The velocity gradient was fitted manually to the XV map; it is consistent with a solid body rotation curve. HI in Mk 209 (IZw 36) has also been observed with the VLA by Viallefond et al. (1987).
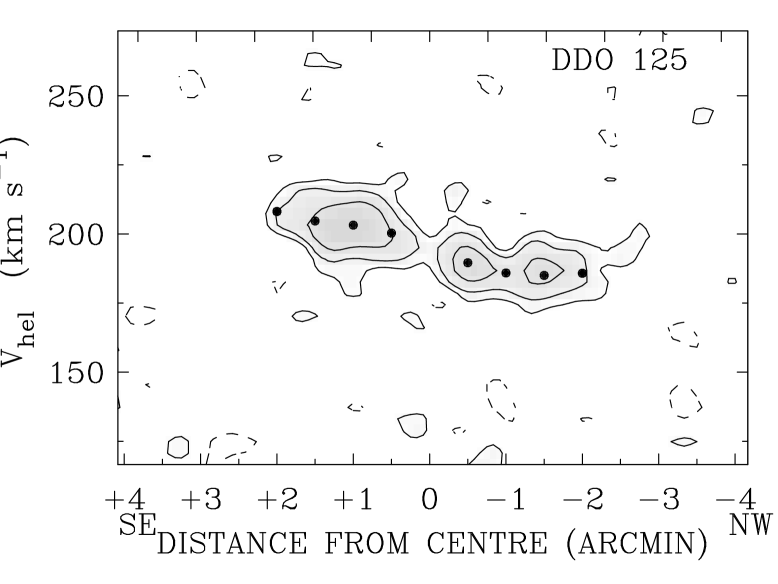
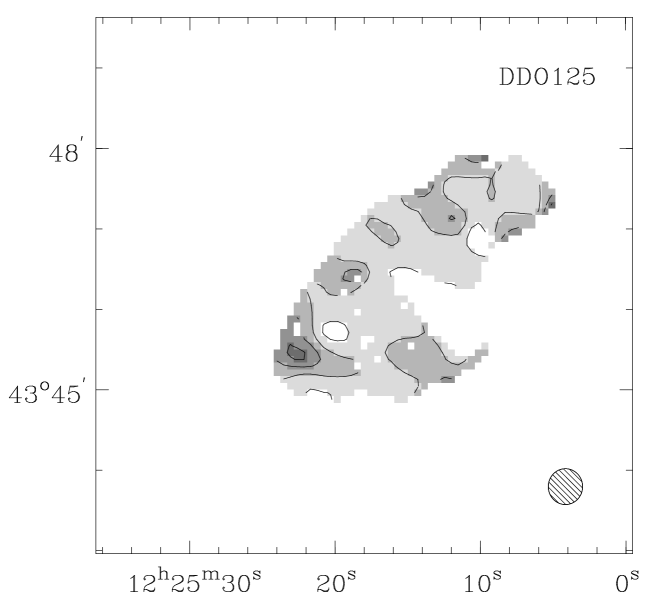
DDO 125: The HI is mainly concentrated in two high-column-density regions, separated by a low-column density center, suggesting a fragmented ring. The velocity field shows a velocity gradient along the major axis. Rotation is clearly demonstrated by the XV map. HI in DDO 125 was studied in detail by Tully et al. (1978).
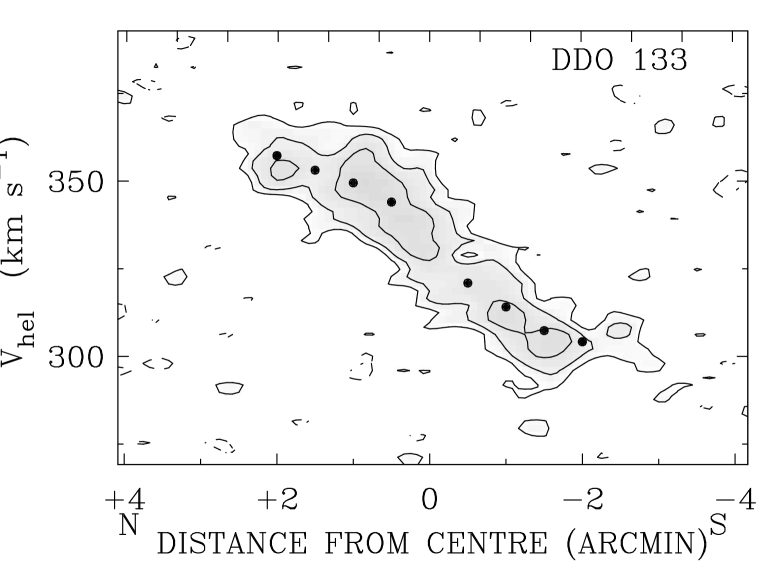
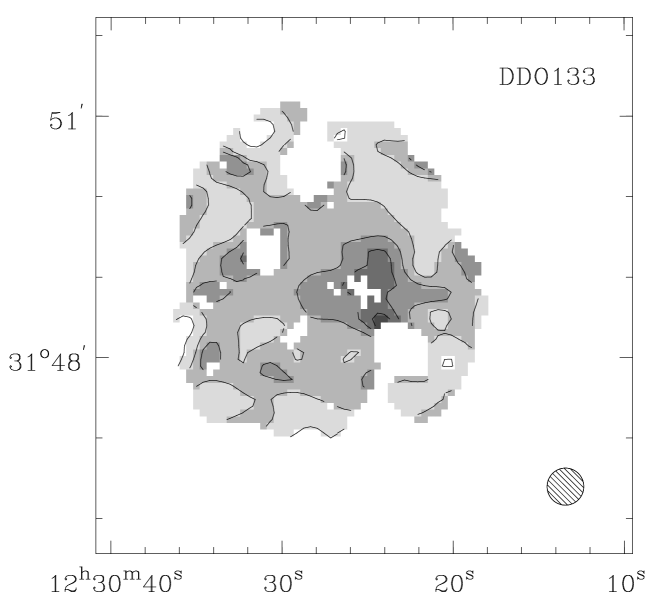
DDO 133: The HI isophotes are well-represented by ellipses at the level of . The rotation curve flattens slightly outwards.
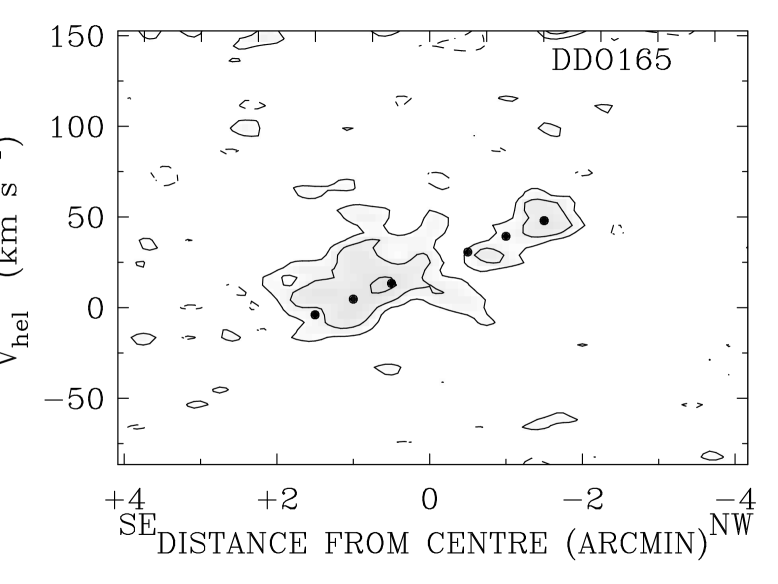
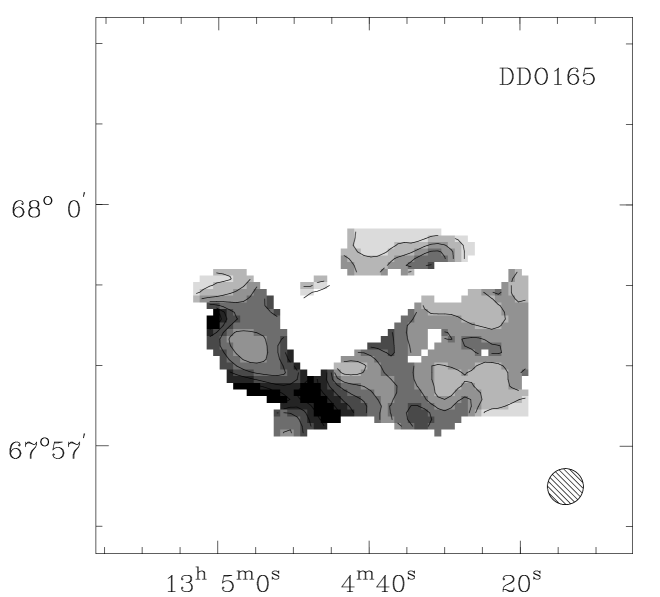
DDO 165: Most of the HI is located in a ring. The velocity field is highly irregular. The maximum velocity gradient is along a line from SE to NW in position angle . The rotation velocity was fitted to the XV map assuming solid-body rotation. However, the emission in the XV map is mainly due to the ring.
DDO 166: A ridge of high-column-density HI extends over the eastern side of this face-on galaxy. The velocity field has a strong gradient, in spite of the small inclination suggested by the HI isophotes. The isovelocity contours are twisted into an S-shape at the eastern side of the galaxy. Thean et al. (1997) have published VLA HI maps of NGC 5033, DDO 166 and UGC 8314.
DDO 168: Two very high HI column density regions () occur near the center of the galaxy at , and , . The position angle of the velocity gradient changes over the disk by approximately . The peculiar structure of DDO 168 is not unique. Similar very-high column density regions combined with twisted velocity fields have been observed in other ‘amorphous galaxies’ such as NGC 1140 (Hunter et al. 1994) and IZw 18 (Viallefond et al. 1987, Van Zee et al. 1998). A detailed study of the mass distribution in DDO 168 was performed by Broeils (1992).
DDO 185: The HI column density map suggests a disk seen at a high inclination. The isovelocity contours are regularly spaced, consistent with the rising rotation curve shown by the position-velocity map. DDO 185 (=Holmberg IV) was used as a calibrator galaxy for the Tully-Fisher relation by Kraan-Korteweg et al. (1988).
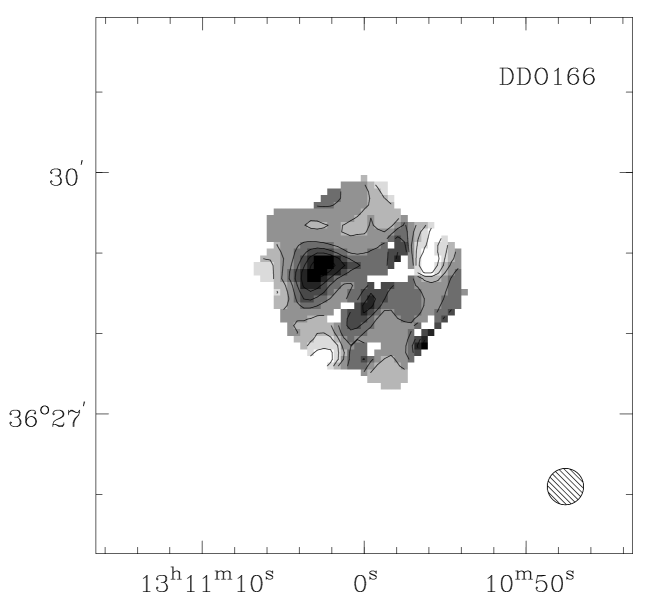
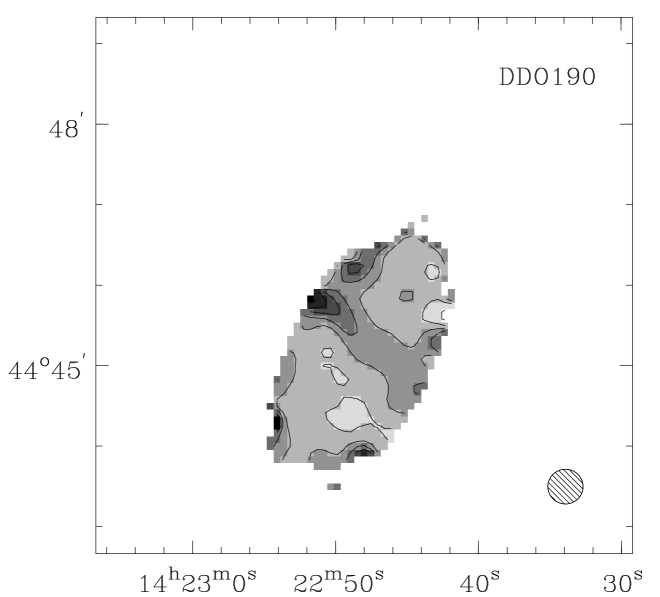
DDO 190: The highest column densities are found on the west. The velocity field is somewhat irregular, but rotation is clearly visible. The XV map shows a hint of flattening of the rotation curve on the NW side.
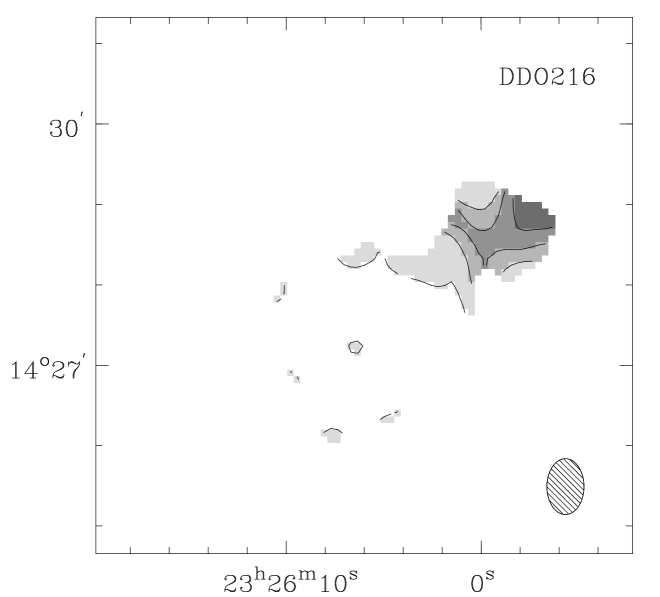
DDO 216: The HI is located in the southern half of the (optical) galaxy (Sandage 1986, Lo et al 1993). There is little sign of rotation in the velocity field and XV maps. In fact, the velocity gradient suggested by the XV map may represent a single HI cloud at a discrepant velocity. For a VLA study of DDO 216, see Lo et al. (1993).
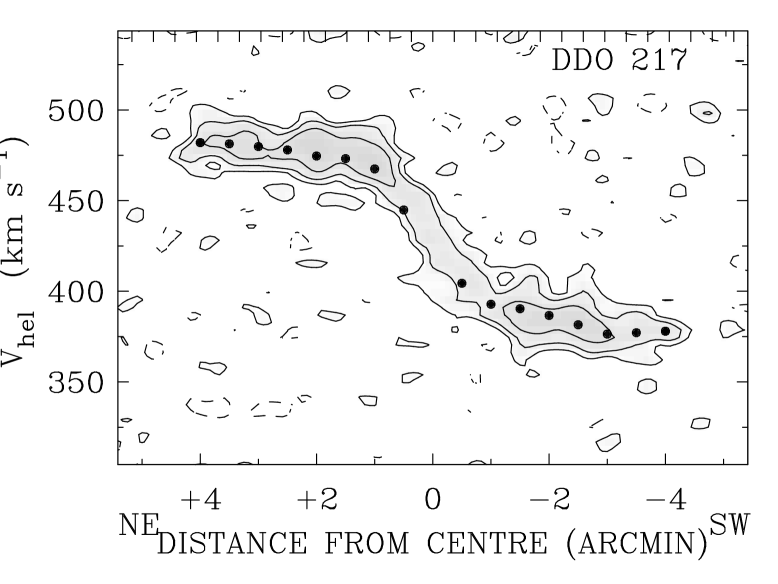
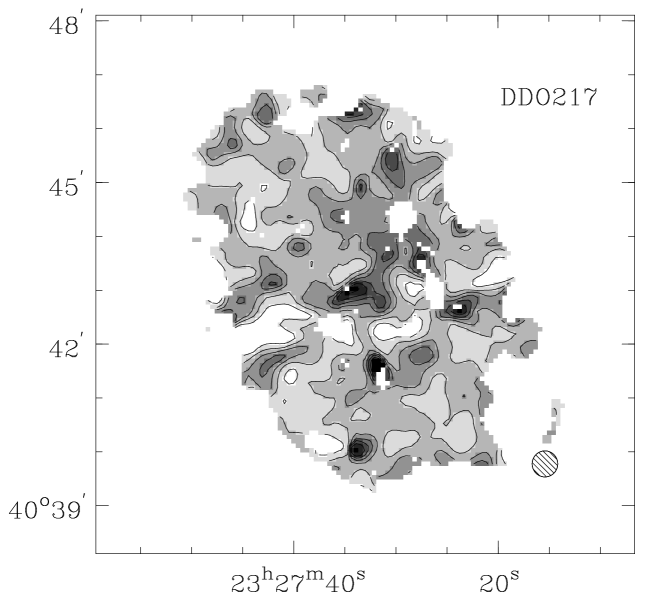
DDO 217: The HI is distributed relatively evenly over the disk. The velocity field shows differential rotation over most of the galaxy. The difference in position angle between the inner region and the outer disk is clearly visible in the velocity field map. The XV map shows a rapid rise of the rotation velocity near the center and a gradual increase in the outer disk.
References
- Begeman (1987) Begeman K.G., 1987, PhD thesis, University of Groningen, the Netherlands
- Broeils (1992) Broeils A., 1992, PhD thesis, University of Groningen, the Netherlands
- Bronkala et al. (1992) Bronkala W., Notni P. et al., 1991, AN 313, 1
- Carignan & Beaulieu (1989) Carignan C., Beaulieu S., 1989, ApJ 347, 760
- Côté et al. (1997) Côté S., Freeman K., Carignan C., 1997, ASP Conf. Ser. 117, Eds. M. Persic M. P. Salucci, p. 52
- (6) Huchtmeier W. K., Skillman E. D., 1998 A&AS 127, 269
- Hunter et al. (1994) Hunter D.A., Van Woerden H. Gallagher III J.S., 1994, ApJS 91, 79.
- Kraan-Korteweg et al. (1988) Kraan-Korteweg R.C., Cameron L.M., Tammann G.A., 1988, ApJ 331, 620
- Lo et al. (1993) Lo K.Y., Sargent W.L.W. Young K., 1993, AJ 106, 507
- Melisse and Israel (1994) Melisse J.P.M. Israel F.P., 1994, A&A 103,391
- (11) Puche D., Westpfahl D., 1994, in ESO/OHP workshop ‘Dwarf Galaxies’, eds. G. Meylan P. Prugniel, p. 273
- (12) Sandage A., 1986 AJ 91 496
- Schorn (1988) Schorn R.A., 1988, Sky & Telescope 75, 23
- Shostak & Van der Kruit (1984) Shostak G.S. Van der Kruit P.C., 1984, A&A 132, 20
- Skillman et al. (1988) Skillman E.D., Terlevich R., Teuben P.J., Van Woerden H., 1988, A&A 198, 33
- Staveley-Smith et al. (1992) Staveley-Smith L., Davies R.D., Kinman T.D., 1992, MNRAS 258, 334
- (17) Stil J.M., Israel F.P., 2002 A&A submitted (Paper I)
- (18) Swaters R.A., 1999, Ph.D. thesis University of Groningen (NL)
- Thean et al. (1997) Thean A.H.C., Mundell C.G., Pedlar A. Nicholson R., 1997, MNRAS 290, 15
- Tully et al. (1978) Tully R.B., Bottinelli L., Fisher J.R., Gougenheim L. Sancisi R., Van Woerden H., 1978, A&A 63, 37
- Viallefond et al. (1987) Viallefond F., Lequeux J., Comte G., 1987, in Starbursts and Galaxy Evolution, eds. Thuan T.X., Montmerle T., Tran Thanh Van J., Editions Frontieres
- Van Zee et al (1998) Van Zee L., Skilman E.D., Salzer J.J., 1998, ApJ 497, 1
- Warner et al. (1973) Warner P.J., Wright M.C.H., Baldwin J.E., 1973, MNRAS 163, 163
Appendix A: Correction for the velocity gradient
We assume a well-resolved velocity field so that second and higher order derivatives of the velocity field can be neglected. We also assume an HI disk of negligible thickness so that all lines of sight cross the disk at a single radius, implying the one-dimensional linear situation sketched in Fig. 6. We choose the x-axis along the velocity gradient, with the zeropoint at the center of the Gaussian beam. The intensity-weighted mean velocity over the beam corresponds to that of position , which is not necessarily the center of the beam.

We now divide the beam into many () lines of sight, each with a large number of identical elements () with velocities , at position , . This definition includes an implicit integration over the coordinate perpendicular to the velocity gradient. The elements are identified with individual HI clouds of very small intrinsic velocity dispersion. At every position we define the mean velocity as , which is related to the intensity-weighted mean velocity and the velocity gradient through
The velocity dispersion of the elements at position is . Substitution of and evaluation of the cross-product yields
The third term is independent of . For the second term we may write
Therefore, we have
The intensity-weighted mean velocity dispersion over the beam is
with weight . Therefore, with
This equation is of the general form
where is the observed dispersion of a local line profile, corrected for the instrumental spectral resolution. The second term is the line broadening due to the velocity gradient over the beam. Note that the velocity gradient is a function of position if the galaxy is not in solid-body rotation, necessitating use of a model velocity field constructed from the rotation curve in order to calculate at every position. The coefficient is a weighted mean of the intensity distribution over the beam. If we assume a constant intensity (i.e. ) over the Gaussian beam , we have :
The error introduced by the assumption of a constant intensity can be estimated by calculating the correction for simple analytical intensity distributions. For any assumed intensity distribution
and can be calculated. The coefficients are given for three types of intensity distribution in Table 6).

.
Shallow intensity gradients do not make much of a difference. To first order, the effect of an intensity gradient is to shift the distribution of in the direction of the intensity gradient. Since the beam function falls off rapidly for large x, only large gradients produce a significant difference with constant intensity. The greatest effect on the correction for the velocity gradient is brought about by the symmetric distribution. If the emission is highly concentrated towards the center of the beam, the velocity gradient has no effect. On the other hand, if the emission is concentrated in the wings of the beam, the effect of the velocity gradient is maximal. If the intensity does not change more than 50% over the beam, the error in introduced by the assumption of constant intensity is of the order of 10%.
| Int. gradient | Int. minimum | Int. jump | |
|---|---|---|---|
| a | |||
| 0.0 | 0.500 | 0.500 | 0.500 |
| 0.1 | 0.498 | 0.548 | 0.497 |
| 0.2 | 0.490 | 0.591 | 0.487 |
| 0.5 | 0.439 | 0.700 | 0.421 |
| 1.0 | 0.349 | 0.833 | 0.182 |
Note: Scale factor defines the magnitude of the intensity change over the beam. The position is in units of beamsize . At positions where the indicated functional forms are negative, the intensity was set to zero. The symbol is used for the heaviside function .