Statistics and multiwavelength synthesis models: towards a new generation of synthesis models
Abstract
In this contribution I present my current work in a new generation of evolutionary synthesis models that compute the multiwavelength energy distribution (from gamma-rays to radio) as well as the associated dispersion for young stellar systems. I will also show some statistical effects that may appear in the analysis of surveys, like bimodal or multi-modal distributions and bias when color indices computed by the codes are compared with observations. Such new generation of synthesis models may be useful for the analysis of the data expected from GTC.
En esta contribución presento mi trabajo en el desarrollo de una nueva generación de modelos de síntesis evolutiva que calculan tanto el espectro multirango (desde rayos- a ondas de radio) como la dispersión asociada en cúmulos estelares jóvenes. También muestro algunos efectos estadísticos que pueden aparecer en en análisis de conjuntos de datos, como distribuciones bimodales o multimodales y sesgos cuando se comparan los resultados de los modelos de síntesis con datos reales. Esta nueva generación de modelos de síntesis puede ser una herramienta muy útil para el análisis de los datos que se esperan obtener con el GTC.
keywords:
Galaxies: Evolution0.1 Introduction
Taking into account the discreteness of the stellar population, the predictions of any model that relies on an Initial Mass Function (IMF) are only exact under the assumption of an infinite number of stars. Otherwise, they only give a mean value of a probability distribution. The relevance of such fluctuations in the results of synthesis models is obvious in the case of massive stars and young clusters, but they also affect the models of older clusters dominated by the emission of low-mass stars since small variations in the initial mass/number of stars in a given mass range, can produce different numbers of, e.g., AGB stars at a given age, which in turn produce large variations in the resulting observable.
So, for the comparison of models with observational data it is necessary to obtain not only the mean value of the observable, but also, at least, the corresponding dispersion of the computed observable due to the discreteness of the stellar population, and, ideally, the underling probability density distributions. The dispersion due to a finite number of stars in real systems can be evaluated theoretically, as it has been shown in Cerviño et al. (2002).
0.2 Some examples: multiwavelength emission and color-color diagrams
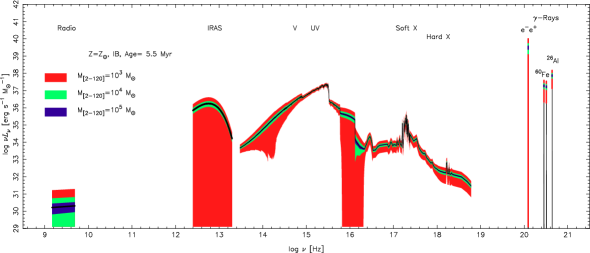
In Fig. 1 I show the 90% confidence level for the multiwavelength spectrum for a 5.5 Myr old burst obtained analytically from our code. Examples of statistical effects of a large number of Monte Carlo simulations and comparisons with the dispersion obtained theoretically for different observables can be found in Cerviño et al. (2000, 2001, 2002).
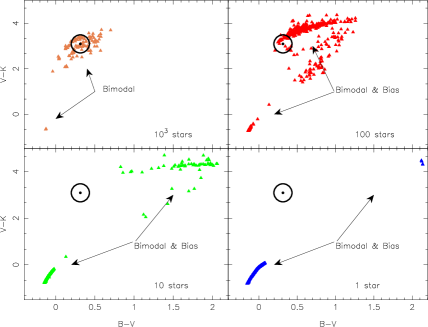
In Fig. 2 I show the B–V vs. V–K colors for a 10 Myr old star forming region. Note that it is assumed that colors are independent on the number of stars in the cluster, so I have test this hypothesis with 103 Monte Carlo simulation of clusters (triangles) with 1000, 100, 10 and 1 stars in the mass range 2–120 M⊙ following a Salpeter IMF slope. The theoretical result is shown with the symbol. The Figure shows two important effects: (a) There are bimodal (multi-modal) distributions of the colors. (b) The mean value obtained by infinite populated IMF (analytical result) has a bias if it is used for the analysis clusters with a small number of stars. As reference, the mean mass of a cluster with 103 stars in the given mass limits is M⊙, it means M⊙ if the value of lower mass limit of the IMF is 0.08 M⊙. Both, bimodality and bias, are a natural effect of statistics when only a few stars dominate the observable. Note that it is dependent on the observable: Example 1: A cluster with 105 stars in the mass range 2 – 120 M⊙ with a Salpeter IMF slope have about only 10 WR stars!. Example 2: The effect on the colors of globular clusters (dominated by a few AGB star) can be relevant (see Bruzual 2001 and references therein for details). Additionally, these bimodality effects produce a bias when ratios and logarithm quantities computed by synthesis codes are compared with observed data (but such a bias is not present for quantities like luminosities even for “clusters” with only 1 star). This subject is addressed in Cerviño & Valls-Gabaud (submitted).
0.3 Discussion
Statistical effects may be specially relevant (i) In the analysis of individual systems. In particular for the galaxy building blocks if they are small clusters. (ii) In the analysis of the integrated spectra obtained with high-resolution instruments when not all the region is covered by the slit. (iii) In chemical evolutionary models (Cerviño & Mollá, submitted), as far as they are dependent on the yields production form Supernovae that are intrinsically “rare” events. (iv) In the analysis of surveys, in special for the case of galaxies with emission lines produced by massive stars, that are intrinsically a small fraction of the total number of stars but dominate the emission…. In all these cases, the use of multiwavelength observations and self-consistent synthesis models that includes such statistical effects and computes the correlation between different wavelengths will be an asset to constrain safely the physical properties of stellar systems (form small star forming regions to high-redshift galaxies). The current model outputs can be found in http://www.laeff.esa.es/mcs/SED/.
References
- [Bruzual¡2001¿] Bruzual, G. 2001 in Extragalactic Star Clusters, IAU Symp. 207, E.K. Grebel, D. Geisler & D. Minniti (eds.), in press
- [Cerviño et al.¡2000¿] Cerviño, M., Luridiana, V., & Castander, F.J. 2000, A&A, 360, L5
- [Cerviño et al.¡2001¿] Cerviño, M., Gómez-Flechoso, M.A., Castander, F.J., Schaerer, D., Mollá, M., Knödlseder, J., & Luridiana, V. 2001, A&A, 376, 422
- [Cerviño et al.¡2002¿] Cerviño, M., Valls-Gabaud, D., Luridiana, V. & Mas-Hesse, J.M. 2002, A&A, 381, 51