Detection of superhumps in XTE J1118+480 approaching quiescence
Abstract
We present the results of our monitoring of the halo black-hole soft X-ray transient (SXT) XTE J1118+480 during its decline to quiescence. The system has decayed 0.5 mags from December 2000 to its present near quiescent level at R18.65 (June 2001). The ellipsoidal lightcurve is distorted by an additional modulation that we interpret as a superhump of =0.17049(1) d i.e. 0.3% longer than the orbital period. This implies a disc precession period 52 d. After correcting the average phase-folded light curve for veiling, the amplitude difference between the minima suggests that the binary inclination angle lies in the range . However, we urge caution in the interpretation of these values because of residual systematic contamination of the ellipsoidal lightcurve by the complex form of the superhump modulation. The orbital–mean H profiles exhibit clear velocity variations with 500 km/s amplitude. We interpret this as the first spectroscopic evidence of an eccentric precessing disc.
keywords:
stars: accretion, accretion discs – binaries:close – stars: individual (XTE J1118+480) – X-rays: stars1 Introduction
XTE J1118+480 is an important SXT for a number of reasons. It is at high
galactic latitude () which makes it the first halo black-hole
binary, since it must be at 1 kpc above the galactic plane
[Wagner at al. 2001, Mirabel et al. 2001]. The low interstellar absorption allows for
detailed multi-wavelength studies during outburst. The energy distribution
from IR to UV is consistent with a combination of an optically thick disc
plus synchrotron emission, whereas the EUV to X-ray spectrum is reminiscent
of the low (hard) state of SXTs [Hynes et al. 2000]. Since compared to typically 500 for galactic low mass X-ray binaries
(LMXBs), it has been suggested that it may be an Accretion Disc Corona (ADC)
source seen at high inclination [Garcia et al. 2000]. However, the detection of
X-ray, UV and optical QPOs at 0.08 Hz suggest that the inner disc is directly
visible. The UV variability lags the X-rays by 1-2 s, consistent with
reprocessing in the accretion disc [Haswell et al. 2000]. The optical rise to
outburst preceded the X-ray rise by 10 d which allowed the size of the
advective corona to be constrained to Schwarzschild
radii [Wren et al. 2001]. The radial velocity curve of the companion star and the
large mass function (6.1 0.3 M⊙) demonstrates that XTE
J1118+480 contains a black hole [McClintock et al. 2001, Wagner at al. 2001]. Finally, the
rotational velocity of the companion star implies a mass ratio of
q=0.0370.007 [Orosz 2001].
Optical superhumps were observed during the outburst, changing shape and
period [Uemura et al. 2000a]. Superhumps are optical modulations first discovered
in Dwarf Novae superoutbursts with a period a few percent longer than the
orbital period and a non-sinusoidal shape. Since then, this phenomenon has
been seen in decaying novae, AM CVn systems and novalike variables. Both the
amplitude and shape of the superhump modulation change while the outburst
declines. The most promising models in explaining the superhump behaviour
assume that the accretion disc expands, due to the action of viscosity, to
the 3:1 resonance radius and the eccentric disc is then forced to precess by
perturbations from the secondary (e.g. Whitehurst & King, 1991). Superhump
lightcurves can be explained by changes in the disc luminosity associated
with the periodic deformation of the disc shape (e.g. Simpson & Wood,
1998). Since the resonance is only possible for small mass ratios,
superhumps should also appear in SXTs, as has been confirmed by O’Donoghue &
Charles (1996). Furthermore the strongest resonance (2:1) requires very
extreme mass ratios (q0.025) which might be reached in some SXTs such as
J1118+480 as we will discuss here.
In this paper we present the detection of superhumps in XTE J1118+480 when the system was approaching the quiescent state. This discovery provides the first solid evidence of a precessing disc in a SXT near quiescence. Superhumps in dwarf novae were traditionally thought never to be present in quiescence but recent observations [Patterson et al. 1995] have shown that superhumps can indeed persist into quiescence after a superoutburst has ended. The case of XTE J1118+480 may be analogous behaviour in the SXTs. A preliminary analysis of these data was reported in Casares et al. (2001).
2 Observations and data reduction
2.1 Photometry
J1118+480 was observed for a total of 53 nights in the period December 2000–June 2001, during the time when the system was approaching quiescence, mainly in the –band with six different telescopes:
the 0.82 m (IAC80) and the 1 m Optical Ground Station (OGS) telescopes, equipped with identical Thomson CCD cameras and using exposure times ranging from 300 to 1200 s , at Observatorio del Teide (Tenerife). The IAC80 and OGS were operated simultaneously for two whole nights in order to obtain – colour information.
the 2.5 m Nordic Optical Telescope (NOT) and the 1 m Jacobus Kapteyn Telescope (JKT) at Observatorio del Roque de los Muchachos (La Palma). The data at the NOT, which have the best time resolution, were taken with ALFOSC with exposure times of 30 and 60 s. At the JKT we used exposure times ranging from 90 to 600 s with the SITe2 detector.
the 1.3 m McGraw-Hill Telescope (MGHT) at the MDM111The MDM observatory is a joint facility of Dartmouth College, The University of Michigan, Columbia University and the Ohio State University. Observatory (Arizona) and the 1.55 m Kuiper Telescope of the University of Arizona on Mount Lemmon. Photometry in the band was obtained with the Kuiper using the 2k2k CCD camera (2kBigCCD) and in band with the McGraw-Hill Telescope and 2k2k Echelle CCD camera. The exposure time for both sets was 300 s and the seeing was typically 0.8–1.5 arcsec.
In all cases we used 22 pixel binning to improve the readout time.
In Table 1 we present a log of the observations.
In total, the target was observed for over 70 orbital cycles. The individual images were de-biased and flat-fielded in the standard way, with the data reduction being performed within iraf222iraf is distributed by the National Optical Astronomy Observatories, which is operated by the Association of Universities for Research in Astronomy, Inc., under contract with the National Science Foundation.. The instrumental magnitudes were obtained using PSF photometry with the iraf routine daophot [Stetson 1987] or optimal photometry [Naylor 1998] using the Starlink photom package. Differential light curves were constructed relative to a nearby comparison star. Light curves of this comparison star with respect to others were also obtained in order to check for variability from which we estimate that our differential photometry is accurate to 1 per cent in all observations.
| Night | Telescope | Filter | Exposure time (s) | Coverage (cycles) |
|---|---|---|---|---|
| 2000 Dec 13 | IAC80 | R | 600 | 0.97 |
| 2000 Dec 14 | IAC80 | R | 600 | 1.01 |
| 2000 Dec 28 | IAC80 | R | 600 | 1.22 |
| 2001 Jan 09 | IAC80 | R | 600 | 0.50 |
| 2001 Jan 11 | IAC80 | R | 600 | 0.97 |
| 2001 Jan 19 | IAC80 | R | 600 | 0.80 |
| 2001 Jan 27 | IAC80 | R | 600 | 0.93 |
| 2001 Jan 31 | IAC80 | R | 600 | 1.89 |
| 2001 Feb 01 | IAC80 | R | 600 | 1.76 |
| 2001 Feb 02 | IAC80 | R | 1200 | 1.58 |
| 2001 Feb 03 | IAC80 | R | 900 | 1.76 |
| 2001 Feb 04 | IAC80 | R | 600 | 1.35 |
| 2001 Feb 24 | IAC80 | R | 600 | 1.01 |
| 2001 Feb 27 | IAC80 | R | 600 | 0.34 |
| 2001 Mar 07 | IAC80 | R | 1200 | 1.16 |
| 2001 Mar 08 | IAC80 | R | 600 | 1.01 |
| 2001 Mar 09 | IAC80 | R | 600 | 0.97 |
| 2001 Mar 10 | IAC80 | R | 600 | 1.08 |
| 2001 Mar 11 | IAC80 | R | 600 | 1.76 |
| 2001 Mar 18 | Kuiper | I | 300 | 1.50 |
| 2001 Mar 19 | Kuiper | I | 300 | 1.69 |
| 2001 Mar 20 | Kuiper | I | 300 | 1.37 |
| 2001 Mar 21 | Kuiper | I | 300 | 1.69 |
| 2001 Mar 25 | IAC80 | R | 600 | 1.87 |
| 2001 Mar 26 | IAC80 | R | 600 | 1.64 |
| 2001 Mar 28 | IAC80 | R | 600 | 1.91 |
| 2001 Apr 01 | NOT | R | 30 | 2.02 |
| 2001 Apr 02 | NOT | R | 60 | 1.34 |
| 2001 Apr 04 | IAC80 | R | 600 | 1.01 |
| 2001 Apr 05 | OGS | R | 300 | 0.83 |
| 2001 Apr 06 | OGS | R | 300 | 1.68 |
| 2001 Apr 07 | OGS | I | 300 | 1.76 |
| 2001 Apr 08 | OGS | R | 300 | 2.23 |
| 2001 Apr 09 | OGS, IAC80 | R, I | 420, 420 | 1.85, 1.75 |
| 2001 Apr 10 | OGS, IAC80 | R, I | 420, 600 | 2.00, 1.60 |
| 2001 Apr 11 | IAC80 | R | 600 | 1.83 |
| 2001 Apr 12 | IAC80 | R | 600 | 1.60 |
| 2001 Apr 13 | IAC80, MGHT | R, R | 600, 300 | 1.90, 1.59 |
| 2001 Apr 14 | MGHT | R | 300 | 1.26 |
| 2001 Apr 15 | MGHT | R | 300 | 0.89 |
| 2001 Apr 16 | MGHT | R | 300 | 1.72 |
| 2001 Apr 17 | MGHT | R | 300 | 1.69 |
| 2001 Apr 20 | JKT | R | 90–120 | 0.50 |
| 2001 Apr 22 | JKT | R | 90 | 1.86 |
| 2001 Apr 23 | JKT | R | 600 | 0.27 |
| 2001 Apr 24 | JKT | R | 90–600 | 1.77 |
| 2001 Apr 25 | JKT | R | 90–180 | 1.21 |
| 2001 Apr 27 | JKT | R | 180 | 1.12 |
| 2001 Apr 28 | JKT | R | 300 | 1.70 |
| 2001 May 29 | IAC80 | R | 600 | 0.88 |
| 2001 May 30 | IAC80 | R | 1200 | 0.91 |
| 2001 Jun 12 | OGS | R | 600 | 0.64 |
| 2001 Jun 26 | IAC80 | R | 600 | 0.25 |
2.2 Spectroscopy
We observed J1118+480 using the blue channel CCD spectrograph on the 6.5 m
Multiple Mirror Telescope333MMT is operated as a joint facility of the
Smithsonian Institution and the University of Arizona by the Multiple Mirror
Telescope Observatory. (MMT) at Arizona, on the nights of 2000 Nov 20, 30
and 2001 Jan 4. The seeing was typically 1 arcsec and a 1 arcsec wide slit
was employed. Each 1440 s exposure was bracketed by a HeNeAr lamp spectrum
which led to a wavelength calibration accurate to 5–7 km s-1
rms. Spectra were also obtained on 2001 Jan 12, with the ISIS red channel of
the 4.2 m William Herschel Telescope (WHT) at Observatorio del Roque de los
Muchachos (La Palma). The slit width was 1.5 arcsec and wavelength
calibration was checked with respect to night–sky emission lines to be
within 10 km s-1. Further details of these observations can be found
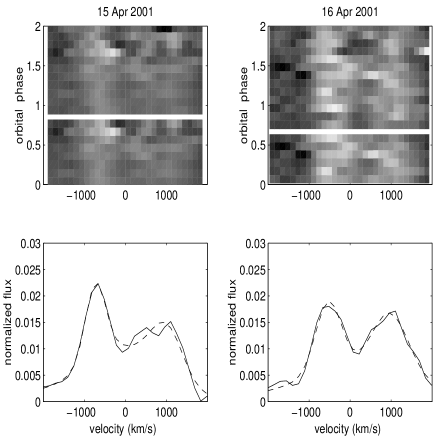
in Wagner et al. 2001; A further 29 spectra were taken on 15 and 16 Apr 2001
with the Steward Observatory 2.3 m Bok Telescope on Kitt Peak equipped with
the B&C Spectrograph. A 400 line mm-1 grating and 1.5 arcsec wide
entrance slit were employed which yielded spectra covering the spectral region
4100-7400 Å at a spectral resolution of 5.5 Å. The exposure time was
1400 s in typically 1.4 arcsec seeing and photometric conditions. The
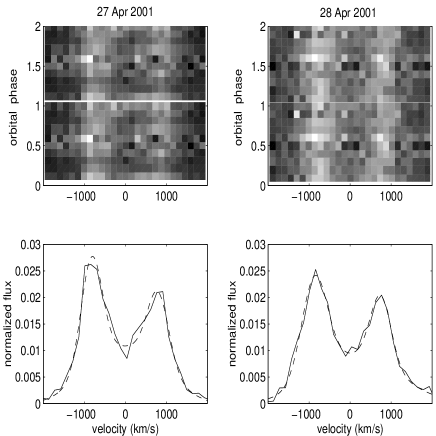
spectroscopic dataset was completed with 49 spectra obtained on 27 and 28 Apr
2001 on the 4.2 m WHT using the ISIS red arm. A narrow slit (0.8 arcsec)
aligned with the parallactic angle and with no comparison star in the slit,
was used in combination with a 1200 line mm-1 grating. The wavelength
calibration derived from arc lamps was checked against night sky lines and
was accurate to 1 km s-1 (see table 2).
Standard iraf procedures were used to de–bias the images and to remove the small scale CCD sensitivity variations. One dimensional spectra were extracted using the optimal extraction method [Horne 1986]. Where possible we performed flux calibration relative to other stars on the slit. Absolute photometric calibration was not attempted due to slit losses.
| Night | Telescope | Wavelength | Resolution | Exposure | Number |
|---|---|---|---|---|---|
| range (Å) | (Å/pix) | (s) | of spectra | ||
| 2000 Nov 20 | MMT | 4200–7500 | 1.1 | 1440 | 5 |
| 2000 Nov 30 | MMT | 4200–7500 | 1.1 | 1440 | 9 |
| 2001 Jan 04 | MMT | 4200–7500 | 2.50 | 1440 | 6 |
| 2001 Jan 12 | WHT | 5820–7320 | 1.47 | 1200 | 7 |
| 2001 Apr 15 | Bok | 4100–7400 | 2.75 | 1400 | 14 |
| 2001 Apr 16 | Bok | 4100–7400 | 2.75 | 1400 | 15 |
| 2001 Apr 27 | WHT | 6300–6700 | 0.41 | 340–1000 | 23 |
| 2001 Apr 28 | WHT | 6300–6700 | 0.41 | 340–1000 | 26 |
3 Period analysis
In Figure 1 we present the overall –band lightcurve (nightly means) which
shows that the system has been steadily fading from its April 2000 outburst
with a decay rate of 0.003 mag day-1. After 25 Apr 2001 the rate of
decay slowed and on 12 Jun 2001 the system was found at
=18.6500.007. The same magnitude was found, within the errors, on 26
Jun, so we suggest that this is the true quiescent magnitude. It is also
consistent, within the errors, with the magnitude from the usno
A2.0 catalogue, where it is quoted as =18.8 with about 0.25 mag
accuracy. Superimposed on the smooth decay, we also see substantial night to
night variability.
Close inspection of the individual light curves shows the dominant
ellipsoidal modulation of the companion star and a distortion wave which
progressively moves across the orbital light curve. The distortion wave
produces dramatic changes in the symmetry and minima in the light curves (see
Fig. 4). As the distortion wave is most probably non-sinusoidal
in nature we employed the PDM algorithm to separate and analyze the different
periodicities present in the data.
We detrended the long-term variations by subtracting the nightly means from
the individual lightcurves. This removed the low frequency peaks from our
PDM spectrum in the top panel of Fig. 2 (computed in the frequency
range 3 to 30 cycles d-1 with a resolution of
cycles d-1 and with 25 phase bins). The deepest minima are found at
5.885 cycles d-1 and cycles d-1 which correspond to the
orbital period (i.e. 0.169936 d) and the first harmonic respectively. A
two-component Fourier series (with ; a first-order
approximation to the ellipsoidal modulation of the secondary star) was fitted
to the detrended lightcurve. The fit yielded d and , where corresponds to
inferior conjunction of the companion star.
The bottom panel in Fig. 2 shows the PDM spectrum after subtracting these two Fourier components ( and ). A strong signal is found at cycles d-1 and its harmonics. The fundamental frequency corresponds to 0.17049(1) d, 0.3% longer than the orbital period. Note that this period is comparable to periodicities reported during outburst [Uemura et al. 2000b] and hence we interpret it as the superhump period caused by a precessing eccentric disc. We note this is the first secure evidence of superhumps near quiescence in an SXT.
The light curve of the superhump was obtained through the following
procedure: first we detrended the overall ellipsoidal lightcurve by
subtracting the nightly mean magnitudes and then phase–folded it into 50
phase bins. This was fitted with a simple ellipsoidal model, fixing
and (see top panel in Fig. 3). The
ellipsoidal fit was subtracted from the overall (detrended) lightcurve and
the residuals were then folded into 50 bins using the superhump period of
0.17049d (bottom panel of Fig. 3). The lightcurve is clearly
non-sinusoidal, and shows a peculiar modulation which explains why the PDM
spectrum contained substantial power at the first and third harmonics. The
shape is clearly different from the superhumps detected in other SXTs during
outburst (e.g. O’Donoghue & Charles 1996). However, we note that our data
were taken when J1118+480 was near true quiescence when such features are not
usually visible. A clear evolution of the superhump from single humped
modulation to a more complex shape had already been observed when the system
started its decline444see the lightcurves in
http://www.kusastro.kyoto-u.ac.jp/vsnet/Xray/xtej1118-camp.html. Peculiar
superhump modulations, showing several peaks and dips are often detected in
cataclysmic variables (CVs) and their origin remains unsolved (e.g. V603
Aql, Patterson et al. 1993; V503 Cygni, Harvey et al. 1995; H 0551-819,
Patterson 1995).
Fig. 4 contains nightly lightcurves with superimposed model fits of a simple ellipsoidal lightcurve (dashed line) and a combination of ellipsoidal modulation plus superhump wave (continuous line) . The superhump wave was simulated by a four term Fourier series fixing the superhump period at Psh=0.17049 d. The second model is clearly a much more accurate representation of the observed lightcurves, with =1.71 vs =3.08. If the superhump modulation is due to tidal interactions in an elliptical precessing disc, and if the disc’s radius shrank as the system faded (as is shown in Fig. 1), we expect the shape and amplitude of the superhump modulation to change and even vanish if the disc radius decreases below the stability radius.
4 The ellipsoidal modulation
The ellipsoidal light curve of the secondary star was phase folded and binned into 30 bins using our updated ephemeris (see section 3). It can be seen from Fig. 3 that the light curve of the superhump modulation is far from simple. It is clear that this will distort the ellipsoidal light curve, rendering it difficult to interpret since the superhump modulation could introduce false features in the light curve. This makes it very difficult to interpret any parameters derived from fitting the contaminated light curve. However, we can use the observed amplitude of the modulation and an estimate for the veiling in order to to place limits on the binary inclination.
The veiling for the photometric observations taken in April 2001 can be estimated by extrapolating the spectroscopic veiling observed in Jan 2001 (Wagner et al. 2001). J1118+480 decreased by 0.30 mags from Jan 2001 to April 2001. If we assume that this decrease in flux is solely due to the accretion disc light fading, then given the observed veiling in Jan 2001 of 67%, we estimate the veiling in April 2001 to be 53%. This value agrees very well with the veiling estimated from the high resolution WHT spectra taken in April 2001; 477%, obtained using the standard optimal subtraction technique (Marsh, Robinson & Wood 1994) for K5–M4 type template stars.
The large amplitude of the observed modulation strongly suggests that the inclination angle is high, but the lack of eclipse features at phase 0.0 requires i82 degrees (also note that no X-ray eclipses were seen during outburst). The difference between the two minima at phase 0.0 and phase 0.5 in the observed light curve is 0.076 mags. However, we have already noted that the observed light is heavily veiled (477%) and so the true amplitude is in the range 0.127–0.165 mags. We have computed the secondary star’s ellipsoidal modulation assuming a K7 secondary star (=4250 K and =5.0; Wagner et al. 2001) and =0.037 [Orosz 2001] using an irradiated X–ray binary model (for details see Shahbaz, 2002). By comparing the corrected amplitude with the calculated, we estimate an inclination angle in the range 71–84 degrees. Combined with the lack of eclipses this suggests that lies in the range 71–82 degrees.
For more accurate results we would need to model the light curves free from the superhump modulation. However, deconvolving the two modulations is very difficult because in order to do so we have to be confident we have determined the ‘clean’ ellipsoidal light curve. This is only possible once we are sure that the system is completely in quiescence at which time we expect the amplitude of the superhump to be reduced.
5 VARIABILITY
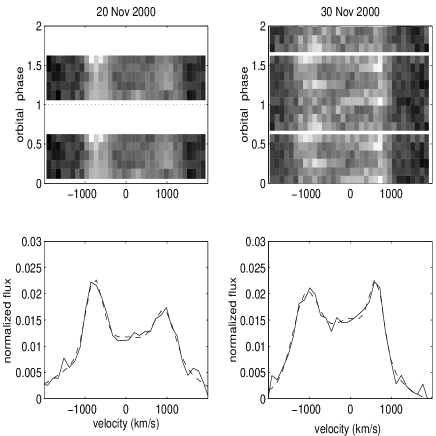
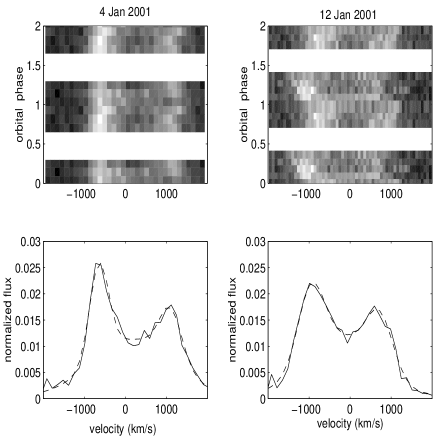
Our spectra are dominated by strong double-peaked Hα emission which exhibits significant time variability both in velocity and width. Some nights, for instance, the H centroid and FWHM are modulated with the orbital period whereas other nights are consistent with a double sine-wave modulation. In addition, the FWHM and line centroid is seen to vary by a few hundred km s-1 from night to night. Although near quiescence, the accretion disc still contributes significantly to the observed optical emission and we see a 0.5 mag fading in the course of our campaign. This is well depicted by the equivalent width evolution of the H emission line, which shows a continuous rise of 0.14 Å day-1 due to the continuum decay (Fig. 5). We also note that the H line moves dramatically from night to night as is shown in Fig. 6 and Fig. 7. Here a three–component Gaussian fit to the nightly averaged profiles was performed, consisting of a broad base and two narrow peaks. The line is clearly asymmetric with the blue peak persistently stronger than the red one. We have computed the position of narrow peaks and the line centroids given by our fits to the averaged profiles, to measure the real line velocity change and not the flux weighted centroids. The line centroids move from night to night with variations of 500 km/s amplitude. If the nightly drifts of the emission lines are due to an eccentric disc projecting different amounts of its area at different precessing phases, we would expect the variation is modulated with a half of the precession period (26 days). The line centroids are consistent with this period with minimum (showing in Fig. 5, top panel), although we note that our spectroscopic sample is not sufficient to rule out a 52 d period (also shown in Fig. 5).
6 DISCUSSION
This paper presents evidence for an eccentric precessing disc in J1118+480 during Dec 2000 – June 2001. Although persistent superhumps have been detected in several extreme mass ratio CVs (i.e. Skillman & Patterson 1993) and there is some evidence for a superhump in the SXT A0620-00 during quiescence [Haswell 1996], this is, to our knowledge, the most extensive study of a precessing disc in SXTs near quiescence. Our lightcurve shows the fingerprint of a distorting superhump modulation with d superimposed on the classical ellipsoidal modulation of the secondary star. A superhump modulation with d was already detected in April 2000, when the system was at the peak of its outburst [Uemura et al. 2000b]. This implies a superhump period change of which is slower but comparable to typical values in SU UMa stars (Warner 1985). Since the superhump is the beat frequency between the orbital and disc precession frequency, the disk precession period is, therefore given by d.
The superhump period contains information on the mass ratio . We can use the relation of Mineshige, Hirose & Osaki 1992 (hereafter M92) to estimate the mass ratio:
| (1) |
where is the period excess and is the disc radius in terms of of the critical disc radius for the 3:1 resonance. If we take P d [Uemura et al. 2000b] as the true superhump period at outburst peak and the empirical value (see M92), we find 0.028. A similar result is obtained using Patterson’s (2001) relation, i.e.,
| (2) |
For in the range 0.04–0.30 he finds
| (3) |
for systems with accurate determinations for (i.e. ). Extrapolating the above expression to J1118+480 we find q=0.0230.002. This implies the most extreme mass ratio in this class, although we note that for the 2:1 resonance rather than the classical 3:1 resonance would be the dominant tidal instability (Whitehurst & King 1991).
The mass ratio has been determined spectroscopically by Orosz (2001) using
the rotational broadening of the secondary stars photospheric absorption
lines; . This is comparable to, but less extreme than, the
mass ratio determined using the superhump period excess, but we note that the
former is dominated by our assumption for , thus refined calibrations
at the highest and lowest P, in eq. 2 are needed.
In this sense J1118+480 is a key system in the study of superhumps, since it
allows us to extrapolate the 3:1 resonance instability close to the limit
where the 2:1 resonance should start to dominate. In Fig. 8
we show the -q values for SXTs (O’Donoghue & Charles 1996 and this
paper) and CVs (Patterson 2001; Molnar & Kobulnicky 1992 and references
therein), including only those systems with reliable determinations.
J1118+480 seems to agree well with both theoretical -q curves for
.
The nightly mean Hα profiles are shown to move by up to 250
kms-1, an effect which has not been seen before in any SXT or CV. This
behavior is probably driven by the changing asymmetric disc brightness
distribution also seen in our trailed spectra. If the effect we are seeing is
the spectroscopic signature of an eccentric disc in J1118+480 precessing on a
period of 52 d, we would expect a modulation consistent with this period as
we can see in Fig. 5. In addition, the FWHM of the Hα
line changes by a few hundred km s-1 both with the orbital and
precession phase. Since the FWHM gives a measurement of the velocity
dispersion in the disc, the observed variability is probably related to
changes in the disc’s shape, since the eccentric disc presents differing
aspects of its projected area to the observer on both the superhump and
precession periods.
7 Acknowledgments
We are grateful to the IAC support astronomers who undertake the Service Programme at Izaña for obtaining some of the lightcurves that were used in this analysis. We also thank R. Corradi for taking the WHT spectra on Jan 9 and Brian McLean for agreeing to swap JKT nights so that simultaneous WHT–JKT coverage was possible and for helping to obtain some of the JKT observations. The WHT and JKT are operated on the island of La Palma by the ING. NOT is operated on the island of La Palma jointly by Denmark, Finland, Iceland, Norway, and Sweden, in the Spanish Observatorio del Roque de los Muchachos of the Instituto de Astrofisica de Canarias. The IAC80 and OGS telescopes are operated on the island of Tenerife by the IAC in the Spanish Observatorio de Izaña. TS acknowledges support by a Marie Curie fellowship HP-MF-CT-199900297. RIH and PAC acknowledge support for grant F/00-180/A from the Leverhulme Trust. SGS also acknowledges support from NSF and NASA aparts to ASU.
References
- [Casares et al. 2001] Casares J., Zurita C., Shahbaz T., Rodriguez–Gil P., Charles P., Hynes R.I., Wagner R.M., Ryan E., Foltz C., Starrfield S., 2001, IAUC, 7617
- [Garcia et al. 2000] Garcia,M., Brown, W., Pahre M., McClintock J., Callanan P., Garnavich P., 2000, IAUC 7392
- [Harvey et al. 1995] Harvey D, Skillman D.R., Patterson J., Ringwald F.A., 1995, PASP, 107, 551
- [Haswell et al. 2001] Haswell C.A., King A.R., Murray J.R., Charles P.A., 2001, MNRAS, 321, 475
- [Haswell et al. 2000] Haswell C.A., Skillman D., Patterson J., Hynes R.I., Cui W., 2000, IAUC 7427
- [Haswell 1996] Haswell C.A., 1996, IAU Symp. 165: Compact Stars in Binaries, 165, 351
- [Horne 1986] Horne K., 1986, PASP, 98, 609
- [Hynes et al. 2000] Hynes R.I., Mauche C.W., Haswell C.A., Shrader C.R., Cui W., Chaty S., 2000, ApJ, 539, L37
- [Kuulkers 2001] Kuulkers, E. 2001 (astro-ph/0102066)
- [Lucy 1966] Lucy L.B., 1966, Zeitschrift Astrophysics, 65, 89
- [Marsh & Horne 1988] Marsh T.R., Horne K., 10988, MNRAS, 235, 269
- [Marsh, Robinson & Wood 1994] Marsh T.R., Robinson E.L., Wood, J.H, 1994, MNRAS, 266, 137
- [McClintock et al. 2001] McClintock J.E., Garcia M.R., Caldwell N., Falco E.E., Garnavich P.M., Zhao P., 2001, ApJ, 551, L147
- [Mineshige 1992] Mineshige S., Hirose M., Osaki Y., 1992, PASJ, 44, L15
- [Mirabel et al. 2001] Mirabel I.F., Dhawan V., Mignani R.P., Rodrigues I., Guglielmetti F., 2001, Nature, 413, 139
- [Molnar & Kobulnicky 1992] Molnar L.A., Kobulnicky H.A., 1992, ApJ, 392, 678
- [Naylor 1998] Naylor T., 1998, MNRAS, 296, 339
- [Neustroev et al. 2001] Neustroev V.V., Borisov N.V., Barwig H., Bobinger A., Mantel K.H., imić D., Wolf S., 2001, astro-ph/0110111
- [O’Donoghue & Charles 1996] O’Donoghue D., Charles P.A., 1996, MNRAS, 282, 191
- [Orosz 2001] Orosz J.A., 2001, ATEL 67
- [Osaki 1985] Osaki Y., 1985, A&A, 144, 369
- [Patterson 2001] Patterson J., 2001, PASP, 113, 736
- [Patterson 1995] Patterson J., 1995, PASP, 107, 657
- [Patterson et al. 1995] Patterson J., Jablonski F., Koen C., O’Donoghue D., Skillman D.R., 1995, PASP, 107, 1183
- [Patterson 1993] Patterson J., Thomas G., Skillman D.R., Diaz M.P., 1993, ApJS, 86, 235
- [Shahbaz et al. 2002] Shahbaz T. et al., 2002, in preparation
- [Simpson & Wood 1998] Simpson J.C, Wood M.A., 1998, ApJ, 506, 360
- [Skillman & Patterson 1993] Skillman D.R., Patterson J., 1993, ApJ, 417, 298
- [Stellingwerf 1978] Stellingwerf R.F., 1978, ApJ, 224, 953
- [Steeghs et al. 1997] Steeghs D., Harlaftis E.T., Horne K. 1997, MNRAS, 290, L28
- [Stetson 1987] Stetson P.B., 1987, PASP, 99, 191
- [Thorstensen & Taylor 1997] Thorstensen J.R., Taylor C.J., 1997, PASP, 109, 1359
- [Torres et al. 2001] Torres M.A.P et al., 2001, ApJ, submitted
- [Uemura et al. 2000a] Uemura M., Kato T., Matsumoto K., Honkawa M., Cook L., Martin B., Masi G., Oksanen A., Moilanen M., Novak R., Sano Y., Ueda Y., 2000, IAUC 7418
- [Uemura et al. 2000b] Uemura M., Kato T., Matsumoto K., Yamaoka H., Takamizawa K., Sano Y., Haseda K., Cook L.M., Buczynski D., Masi G., 2000 PASJ, 52, L15
- [Wagner at al. 2001] Wagner R.M., Foltz C.B., Shahbaz T., Casares J., Charles P.A., Starrfield S.G., Hewett P., 2001, ApJ, 556, 42
- [Warner 1985] Warner B., 1985, in Eggleton P.P., Pringle J.E., eds., Interacting Binaries. Reidel, Dordrecht, p. 367
- [Whitehurst & King 1991] Whitehurst R., King A.R., 1991, MNRAS, 249, 25
- [Wren et al. 2001] Wren J., Akerlof C., Balsano, R., Bloch J., Borozdin K., Casperson D., Gisler G., Kehoe R., Lee B.C., Marshall S., McKay T., Priedhorsky W., Rykoff E., Smith D., Trudolyubov S., Vestrand W.T., 2001, astro-ph/0105420