The luminosity function of the Virgo Cluster from to
Abstract
We measure the galaxy luminosity function (LF) for the Virgo Cluster between blue magnitudes and from wide-field CCD imaging data. The LF is only gradually rising for . Between and it rises steeply, with a logarithmic slope . Fainter than , the LF flattens again. This LF is shallower (although turning up at brighter absolute magnitudes) than the -band LF recently measured by Phillipps et al. (1998a), who found fainter than . It is similar, however, to the LF determined from the Virgo Cluster Catalog by Sandage et al. (1985). A few faint galaxies are found which Sandage et al. missed because their surface-brightness threshold for detection was too high, but these do not dominate the luminosity function at any magnitude. Most of the faint galaxies we find are dwarf elliptical, alternatively called dwarf spheroidal, galaxies. The most important potential source of systematic error is that we may have rejected some high surface-brightness galaxies from the cluster sample because we think that they are background galaxies. This is quite different from what has conventionally been regarded as the most serious source of systematic error in this kind of study: that we are missing many low surface-brightness galaxies because they are never visible above the sky.
There are about 2.5 times more dwarfs per giant galaxy in Virgo than in the Ursa Major Cluster, a diffuse group of about 80 spiral galaxies at the same distance as Virgo, or the Local Group. The Virgo and Ursa Major Cluster LFs are inconsistent with each other at a high level of significance. These results add weight to the hypothesis that is developing that dwarf galaxies are more common relative to giant galaxies in dense environments than diffuse ones. Both LFs are highly inconsistent with cold dark matter theory, which has been so successful at reproducing observations on large scales. Possible theoretical explanations for this discrepancy, and for the detailed shape of the Virgo Cluster LF, are investigated.
keywords:
galaxies: clusters: individual: Virgo – galaxies: luminosity function1 Introduction
The Virgo Cluster is one of only two elliptical-rich clusters within 25 Mpc, the other being the Fornax Cluster. It is near enough that even low luminosity galaxies appear quite big on the sky and can be identified and studied in some detail.
One arcsecond corresponds to about 0.1 kpc in Virgo, which is comparable to the scale-lengths of low–luminosity galaxies (Binggeli & Cameron 1991). What this means is that if we see a galaxy in the Virgo Cluster with a size of several arcseconds, it is much likelier to be a low luminosity cluster member than a high luminosity background galaxy, since intrinsically lower luminosity galaxies have lower surface-brightnesses and consequently larger scale lengths (Binggeli 1994). A comparison of the joint apparent magnitude – surface-brightness distribution between the Virgo Cluster and blank sky fields therefore gives some indication of the low-luminosity galaxy content of the Virgo Cluster.
Sandage, Binggeli & Tammann (1985) measured the luminosity function of the Virgo Cluster using the Virgo Cluster Catalog (VCC; Binggeli, Sandage & Tammann 1985) and found a luminosity function that was gently rising at the faint end: where . They detected galaxies with total magnitudes (about ), although they estimated that their completeness limit was two magnitudes brighter than this: at , significant numbers of dwarfs have surface-brightnesses so low and scale-lengths so large that they were not detectable above the night sky in the photographic images used to compile the VCC. Following this work, Impey, Bothun & Malin (1988) discovered a number of low surface-brightness galaxies with missing from the VCC. They suggested that incompleteness at the faint end of the VCC might be very severe and that the LF could be as steep as . In a more recent development, Phillipps et al. (1998a) present evidence for large numbers of low-luminosity galaxies in the Virgo Cluster. They measure fainter than an absolute magnitude of . If the LF was this steep, Sandage et al. would have missed the vast majority of cluster members at the faint end, even after imposing their completeness corrections.
All these results suggest that the LF is very likely steeper in the Virgo Cluster than in diffuse spiral-rich groups and clusters. In the Local Group, where very faint absolute magnitudes () can be reached, the faint-end slope is (van den Bergh 1992, 2000). In the Ursa Major Cluster, a diffuse spiral-rich group at a similar distance to the Virgo Cluster, less faint absolute magnitudes can be reached, but large enough numbers of galaxies are present that a statistically robust LF can be computed. Here as well (Trentham, Tully & Verheijen 2001a). Evidence is therefore accumulating that low-luminosity galaxies are very much more numerous per luminous galaxies in dense environments than in diffuse ones.
Values of are of particular interest since this is the logarithmic slope of the low-mass galaxy mass function predicted by theory if the primordial fluctuation spectrum is a power law with index , as appropriate for cold dark matter (Press & Schechter 1974, White & Rees 1978, Lee & Shandarin 1999, Klypin et al. 1999). If this value of is appropriate for the Virgo Cluster, this would suggest that in this environment the efficiency of star formation in small galaxies does not depend on the galaxy mass, assuming cold dark matter theory (the problem of reproducing the shallow LF slope in the diffuse environments still remains; Moore et al. 1999; Klypin et al. 1999).
We now present the results of a survey of 25 square degrees of the Virgo Cluster (about one-tenth of the total area of the cluster) observed through the filter using the Wide Field Camera on the Isaac Newton Telescope on La Palma, taken as part of the INT Wide Field Survey. The intention is to get a reasonably complete (at least to the surface-brightness levels defined in the studies mentioned above) inventory of Virgo Cluster members. We can then construct a luminosity function from (the brightest galaxy in our sample was M87 with ) down to . This will permit us to address the following questions: (i) what is the value of , and does this vary significantly with absolute magnitude i.e. over what magnitude range can we approximate the LF by a power law? How sensitive is the answer to our ability to recognize cluster members based on surface-brightness: could we be missing many high surface-brightness members because we think that they are background galaxies or many low surface-brightness galaxies whose contrast against the sky is too low to allow us to identify them? (ii) what are the morphologies of the faintest galaxies? Most previous work (Sandage et al. 1985, Phillipps et al. 1998a) suggests that they are dwarf elliptical (alternatively called dwarf spheroidal) galaxies. This would imply that low surface-brightness irregular star-forming galaxies do not contribute significantly to the LF at the faint end as they do in the Ursa Major Cluster (Trentham et al. 2001a); (iii) do the results depend on the colour of the galaxies and the filter used? We, like Sandage et al., are using a filter. Phillipps et al. used a red filter. How much of the very substantial excess of galaxies they found could be due do this, given that dSph/dE galaxies tend to be red (Caldwell 1983)? (iv) are there substantial numbers of very low surface brightness (VLSB) galaxies, as seen in the Fornax cluster by Kambas et al. (2000)? In particular, as we approach the limiting surface brightness at which we can detect objects in our data, do we find more and more VLSB galaxies, and what is the their contribution to the total LF? We will need to quantify this in order to address the questions posed in (i) above; (v) how does the galaxy luminosity function depend on environment? We will compare our Virgo Cluster luminosity function to the -band luminosity functions of the Local Group, the Ursa Major Cluster, and the rich Coma Cluster at a distance of 90 Mpc. We will then have measurements of the LF in four very different environments. In the case of the Local Group, the LF has large uncertainties due to Poisson statistics. In the Coma Cluster the LF has large uncertainties due to the need to do a background subtraction. It is well-known (Dressler 1980) that the morphologies of galaxies depend on environment, specifically on the galaxy density. Our results will indicate whether or not the LF does too, over a large magnitude range.
2 Observations

The data used here were taken on various observing runs during Spring 1999 and Spring 2000 as part of the INT Wide Field Survey (WFS; http://www.ast.cam.ac.uk/∼wfcsur; McMahon et al. 2001). This is a digital survey covering about 100 deg2 of sky carried out using the Wide Field Camera (a mosaic of four 4K 2K EEV CCDs, pixel scale 0.33 arcsec pix-1, field of view 0.29 deg-2; http://www.ast.cam.ac.uk/∼wfcsur/ccd.html) on the 2.5 m Isaac Newton Telescope on La Palma.
A total of 113 fields in the Virgo Cluster were selected (see Fig. 1), comprising 24.9 deg2 taking into account overlaps between the images, which were typically 1 chip or 1/4 of the field of view. All fields were imaged through a (effective wavelength m) filter for 750 s under photometric conditions. A total of 31 deg2 from the WFS imaging survey of the North Galactic Cap (NGC), taken in photometric conditions with a filter, were also studied, these being used as offset fields to estimate the background contamination in the Virgo sample. The exposure times in (750 s) were the same for the Virgo and NGC data.
The data were pre-processed and reduced via the WFS pipeline (http://www.ast.cam.ac.uk/∼wfcsur/ pipeline.html; Irwin & Lewis 2001) and photometric calibration obtained from observations of several (5 – 10 per night) standard stars. The photometric zero points were always accurate to 2 %; uncertainties in the zero point are not a major source of uncertainty in the galaxy magnitudes that we derive. The median seeing was 1.95 arcseconds for the Virgo data and 1.26 arcseconds for the NGC data (since we will be searching for galaxies with large sizes and low surface-brightnesses, the relatively poor seeing of the Virgo data is not a major concern). For the Virgo data, the median 3 point source limiting magnitude was .
Of the 113 fields we studied, 9 of the fields were also imaged through a ( m) filter for either 600s or 1200 s under photometric conditions. This data was used to compute colours for a small number of galaxies in the sample. The median seeing in the dataset was 1.53 arcseconds FWHM.
3 Galaxy identification and selection

Initially an image detection algorithim developed by Irwin (1985, 1996) was run on the images. A source was defined to be 5 contiguous pixels with a flux signal-to-noise ratio of 1.5 above the sky. Generated parameters include the position, intensity and shape of each detected object. We used only the position information. Aperture magnitudes were subsequently calculated for all the sources using the IRAF APPHOT task with a local sky value measured for each object (typically the mode within an annulus of inner and outer radii 0.5 and 1.0 arcminutes centered on the object).
In our dataset we had about galaxies (about 2500/chip) with magnitudes within a 6 arcsecond aperture brighter than (here, as throughout the paper we use the notation to mean the magnitude within an aperture of radius arcseconds). In this section we describe how we identified which ones are likely to be Virgo Cluster members and assess how much confidence we should have in these identifications.
Many of the brightest galaxies (typically those with ) had spectroscopic velocity measurements available. For such objects we can identify with 100 % confidence which are members and which are not. We follow Binggeli et al. (1985) in assigning cluster membership to all galaxies with heliocentric velocities between 700 km s-1 and 2700 km s-1.
For the other galaxies, the situation is more complex. As outlined in Section 1, we expect dwarf galaxies in the cluster to have lower surface brightnesses (and consequently more extended light profiles) than background galaxies of the same apparent magnitudes. Morphologically we expect them to be either smooth (dwarf elliptical/spheroidal galaxies) or lumpy (dwarf irregulars) but not to have appreciable spiral structure or a distinctive bulge+disk morphology, both of which are characteristic of luminous giant galaxies (Binney & Merrifield 1997) which would here be background galaxies.
We used both surface-brightness and morphology to assess membership as follows. Firstly we compared the light concentrations of galaxies in the Virgo and background samples. For each galaxy we computed (following Trentham et al. 2001a) an inner concentration parameter (ICP) and an outer concentration parameter (OCP), defined as
The results are presented in Figure 2.
There is a clear excess of objects with and ICP in the Virgo fields that are not seen in the background fields. These are presumably Virgo cluster members. They have the correct sizes for dwarf galaxies seen at the distance of the Virgo Cluster since they are close to the dashed lines in the upper left panel of Figure 2. The scatter around the dashed lines is huge, however, particularly in the lower panels. The dependence on surface brightness of the location of galaxies in the panels in Figure 2 is complex. In general lower surface brightness galaxies have more extended light profiles yet it is not always true that lower surface-brightness galaxies always have more negative concentration parameters. In the lower panels very low surface brightness galaxies have very small differences between their 6-arcsecond and 12-arcsecond aperture fluxes since so much of the galaxy falls below the sky; if the galaxy is faint (as for galaxies at the right end of the dashed lines), the only difference between and is due to sky noise. This could lead to an OCP value that could be as high as ! Hence there is huge scatter at the faint end in the lower two panels. What all this means is that we must consider the and concentration parameter values in conjunction with each other when assessing membership i.e. in effect we must consider the entire light profile.
We therefore define a quantity
| (1) |
where (OCP′,(6)′) is the number of objects in the Virgo sample with 6-arcsecond aperture magnitudes within 0.5 mag of and an outer concentration parameter within 0.05 mag of OCP′ and an ICP value lower than 0.9 mag and (OCP′,B(6)′) is the equivalent number for the background fields. The factor of 1.25 comes from the relative area samples by our Virgo and background surveys. Defined this way is then an estimate of the probability that a particular galaxy is a cluster member or not.
For cluster members with velocity measurements, so we can have some confidence in using values to assess membership. But some grand-design spirals which are clearly background (these have very negative OCPs due to considerable amounts of star formation far from the galaxy centres) also have . Hence using values as a direct measure of membership is not completely safe. Other (related) reasons why we might be suspicious are: (1) The scatter in Fig. 2 around the dashed lines is large (see the previous discussion), so on an object-by-object basis, the uncertainty in is large. (2) Our background sample (even though it comprises about 30 deg2 of data) is not sufficiently large to compensate for shot noise and Poisson errors in (OCP′,B(6)′) in regions where the OCP values are large. For example, in the lower right panel of Figure 2, there are only three galaxies with an OCP . These are all low surface-brightness field galaxies. (3) The field-to-field variance of these low surface-brightness field galaxies is determined by large-scale structure at very low redshift and is consequently likely to be large. This makes the problem highlighted in (2) above more severe. For example, suppose for some combination of and OCP, we have 10 Virgo field galaxies with ICP mag and 3 background field galaxies. We would compute . We would therefore think that most of these galaxies are cluster members. But suppose large-scale structure at low redshift caused the field-to-field variance of these low surface-brightness galaxies to be a factor of four. Then the appropriate number of background galaxies with the relevant combination of parameters in the Virgo fields could now be twelve, not three. So should have been , which is negligible. With this value of , we would now think that most of these galaxies were not cluster members. In summary, until we have a characterization of the field-to-field variance of field galaxies as a function of surface-brightness, values of must be treated with caution.
So instead of relying solely on values, we further inspected each galaxy individually and made a judgment about the possibility of membership. We discarded galaxies showing obvious spiral structure and flat disk galaxies with a central bulge, even if their values were high, since these are almost certainly background giant galaxies (about 15% of the galaxies that we would have identified as possible members in the absence of any morphological information beyond averaged light profiles were rejected on these grounds). For each galaxy that did not have a velocity measurement that we thought might be a member we rated it (as was done in Trentham et al. 2001a) “1” or “2” depending on whether we thought it was a member with a high or moderate degree of confidence. The rating scheme is summarized in Table 1.
In making this analysis, we relied for the main part on values, but also on morphology, particularly in regions of parameter space which were poorly sampled in the background fields (see Point (2) above). Most objects rated “2” were galaxies of moderate surface-brightness where there was some overlap in parameter space between the background and Virgo; such galaxies were not rated “1” due to point (3) above.
|
There were a few additional complications resulting from this approach that required attention. 1) The Virgo images were taken under a variety of seeing conditions. In the worst conditions the seeing was 3 arcseconds. Galaxies in these images are slightly bigger and have less concentrated light profiles than galaxies in Virgo images taken under more typical conditions or in the background fields. We simulated galaxies and found that differences in due to seeing variations of this magnitude were negligible relative to other uncertainties; this is not surprising given that we are selecting low surface brightness galaxies that are typically much bigger than 3 arcseconds; 2) Occasionally galaxies of interest fell on cosmic rays or chip defects. Since all candidates on the images are being studied by eye (to assign ratings), it was easy to identify when this happened. In these cases, the cosmic ray or defect was removed by interpolation using the IRAF imedit task. All subsequent analysis was performed on the repaired images; 3) Some objects appeared in more than one exposure (the fields in Fig. 1 overlap). Occasionally these had very different concentration parameters from each other: one or the other might have fallen near a chip edge or defect. In this event we only used the measured parameters for the undamaged image. Otherwise data from both exposures were combined and used; 4) Often, on the initial detection pass, very low surface-brightness objects were detected as several separate objects, each centered on a local noise peak. These objects were identified upon inspection and all objects except the single object centered on the galaxy center removed from the catalogue. Subsequent photometry performed on this single object; 5) Similarly, on occasion where galaxies (typically dwarf irregular) had off-center hot-spots, the initial detection algorithm identified objects centered on these hotspots. In these cases, we recentered the galaxy and performed subsequent photometry on this recentered object; 6) Many objects have close companions that were identified upon inspection. The concentration parameters for such objects have little meaning. Total magnitudes were determined individually as described in Section 4; 7) A few objects, like IC 3483 (heliocentric velocity 108 km s-1), fell in the gaps between the CCDs and are missing from our catalogue, even though they are in the area outlined in Figure 1. This may also have happened for some lower luminosity galaxies. The survey area we quoted in the previous section includes a (small) correction for area lost in this way; 8) Two very high surface-brightness galaxies that look like background galaxies but have velocities which place them in the Virgo Cluster were included (a search for all objects with known velocities was performed using the NASA/IPAC Extragalactic Database, hereafter NED). The two objects were VCC 1313 (a blue compact dwarf) and VCC 1627 (a compact low-luminosity elliptical galaxy). Both lack a detectable low surface-brightness halo at large galactocentric radius, normally a defining characteristic of low-luminosity galaxies. Such galaxies are not common for (), but were they to be very common at , they would be missing from our sample and the LF that we determine would be incomplete at the faint end. We do not, however, regard this possibility as likely and return to this issue in Section 7; 9) Low surface-brightness features likely to be associated with luminous galaxies (whether cluster members or background) were judged not to be independent galaxies and removed from the catalogue. For example, there is a large stream of material flowing from the background galaxy pair IC 3481/A (heliocentric velocity km s-1) that we excluded because it is likely to be associated with these galaxies and not the Virgo Cluster. Similarly, M100 in the cluster is surrounded by considerable amounts of low surface-brightness material that we assume is associated with that galaxy and is not made up of individual cluster dwarfs; 10) For low surface-brightness objects that fell near the edge of a CCD, it was sometimes not clear if the centre of the object fell on the CCD or not and it is possible that we included objects that we should have rejected under point 7) above. However this happened rarely enough that it is not a significant source of error.
4 Galaxy sample
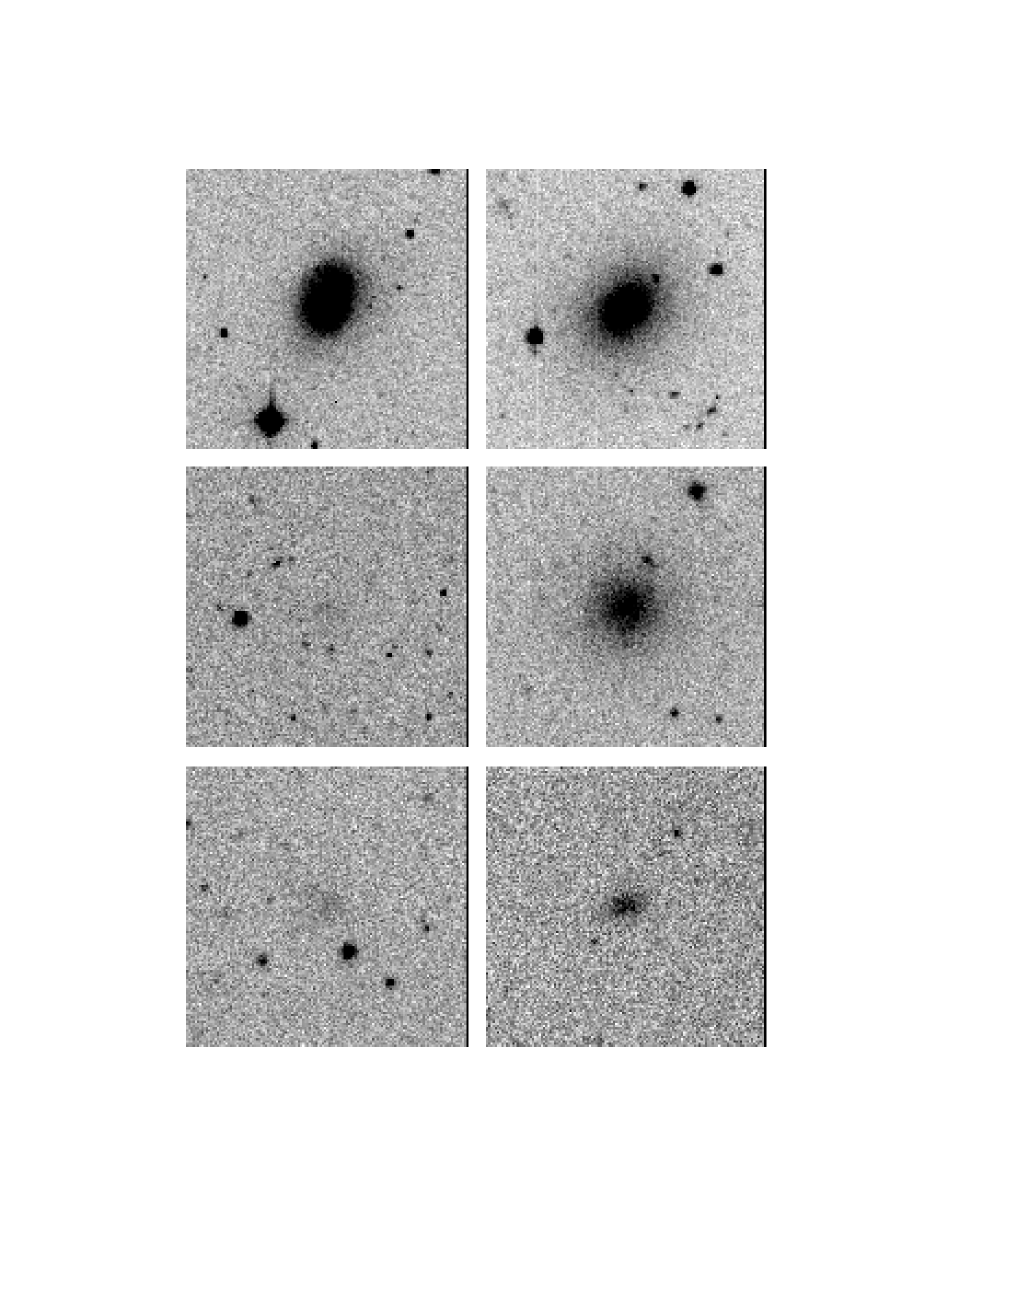
Our sample consists of 449 galaxies of which we rated 102 as “0”, 220 as “1”, and 127 as “2”. Images of typical galaxies in our sample are presented in Fig. 3.
The galaxy sample is presented in Table 2. There we list: (1) the galaxy identification number, ranked by . A single star by the name means that we identified a companion close enough that it would affect photometry measurements at radii from the galaxy centre but not at . Measurements of the OCP and for these galaxies are consequently not an indicator of the galaxy properties. A double star by the name means that we identified a companion close enough that it would affect photometry measurements at . Measurements of the , the ICP, OCP and for these galaxies are consequently not an indicator of the galaxy properties for these objects; (2) the galaxy name as appearing in the NASA/IPAC Extragalactic Database (NED). The VCC numbers refer to the Virgo Cluster Catalog (Binggeli et al. (1985) and the IBM88 designations refer to objects studied by Impey et al. (1988); (3) the galaxy type, taken either from the Revised Third Catalog (RC3; de Vaucouleurs et al. 1991) of galaxies, the VCC, or our own inspection of the images. The designations are E = elliptical galaxy, S0 = lenticular galaxy, S = spiral galaxy, with following letters indicating the Hubble type, BCD = blue compact dwarf, VLSB = very low surface brightness galaxy (these were labeled as such based on a visual inspection and tended correspond to galaxies having average surface brightnesses within an aperture of radius 12 arcseconds fainter than 26.5 mag arcsec-2; at the very faint end of the sample, this kind of classification becomes tenuous and the distinction between VLSB galaxies and other dwarfs is purely subjective), dE = dwarf elliptical/dwarf spheroidal galaxy, dS0 = dwarf lenticular, dI = dwarf irregular. The notation dE/I means that we were unable to identify from the images what the type of dwarf galaxy was; (4) right ascension; (5) declination; (6) heliocentric radial velocity. See NED for the original references; (7) , the apparent blue magnitude measured within a 6′′ radius; (8) the ICP, or inner concentration parameter, defined as in Section 3. This is not meaningful for objects with companions; (9) the OCP, or inner concentration parameter, defined as in Section 3; (10) the total apparent blue magnitude . For the very brightest galaxies () we adopt the RC3 values when available, since these galaxies normally extended beyond the edges of a single CCD chip in our data. For the majority of galaxies we computed from the magnitudes within a 12 arcsecond aperture, corrected for light at large radius which has fallen below the sky using the prescription of Tully et al. (1996). This method requires us to assume an azimuthally-averaged exponential profile , to derive the scale-length and central intensity from a fit at radii below 12 arcseconds, and then to compute . We estimate errors of about 0.2 magnitudes in this analysis, derived from comparing values derived from objects appearing in more than one image. More serious systematic errors might result if the light at large radii that fell below the sky is not exponential or follows a different exponential law from what we derive by fitting at smaller radii; however there is no evidence for this phenomenon happening in the typical dwarf galaxies observed by Binggeli & Cameron (1991). The only galaxy where we did not use an exponential profile for this extrapolation was the elliptical galaxy NGC 4486A, where we used an -law extrapolation (de Vaucouleurs 1948). For objects labeled “**” the companions prevent a fit from giving meaningful and values (this effect was not significant for objects labeled “*”), so the values were derived individually by identifying a symmetry axis and computing the flux from the part of the galaxy on the other side of this axis from the companion and multiplying this flux by two. Additionally, VCC 2062 was treated this way, since the light from this irregular galaxy peaks so far away from its centre.
Since we will ultimately consider the LF for the entire magnitude range , it is important to consider how the RC3 magnitudes used at very bright magnitudes compare with the magnitudes we derive from the exponential fitting method at fainter magnitudes. We made the transition from using the different types of measurements at . For objects within 0.5 magnitude of this transition magnitude, the difference between the values obtained from the RC3 and those we derive is mag, which is smaller than our expected uncertainty in the values we derive (see above) and much smaller than the binwidth (1 mag) we use to compute the LF. The RC3 magnitudes will be more accurate for brighter galaxies, but even at the faintest limits that we use them, they therefore appear to be accurate enough for our purposes.

It is also instructive to compare our derived magnitudes with the magnitudes in the VCC for all dwarfs common to both catalogues (see Fig. 4). For to we have 318 galaxies, 232 (73 %) of which are VCC members. Some are not (like UGC 7346) since they are not in the VCC fields – in this study we observed fields beyond the northern extent of the VCC (see Fig. 1) survey area. Some are not VCC members (like the IBM88 objects) because their surface brightnesses were too low to be included in that sample. From Fig, 3, we see that the VCC magnitudes brighter than tend to be systematically brighter than ours by about half a magnitude (a similar, albeit smaller, effect was noted by Binggeli et al. 1995 who compared the VCC magnitudes with the values derived by Ichikawa et al. 1986). Fainter than there is no systematic offset between the VCC magnitudes and ours (the mean difference is (present) (VCC) = 0.01 0.04 mag). (11) the nominal probability of being a cluster member, as determined in Section 3 from a comparison with the background fields; (12) Galaxy rating according to the scheme described in Table 1; (13) absolute magnitude , where the Galactic Extinction values (typically 0.1 – 0.2 magnitudes) are adopted from NED and based on the measurements of Schlegel et al. (1998). We adopt a distance modulus of 31.15 for the Virgo Cluster (Tonry et al. 2001).
|
|
|
|
|
|
|
|
5 The Luminosity Function
|
-
The values of in this table come from power-law fits over a three magnitude range centered on the middle of the magnitude range for the appropriate entry.

The luminosity function for our galaxy sample is presented in Figure 5 and Table 3.
Our luminosity function is similar to that derived by Sandage et al. (1985). This is not surprising given that most of our galaxies were in the Virgo Cluster Catalog (except at the faint end where our survey was deeper or the VCC is incomplete) and the fact that our total magnitudes for the VCC galaxies (Fig. 4) are similar to the VCC ones.
However, the difference with the results of Phillipps et al. (1998a) is very marked. Our survey reached a similar depth to theirs, but in the faintest three magnitude bins (Fig. 5) we found far fewer galaxies per bright galaxy. In our faintest bin we found only 83 galaxies, whereas given the Phillipps et al. (1998a) inner area LF normalized to our data at (the bright end of the magnitude range over which they fit the LF), we would predict about 1000 galaxies. Additionally, we found that our LF steepened at brighter magnitudes: compared with () for the Phillipps et al. (1998a) inner area LF. This discrepancy can be explained if the Phillipps et al. (1998a) sample suffers from severe background contamination at the faint end. Alternatively it could means that our sample is incomplete (it would need to be incomplete at about the 90% level) at the faint end relative to the Phillipps et al. (1998a) sample. Such incompleteness could follow from us (and Sandage et al. 1985) erroneously rejecting the higher surface-brightness cluster members from our sample because we think that they are background galaxies. We will return to this point in Section 7. Finally, we note that the final two points in the Phillipps et al. (1998a) LF may have been overestimated by a factor of two, meaning that a faint-end slope of may be appropriate for that dataset, not (S. Phillipps, private communication). This would make the inconsistency with the current dataset smaller.
Table 3 also gives , the logarithmic slope of the luminosity function, at each absolute magnitude. The curvature in the LF is real and statistically significant: a single value of , independent of absolute magnitude, is highly inconsistent with the data, Neither a power-law or a Schechter (1976) function provides a satisfactory fit to the data over any appreciable magnitude range. That we are able to make such a statement follows from the small (Poisson) error bars in Table 3, which in turn follows from the large number of galaxies in our sample. It is interesting, however, that the average value of fainter than is , close to the faint-end slope that Sandage et al. (1985) found for the VCC. Over the magnitude range the average slope is more like , similar to the slope in the Phillipps et al. (1998a) sample over this magnitude range, allowing for a colour of 1.5.
Over the half-magnitude interval , only have 29 galaxies classified 0+1+2, implying that the logarithm of the LF at is mag-1 deg-2. This could be a sign of a weak turnover in the LF, but there are other ways to explain the paucity of galaxies in this interval. For example, the sample could be incomplete at these faint levels (only a modest amount of incompleteness would be required to generate this kind of feature in the LF. This kind of incompleteness could follow from the reduced dynamic range in surface brightness over which we classify galaxies 1 or 2 at these faint levels (Trentham & Tully 2001). Galaxies with surface-brightnesses a little brighter than about 27 mag arcsec-2 will be missing from the sample because they are indistinguishable from field galaxies of the type seen in large number in our blank fields. Galaxies with surface-brightnesses a little fainter than about 27 mag arcsec-2 will also be missing from the sample because they are not detected above the sky. Consequently at these very faint levels our sample may be incomplete.
6 Properties of galaxies


The contribution to the total galaxy LF from galaxies of different morphological types is presented in Figure 6.
At the faint end, the vast majority of galaxies in the sample are dE galaxies, as identified on morphological grounds. The structural parameters (see Figure 7) and colours (see Figure 8) of the galaxies are consistent with this interpretation. Many of these dE galaxies are nucleated, but few of the dIrr galaxies in the cluster are. This suggests either that the two kinds of galaxies form in different ways (despite the similarity in their scaling laws) or that dIs are dEs in formation and that the nucleus is the last part to form. In the faintest three bins about one-third of the galaxies are rated 2. These tended to be high surface-brightnesses dEs that could conceivably be background late-type galaxies. Even excluding these galaxies, dEs are still the dominant types at the faintest magnitudes.
The VLSB galaxies never contribute significantly to the total luminosity function. This result cannot be directly compared to the measurements of VLSB galaxies in Fornax of Kambas et al. (2000) because we require a somewhat lower surface brightness (see Section 4) than do Kambas et al. (see Section 2.2 of their paper) to call a galaxy a “VLSB”. Nevertheless, we do find far fewer low surface-brightness galaxies that are likely to be cluster members than they did in Fornax. The Virgo Cluster has a crossing times shorter than one-tenth of a Hubble time (see Table 1 in Tully et al. 1996) so galaxies here must have undergone many galaxy-galaxy interactions. It is therefore surprising that diffuse VLSB galaxies can survive. Perhaps this is evidence that small galaxies in clusters have substantial dark matter halos.
We also notice a paucity of galaxies having exactly . A dip in the LF at this absolute magnitude was also seen in the Coma Cluster (Trentham 1998a) and in the NGC 1407 Group (Trentham & Tully 2001), another dense knot of early-type galaxies. This is also the magnitude where the cluster population changes from being dominated by high surface-brightness giant elliptical galaxies to low surface-brightness dwarf elliptical galaxies (see Figure 6). These two types of stellar system have very different structural parameters (see Figure 1 of Binggeli 1994), implying that they had very different formation mechanisms.
7 Caveats: incompleteness and contamination
We expect to be missing two sorts of galaxies from our sample: galaxies with very low surface brightnesses that are never visible above the sky and cluster galaxies with high surface brightness that we reject from the sample because we think that they are background galaxies. We will argue that neither of these are likely to be a serious problem with the current dataset.
Galaxies with very low surface brightnesses ( mag arcsec-2 within an aperture of radius 6 arcseconds) are unlikely to be very common for . Evidence supporting this is (i) such galaxies were not found in deep images of the Virgo Cluster core (Trentham & Tully 2001) taken with the 8 m Subaru Telescope. Those images reached very deep surface brightness limits (about 28 mag arcsec-2, equivalently 29 mag arcsec-2 for dwarf galaxies) but did not uncover any additional galaxies with that were missing from the current survey because their surface brightnesses were too low; (ii) In Figure 7, the points at the faint end do not cluster right at the very limit of detection (27 mag arcsec-2). Most have higher surface brightnesses (although a few have mag arcsec-2). This in turn suggests that there do not exist large numbers of galaxies with surface brightnesses just below this limit; (iii) No local galaxies with are known with such low surface brightnesses, although a small number of bulge-dominated galaxies have disk components this faint or fainter e.g. Malin 1 (Bothun et al. 1987) and GP 1444 (Davies, Phillipps & Disney 1988). The giant galaxy population in the Virgo Cluster is similar to that in the local Universe in terms of galaxy structural parameters, so it is reasonable to expect that the dwarf galaxy population is similar too and that this absence in the field of dwarfs with and 27 mag arcsec-2 extends to the Virgo Cluster.
Dwarf galaxies with very high surface brightnesses lacking an extended diffuse light component are another potential source of contamination because they would be rejected from the current sample since they look like luminous background galaxies (they have low values). These can either be blue HII galaxies like Markarian 1460 (Trentham, Tully & Verheijen 2001b) or red compact dwarfs like M32 in the Local Group or UGC 6805 in the Ursa Major Cluster (Tully & Verheijen 1997). In the Virgo Cluster, VCC 1313 is an example of the former and VCC 1627 of the latter; were the velocities of these two objects not known we would have classified them as background objects. For only these two galaxies of this type were identified. Were such objects to exist with , our sample could be incomplete. The fraction of detected galaxies that we assign to the cluster on surface brightnesss grounds ranged from close to 1 at the bright end of the sample () to about 1 per cent at the faint end ().
This is an important change of emphasis from what has classically been thought of as the main uncertainty in studies of cluster luminosity functions. Previously the results from this kind of study were open to question because many very low surface-brightness galaxies could be missing from the sample since they are never detected above the sky. This is no longer a worry because deep surveys like this one and that of Trentham & Tully (2001) are not uncovering large numbers of LSB galaxies that were missing in shallow ones. Instead, the major concern is now that the sample may be missing many high surface-brightness galaxies which we have culled from the sample because we think that they are background galaxies.
We do not however regard this as a serious worry. Firstly, at the bright end of our sample, where velocity measurements are available, galaxies with high surface brightnesses are rare (VCC 1313 and VCC 1627 are the exceptions). Secondly, high surface-brightness galaxies do not appear to be present in substantial number in the Fornax Cluster else they would have been seen in the spectroscopic survey described by Drinkwater et al. (2000a; this work uses the 2dF spectrograph on the Anglo-Australian Telescope). Small numbers of compact galaxies with early-type spectra were discovered in that survey (Drinkwater et al. 2000b, Phillipps et al. 2001) but they are too rare to contribute significantly to the Fornax LF. Given the similarities between the Virgo and Fornax Clusters, we do not expect this to be a major source of incompleteness in the current study.

Another potential problem is that the Virgo data but not the North Galactic Cap background data is contaminated by an anomalously large number of nearby galaxies at comparable distances to the Virgo Cluster that are not bound to the cluster (the values computed by comparing the numbers of low surface-brightness galaxies in the two datasets would then be too high). The contaminating galaxies would need to be nearby or else they would not look like Virgo Cluster galaxies. We regard such a possibility as unlikely due to the paucity of luminous galaxies with velocities between about 2000 km s-1 and 3000 km s-1 in the Virgo dataset (see Figure 9). Were such objects to be numerous, the satellite populations of these luminous galaxies (only very luminous galaxies are listed in the Nearby Galaxies Catalog at these distances and so would be included in Figure 9) could look like Virgo Cluster members (satellites of galaxies at higher velocities would be too small).
8 The total optical luminosity in galaxies

In Figure 10, we present the contribution from galaxies of different types and absolute magnitudes to the total optical luminosity of the region of the Virgo Cluster that we surveyed. The total luminosity in our sample is , corresponding to a luminosity surface density of . For comparison, for the VCC, Sandage et al. (1985, converted to the distance scale used elsewhere in this paper) measure a luminosity surface density of averaged over the central six degrees of the cluster. That our number is slightly higher follows from the fact that by proportion our survey covers more high-density areas within the cluster than does the VCC (see Figure 1).
Figure 10 shows that only a small proportion (less than one-tenth) of the total optical luminosity of the cluster is in dwarf galaxies. Even less is in the systems that we called VLSB galaxies. Were these galaxies not to be resolved as individual objects (as would be the case if they were in a more distant cluster), they would be observable only though their contribution to the diffuse intracluster light. This in turn implies that if the cluster LF does not vary strongly between clusters (see the next section), then the intracluster light in distant clusters (typically 10 per cent of the total cluster light e.g. Melnick, Hoessel & White 1977; Thuan & Kormendy 1977; Scheick & Kuhn 1994; Vílchez-Gómez, Pelló & Sanahuja 1994) cannot be produced by the integrated light from low surface-brightness dwarf galaxies and is more likely to be made up of stars tidally released from luminous galaxies within the cluster, perhaps via galaxy harassment (Moore et al. 1996).
9 Comparison with other LFs

|
In Figure 11 we compare the Virgo Cluster LF to the LFs for the Coma Cluster (), the Ursa Major Cluster, and the Local Group. In Table 4 we present the dwarf-to-giant ratios (DGRs) for the various environments. The DGR is a convenient way to parameterize the LF by a single number; note that different authors e.g. Phillipps et al. (1998b) define this quantity in a different way. The Virgo LF presented here and the Ursa Major LF (Trentham, Tully & Verheijen 2001a) are somewhat more tightly constrained than the Coma LF or the Local Group LF. For the Coma Cluster, the error bars are large due to the need to determine the LF using a background subtraction and the large field-to-field variance of the background (the Coma Cluster is sufficiently distant that the faint dwarfs become smaller than the seeing and we cannot establish membership on the basis of morphology, as we did in the current study). For the Local Group, the error bars are large due to Poisson counting statistics, since there are not many galaxies (there are only six galaxies – M31, the Milky Way, M33, IC 10, LMC and SMC – brighter than for example).
There appear to be two types of galaxy luminosity function – one for evolved regions (where the elliptical galaxy fraction is high, the galaxy density is high and the crossing time is short) like the Virgo Cluster and Coma Cluster and one for unevolved regions like the Ursa Major Cluster and the Local Group. The Virgo and Ursa Major LFs represent natural prototypes for the two kinds of LF. The two LFs are inconsistent with each other at a high level of significance: the probability that the two LFs are drawn from a single distribution is per cent (reduced for 5 degrees of freedom). The reason that such a strong statement can be made follows from the small error bars for these two LFs on Figure 11.
The evolved region LF appears to be characteristic of many clusters (see Trentham 1998c), even though for each cluster individually (like Coma) the LF is poorly determined due the large uncertainties following a background subtraction. In the study of Trentham (1998c), the composite cluster LF was determined primarily from the LFs of Virgo (Sandage et al. 1985) and Fornax (Ferguson & Sandage 1988). The current LF, at least in all but the faintest one or two magnitude bins, can to some extent be seen as a verification of the Virgo LF of Sandage et al. (1985) and therefore the LF presented in Table 3 may be regarded as being valid (when scaled appropriately) for the majority of galaxy clusters. The main features of this evolved LF are the steep rise at and the flattening faintward of . In the very centres of the richest clusters, the galaxy density is high enough that many dwarfs may be destroyed via cluster-related processes (e.g. Phillipps et al. 1998b, Adami et al. 2000, Boyce et al. 2001) and the rise at is no longer observable there, but the Virgo Cluster is unlikely to be rich enough for this phenomenon to be important.
The unevolved (i.e. Ursa Major) LF is different from the evolved one in that it lacks the rise () at and consequently generates a lower DGR. This LF ( everywhere fainter than ) is also appropriate for the Local Group (van den Bergh 1992, 2000) and for the true field, where the LF is determined spectroscopically (see Table 5; the values of quoted by different authors are derived in different ways, for example by Schechter (1976) function fits with different , but none are as steep as the Virgo LF at around ).
10 Comparison with theory
|
The discussion in the previous section can be summarized by the following results: 1) The Virgo Cluster LF has a rise with at than is not seen in the LFs of the field or unevolved environments like the Ursa Major Cluster; 2) This rise does not continue indefinitely towards fainter magnitudes and the Virgo Cluster LF is flat () between and the limit of our survey at . Furthermore, 3) Dwarf galaxies are very deficient in the Virgo Cluster compared to the predictions of CDM theory (which predicts if light traces mass). The implication of 1) is then that dwarfs are even more deficient in the field.
Attempting to explain these three results in the context of galaxy formation models leads us to consider the following four physical processes: (i) Tully (2001; see also Somerville 2001 and Tully et al. 2001) has suggested that the dark halos in dense, evolved environments formed early in the history of the Universe, prior to reionization, but that the dark halos in diffuse, unevolved environments assembled much later. The dark halos in the evolved environments, like the Virgo Cluster, could then collect gas which could later be turned into stars, but dark halos in unevolved environments could not – in the terminology of Tully (2001), the formation of stars within these halos would be “squelched”. The end result would be more dwarf galaxies per unit total mass in evolved environments than in unevolved environments, in agreement with result 1) above. In unevolved environments there would be very many dark matter halos with no stars at all. Such a phenomenon is also seen in simulations (Chiu, Gnedin & Ostriker 2001) ; (ii) Local feedback can generate a very low star formation efficiency in low mass galaxies. Winds from a modest number of supernovae can expel a large fraction of the gas in small galaxies (Dekel & Silk 1986, Efstathiou 2000) because the galaxies have small potential wells. The consequence of this is that the final luminosity of a small galaxies is very strongly decreasing function of the galaxy mass so that is a decreasing function of . The LF that we measure is then much shallower than the mass function, which is what CDM predicts. That this process is important is suggested by the observation that the lowest mass dwarf galaxies are heavily dark matter dominated (Wilkinson et al. 2001). This mechanism solves the discrepancy with CDM theory in a different way from squelching – it causes all low-mass galaxies to have very low luminosities, rather than turning off star formation altogether in all but very few low-mass halos, leaving most low-mass halos completely dark; (iii) Cluster-related processes like galaxy harassment (Moore et al. 1996) and tidal interactions during the early stages of cluster formation can form dwarfs (Barnes & Hernquist 1992) and may in part be responsible for the higher DGR in clusters. On the other hand, dwarfs formed this way are not be expected to have dark halos (and by implication, low surface brightnesses) like the Virgo dwarfs we studied here; the dwarfs found in the simulations of Barnes & Hernquist do not have appreciable dark-matter content. Additionally, field and cluster dwarfs seem to have similar scaling laws (see Figure 7), which would seem to argue that field and cluster dwarfs formed in a similar way to each other so that cluster-related processes are probably not the main mechanisms responsible for the difference in the evolved and unevolved LFs; (iv) the number of dwarfs predicted by theory is very much lowered if the power spectrum of primordial fluctuations is reduced on small scales. A general phenomenon of CDM theory is its success on large scales but its failure to reproduce observations on small ( kpc) scales – the two most serious failures are the dwarf galaxy deficiency studied here and the observed flatness of dark matter profiles in the centres of galaxies (e.g. Binney, Gerhard & Silk 2001). Possible mechanisms to remove small-scale power from the CDM fluctuation spectrum include making the dark matter warm (Bode, Ostriker & Turok 2001) or self-interacting (Spergel & Steinhardt 2000, however see Miralda-Escudé 2001 and Moore et al. 2000). Studying the effects of these particular modifications to the dark-matter power spectrum is currently an active field of study.
In Table 6 we summarize how the different physical processes can explain the observational results listed above. A check is placed in a column whenever an observational result follows from the inclusion of the physical process in question in models of galaxy formation.
|
11 Future work
A natural extension of the current study is the determination of a deeper and more accurate Virgo Cluster LF. For , the main source of uncertainty in the current work is in establishing membership, not in counting statistics: the difference between the 0–1 and 0–2 points in Figure 5 is greater than the error bars. Galaxies classified “2”, the ones for which we are uncertain about membership, tend to be the higher surface-brightness ones in our sample, so it should be possible to establish distances to these either by measuring spectroscopic redshifts or from surface-brightness fluctuations (Jerjen, Freeman & Binggeli 1998, 2000). For , deeper observations than those presented here over similarly large angular areas will be required. Such observations are now possible with the advent of mosaic CCDs on 8 m telescopes like Suprime-cam on the Subaru Telescope (for deep observations of 1.2 deg2 in the core of the Virgo Cluster, see Trentham & Tully 2001).
A spectroscopic survey of the Virgo Cluster could be extended to include significant numbers of compact, high surface-brightness galaxies that we think are background, in the style of the Drinkwater et al. (2000a) Fornax survey. If the vast majority of such objects are indeed background objects, this would alleviate the concern highlighted in Section 7 that the current sample is heavily incomplete due to us rejecting such galaxies. Such a project is now feasible with the advent of wide-field multi-object spectrographs on large telescopes.
More detailed studies of the dwarf galaxies found in Virgo will also be of value in assessing the importance of the various physical processes at work during galaxy and cluster formations. The following observations should be of particular use: 1) measurement of colours and elemental abundances. These will constrain the star-formation histories of the Virgo dwarfs which in turn will allow a lower limit to be placed on the redshift at which gas was collected by small dark-matter halos. This is of importance in the context of the squelching picture described above. This squelching picture also relies on the very existence of these dark-matter halos around the Virgo dwarfs. In the long term, studies of the kinematics of stars in the dwarfs will be required to verify this assertion; 2) HI measurements of the cold gas content of the Virgo dwarfs. Galaxies that have stayed any appreciable time in the Virgo Cluster would lose their gas via ram-pressure stripping from the cluster X-ray halo. Therefore a large number of dwarfs in Virgo with HI would suggest that many Virgo dwarfs only recently entered the cluster. This would in turn argue against any physical process that requires Virgo dwarfs to have formed in the cluster or at very early times in small groups which quickly merged to form the cluster; 3) the location of dwarfs in the cluster. Do giants maintain their dwarf populations once they are in the Virgo Cluster, or do the dwarfs adopt orbits determined by the cluster potential? If the former were true, dwarfs would tend to cluster around giants. If the latter were true, they would be smoothly distributed throughout the cluster, with a radial density profile similar to that of the giant galaxies. The answer to this question will provide constraints on the dark-matter structure of the Virgo Cluster.
Acknowledgments
This work was based on observations made through the Isaac Newton Groups’ Wide Field Camera Survey Programme with the Isaac Newton Telescope operated on the island of La Palma by the Isaac Newton Group in the Spanish Observatorio del Roque de los Muchachos of the Instituto de Astrofisica de Canarias. The contributions of J. Davies and R. McMahon in initiating the WFS and the Virgo part of the survey are acknowledged in particular. We are also grateful to the referee, Dr. S. Phillipps, for detailed comments on the manuscript. This research has made use of the NASA/IPAC Extragalactic Database (NED) which is operated by the Jet Propulsion Laboratory, Caltech, under agreement with the National Aeronautics and Space Association.
References
- [bl] Adami C., Ulmer M. P., Durret F., Nichol R. C., Mazure A., Holden B. P., Romer A. K., Savine C., 2000, A&A, 353, 930
- [bl] Barnes J. E., Hernquist L., 1992, Nat, 360, 715
- [bl] Binggeli B., 1994, in Meylan G., Prugneil P., ed., ESO Conference and Workshop Proceedings No. 49: Dwarf Galaxies. European Space Observatory, Munich, p. 13
- [bl] Binggeli B., Cameron L. M., 1991, A&A, 252, 27
- [bl] Binggeli B., Sandage A., Tammann G. A., 1985, AJ, 90, 1681
- [bl] Binney J., Gerhard O., Silk J., 2001, MNRAS, 321, 471
- [bl] Binney J., Merrifield M., 1997, Galactic Astronomy, Princeton University Press
- [bl] Blanton M. R. et al., 2001, AJ, 121, 2358
- [bl] Bode P., Ostriker J. P., Turok N., 2001, ApJ, 556, 93
- [bl] Bothun G. D., Impey C. D., Malin D. F., Mould J. R., 1987, AJ, 94, 23
- [bl] Boyce P. J., Phillipps S., Jones J. B., Driver S. P., Smith R. M., Couch W. J., 2001, MNRAS, in press (astro-ph/0107553)
- [bl] Caldwell N., 1983, AJ, 88, 804
- [bl] Chiu W. A., Gnedin N. Y., Ostriker J. P., 2001, ApJ, submitted (astro-ph/0103359)
- [bl] Cole S. et al., 2001, MNRAS, 326, 255
- [bl] Coleman G. D., Wu C-C., Weedman D. W., 1980, ApJS, 43, 393
- [bl] Cowie L. L., Songaila A., Hu E. M., Cohen J. G., 1996, AJ, 112, 839
- [bl] Davies J. I., Phillipps S., Disney M. J., 1988, MNRAS, 231, 69p
- [bl] Dekel A., Silk J., 1986, ApJ, 303, 39
- [bl] de Vaucouleurs G., 1948, Ann. d’Ap., 11, 247
- [bl] de Vaucouleurs G., de Vaucouleurs A., Corwin H. G., Buta R. J., Paturel G., Forqué P., 1991, Third Reference Catalogue of Bright Galaxies, Springer-Verlag
- [bl] Dressler A., 1980, ApJ, 236, 351
- [bl] Drinkwater M. J., et al., 2000a, A&A, 355, 900
- [bl] Drinkwater M. J., Jones J. B., Gregg M. D., Phillipps S., 2000b, PASA, 17, 227
- [bl] Efstathiou G., 2000, MNRAS, 317, 697
- [bl] Ellis R. S., Colless M., Broadhurst T., Heyl J., Glazebrook K., 1996, MNRAS, 280, 235
- [bl] Ferguson H. C., Sandage A., 1988, AJ, 96, 1520
- [bl] Freeman K. C., 1970, ApJ, 160, 811
- [bl] Ichikawa S., Wakamatsu K., Okamura S., 1986, ApJS, 60, 475
- [bl] Impey C., Bothun G., Malin D., 1988, ApJ, 330, 634
- [bl] Irwin M. J., 1985, MNRAS, 275, 514
- [bl] Irwin M. J., 1996, in Rodriguez Espinosa J. M., Herrero A., Sanchez F., ed., Instrumentationm for Large Telescopes, VII. Canary Islands Winter School. Cambridge University Press, Canbridge, p. 35
- [bl] Irwin M., Lewis J., 2001, New Astron. Rev., 45, 105
- [bl] Jerjen H., Freeman K. C., Binggeli B., 1998, AJ, 116, 2873
- [bl] Jerjen H., Freeman K. C., Binggeli B., 2000, AJ, 119, 166
- [bl] Kambas A., Davies J. I., Smith R. M., Bianchi S., Haynes J. A., 2000, AJ, 120, 1316
- [bl] Klypin A., Kravtsov A., Valenzuela O., Prada F., 1999, ApJ, 522, 82
- [bl] Lee J., Shandarin S. F., 1999, ApJ, 517, L5
- [bl] Lin H., Kirshner R. P., Shectman S. A., Landy S. D., Oemler A., Tucker D. L., Schechter P. L., 1996, ApJ, 464, 60
- [bl] Loveday J., Peterson B. A., Efstathiou G., Maddox S. J., 1992, ApJ, 390, 338
- [bl] McMahon R. G., Walton N. A., Irwin M. J., Lewis J. R., Bunclark P. S., Jones D. H., 2001, New Astron. Rev., 45, 97
- [bl] Melnick J., Hoessel J., White S. D. M., 1977, MNRAS, 180, 207
- [bl] Miralda-Escudé J., 2001, ApJ, submitted (astro-ph/0002050)
- [bl] Moore B., Katz N., Lake G., Dressler A., Oemler A., 1996, Nat, 379, 613
- [bl] Moore B., Ghigna S., Governato F., Lake G., Quinn T., Stadel J., Tozzi P., 1999, ApJ, 524, L19
- [bl] Moore B., Gelato S., Jenkins A., Pearce F. R., Quilis V., 2000, ApJ, 535, L21
- [bl] Phillipps S., Parker Q. A., Schwartzenberg J. M., Jones J. B., 1998a, ApJ, 493, L59
- [bl] Phillipps S., Driver S. P., Couch W. J., Smith R. M., 1998b, ApJ, 498, L119
- [bl] Phillipps S., Drinkwater M. J., Gregg M. D., Jones J. B., 2001, ApJ, 560, 201
- [bl] Press W. H., Schechter P., 1974, ApJ, 187, 425
- [bl] Sandage A., Binggeli B., Tammann G. A., 1985, AJ, 90, 1759
- [bl] Schechter P., 1976, ApJ, 203, 297
- [bl] Scheick X., Kuhn J. R., 1994, ApJ, 423, 566
- [bl] Schlegel D. J., Finkbeiner D. P., Davis M., 1998, ApJ, 500, 525
- [bl] Somerville R. S., 2001, ApJ, submitted (astro-ph/0107507)
- [bl] Spergel D. N., Steinhardt P. J., 2000, PRL, 84, 3760
- [bl] Thuan T. X., Kormendy J., 1977, PASP, 89, 466
- [bl] Trentham N., 1998a, MNRAS, 293, 71
- [bl] Trentham N., 1998b, MNRAS, 295, 360
- [bl] Trentham N., 1998c, MNRAS, 294, 193
- [bl] Trentham N., Tully R. B., 2001, MNRAS, in preparation
- [bl] Trentham N., Tully R. B., Verheijen M. A. W., 2001a, MNRAS, 325, 385
- [bl] Trentham N., Tully R. B., Verheijen M. A. W., 2001b, MNRAS, 325, 1275
- [bl] Tonry J. L., Dressler A., Blakeslee J. P., Ajhar E. A., Fletcher A. B., Luppino G. A., Metzger M. R., Moore C. B., 2001, ApJ, 546, 681
- [bl] Tully R. B., 1987, Nearby Galaxies Catalog, Cambridge University Press
- [bl] Tully R. B., 2001, in von Hippel T., Manser N., Simpson C., ed., Astrophysical Ages and Timescales. ASP, San Francisco, in press (astro-ph/0104037)
- [bl] Tully R. B., Somerville R. S., Trentham N., Verheijen M. A. W., 2001, ApJ, submitted (astro-ph/0107538)
- [bl] Tully R. B., Verheijen M. A. W., Pierce M. J., Huang J. -S., Wainscoat R. J., 1996, AJ, 112, 2471
- [bl] Tully R. B., Verheijen M. A. W., 1997, AoJ, 484, 145
- [bl] van den Bergh S., 1992, A&A, 264, 75
- [bl] van den Bergh S., 2000, PASP, 112, 529
- [bl] Vílchez-Gómez R., Pelló R., Sanahuja B., 1994, A&A, 283, 37
- [bl] White S. D. M., Rees M. J., 1978, MNRAS, 183, 321
- [bl] Wilkinson M. I., Kleyna J., Evans N. W., Gilmore G., 2001, MNRAS, submitted (astro-ph/0109451)