The BeppoSAX view of bright Compton-thin Seyfert 2 galaxies
We present the analysis of 31 observations (17 of which are published here for the first time) of 20 bright Compton thin Seyfert 2s, in the 0.1-200 keV band, performed with the BeppoSAX satellite. The sample consists of all Seyfert 2s in the BeppoSAX public archive, with a 2-10 keV flux higher than 5 erg cm-2s-1. The good statistics available and the broad energy band permit a detailed study of the main continuum components of these sources, i.e. the primary power-law, the reflected component, the soft emission and the high-energy cut-off. The main results of our analysis are: (1) the 3-200 keV intrinsic power-law has a mean photon index , with a dispersion of . (2) The high-energy exponential cut-off at E keV is not an ubiquitous property of Seyfert galaxies: in % of the objects the continuum power-law does not drop up to energies of 300 keV or more. (3) A reflected component is present in almost all the sources (17 out of 21). The small variations of this component with respect to the intrinsic continuum, in objects with multiple observations, suggests that the reflector is not the accretion disk, but must be located much farther from the nucleus. (4) The range of ratios between the reflected and intrinsic components suggests that the circumnuclear medium is not homogeneous, and a significant fraction of the solid angle is covered by a gas thicker than that along the line of sight. (5) The iron K line is present is all but one the sources. The equivalent width is in the typical range of Seyfert 1s (EW=100-300 eV) in sources with low absorption (N cm-2), and increases in more absorbed objects, as expected according to unified models. (6) The energy resolution of BeppoSAX is in general too low to measure the iron line width. However, in 6 cases we measured a significant line broadening.
Key Words.:
Galaxies: active; Galaxies: Seyfert; X-rays: galaxies1 Introduction
In this paper we present the analysis of the observations of bright Seyfert 2 galaxies performed with the BeppoSAX satellite. The main aim of this work is to investigate the average X-ray continuum properties of these sources, through a homogeneous analysis of all the BeppoSAX archive data. The broad energy band of BeppoSAX (0.1-200 keV). permits us to separate the main continuum components (“soft excess”, intrinsic power law, reflection) with unprecedented precision.
Several homogeneous analyses of bright Seyfert 2s were published in the past years: Turner & Pounds 1989 (EXOSAT observations, 0.1-10 keV), Nandra & Pounds 1994 and Smith & Done 1996 (GINGA observations, 2-20 keV), Turner et al. 1997 (ASCA observations, 0.5-10 keV). Many of the data analyzed in these works have been more carefully analyzed using specific models for each source. The results are published in many papers where the X-ray emission of a single or a couple of sources is studied in detail. However, the results obtained in these detailed studies are in most cases in agreement with the simpler fits performed in the works quoted above where a large number () of observations are analyzed. The reason for this agreement is that even if peculiar features can be present in the X-ray spectrum of each source, the statistics is dominated by a continuum well fitted by a few components, namely a thermal emission at low energies (from 0.1 to a few keV), an absorbed power law with photon index , and a reflection component. Therefore, a homogeneous analysis of moderately large samples is the best way to investigate the average X-ray properties of these sources, to test unified models and to look for new correlations between the different spectral parameters.
The main results of the works quoted above support the unified models of AGNs, according to which the narrow emission line (type 2) objects differ from broad emission line objects (type 1) only for the presence of dusty absorbing gas along the line of sight.
The main X-ray spectral properties of Seyfert 2s can be modeled with the following 5 components:
-
1.
A power-law with photon index . X-ray observations of Seyfert 1s (Nandra et al. 1997) show that this power-law extends down to energies of a fraction of keV. At high energies, an exponential cut-off is observed in the BeppoSAX observations of a few objects (Guainazzi et al. 1999, Perola et al. 1999, 2000, Nicastro et al. 2000), at energies from 60 to 300 keV. The physical origin of this component could be a two phase accretion disk, where the soft photons emitted by a “cold” (kT eV) thick disk are Comptonized by a hot (kT keV) thin corona (Haardt & Maraschi 1993).
-
2.
A photoelectric cut-off of the intrinsic power-law is present at some energy, depending of the column density, NH, of the absorbing gas. If 1022 cmN cm-2, the cut-off energy is below keV, if 1023 cmN cm-2 the cut-off energy is between 2 and 10 keV. If N cm-2s-1 no direct emission is observable below 10 keV. The intrinsic component could only be revealed by observations in the 10-100 keV band. If N cm-2s-1 the source is completely thick at any energy, and only reflected components (see below) are observable.
-
3.
Thermal soft component: thermal emission, with kT ranging from 0.1 to a few keV is a good description of the soft X-ray emission of most Seyfert 2s. This component in Seyfert 2s cannot be due to emission from the accretion disk (since otherwise it would be obscured like the power-law component), and is probably associated to the warm gas confining the broad emission line clouds.
-
4.
Reflected component: a cold reflected component is often required to obtain a good fit of X-ray spectra of Seyfert galaxies above keV. The reflecting medium could be the accretion disk itself or, alternatively, the inner edge of the absorbing gas (Ghisellini et al. 1994), or a wind (Elvis 2000).
A warm reflection component is also required in many cases. Assuming that this component is due to scattering of the primary component with warm electrons, the spectral shape is the same as in the incident continuum.
-
5.
Iron line: an iron K emission line, at energies E keV is observed in most Seyfert galaxies. It is believed to be originated both in the accretion disk and in the absorbing/reflecting circumnuclear gas (Matt et al. 1991, 1996) The observed equivalent width of the line is typically 100-300 eV in Seyfert 1s and in Seyfert 2s with NH lower than a few 1023 cm-2. In sources with heavier absorption the equivalent width is higher (up to several keV) since the continuum at the line energy is more absorbed than the line, that is -at least in part- emitted by the reflecting material along free lines of sight. The line component emitted from far reflectors is narrow, and does not immediately follow the continuum variations, while the disk component can be broad and is expected to vary with almost zero delay with respect to the continuum.
In this work we will use the components described above to fit the 0.1-200 keV observations of a sample of 31 observations of 20 Seyfert 2s, performed by the BeppoSAX satellite in the period 1997-2000. 17 out of these 31 observations are currently unpublished. In Sect. 2 we review the basic properties of the sample and we summarize the data reduction process. In Sect. 3 we describe the models used to fit the data. In Sect. 4 we discuss the results of data analysis. In Sect. 5 we summarize our conclusions.
Name z Class. NGC 526a 0.0295 Sy 2 NGC 1365 0.0055 Sy 1.8 IRAS 05189-2524 0.0426 Sy 2 NGC 2110 0.0076 Sy 2 NGC 2992 0.0077 Sy 1.9 MCG-5-23-16 0.0083 Sy 2 NGC 4258 0.0015 Sy 1.9 NGC 4388 0.0084 Sy 2 NGC 4507 0.0118 Sy 2 IRAS 13197-1627 0.0172 Sy 1.8 NGC 5252 0.0230 Sy 1.9 Centaurus A 0.0018 Sy 2 NGC 5506 0.0062 Sy 1.9 NGC 5674 0.0249 Sy 1.9 NGC 6300 0.0037 Sy 2 ESO 103-G35 0.0133 Sy 2 NGC 7172 0.0087 Sy 2 NGC 7314 0.0047 Sy 1.9 NGC 7582 0.0053 Sy 2 NGC 7679 0.01714 Sy 2
2 Data: selection and reduction
The sample consists of 31 observations of 20 sources (one source was observed 5 times, one 3 times and 5 sources were observed twice). The basic properties of the sample objects are listed in Table 1.
Name Obs. date LECS exp. (s) MECS exp. (s) PDS exp. (s) Refa NGC 526a 31 DEC 98 38977 93175 44199 1 NGC 1365 12 AUG 97 8862 27580 13023 2 IRAS 05189-2524 03 OCT 99 17378 41973 19455 3 NGC 2110 12 OCT 97 40665 83701 38673 4 NGC 2992 #1 01 DEC 97 26668 72007 33820 5 NGC 2992 #2 25 NOV 98 21914 59245 27084 5 MCG-5-23-16 24 APR 98 35825 76990 32524 UNP. NGC 4258 19 DEC 98 32954 99428 46933 6 NGC 4388 #1 09 JAN 99 65242 67878 51189 UNP. NGC 4388 #2 03 JAN 00 20822 28311 14607 UNP. NGC 4507 #1 26 DEC 97 22229 55009 26967 UNP. NGC 4507 #2 02 JUL 98 8889 31408 16953 UNP. NGC 4507 #3 13 JAN 99 11109 41325 20081 UNP. IRAS 13197-1627 22 JUL 98 14140 43780 18616 UNP. Centaurus A #1 20 FEB 97 16912 33393 14873 UNP. Centaurus A # 2 06 JAN 98 16681 54243 22987 UNP. Centaurus A # 3 10 JUL 99 13676 38779 17801 UNP. Centaurus A # 4 02 AUG 99 13670 38756 17801 UNP. Centaurus A # 5 08 JAN 00 11775 34004 17941 UNP. NGC 5252 20 JAN 98 20897 61023 29155 UNP. NGC 5506 #1 30 JAN 97 15495 39363 17008 UNP. NGC 5506 #2 14 JAN 98 8868 39004 17500 UNP. NGC 5674 12 FEB 00 21029 45039 20809 UNP. NGC 6300 28 AUG 99 39567 86265 38555 7 ESO 103-G35 #1 03 OCT 96 10088 50620 21029 8 ESO 103-G35 #2 14 OCT 97 3617 14312 5915 8 NGC 7172 #1 14 OCT 96 15212 39167 17277 9 NGC 7172 #2 06 NOV 97 22405 49185 21147 9 NGC 7314 08 JUN 99 35595 89799 42564 UNP. NGC 7582 09 NOV 98 26859 56435 26095 10 NGC 7679 06 DEC 98 39799 90908 45298 11
The only selection criteria are a 2-10 keV measured flux higher than 5 erg cm-2 s-1, and a measured absorbing column density lower than 1024 cm-2 (i.e. “Compton thin” sources). As a consequence, the sample contains only high signal-to-noise spectra, that can be studied in considerable detail. The observation log is reported in Table 2. All the observations are available in the BeppoSAX public archive provided by the ASI Science Data Center (SDC). Each source has been observed with 3 narrow-field instruments on board of the Italian/Dutch BeppoSAX satellite: LECS (0.1-10 keV, Parmar et al. 1995), MECS (1.65-10.5 keV, Boella et al. 1995b) and PDS (20-200 keV, Frontera et al. 1995).
The LECS and MECS event files were obtained from the SDC public archive. The spectra were created using the XSELECT v.2.0 code. A circular region of radius 4’, centered on the source, was selected to extract the spectrum. The data were rebinned in order to have at least 20 counts per bin. This allows the use of Gaussian statistics in the model fitting. For the PDS data, we used the spectrum provided by the SDC public archive. The background spectra for the LECS and MECS data were obtained from the long observations of blank field provided by the SDC. Calibration matrices (redistribution matrix, RMF, for all the three instruments, and ancillary (effective area) matrix, ARF, for LECS and MECS) were also provided by the SDC.
The spectra used in the scientific analysis consist of LECS data from 0.1 to 3 keV (above 3 keV the calibration of the LECS is uncertain, and we do not lose much in terms of statistics, since the area of the MECS is significantly higher than that of the LECS above 2 keV); MECS data from 1.65 to 10.5 keV, and PDS data from 20 to 200 keV (in several cases, where the statistics at high energy was too low, we cut the spectrum at 100 keV).
3 Model fitting
The data analysis was performed using the XSPEC v.10.0 code. All the errors quoted in this works are at a confidence level of 90% for one interesting parameter.
In all models we fixed the normalization factor between PDS and MECS to 0.8. The uncertainty in this factor is at most 10%, according to the SAX SDC. This is not a dominant source of error, since te typical final errors in the parameters strongly affected by high-energy data are typically much higher. This is due to both the limited number of counts and the degeneracy between some of the spectral components, as will be further discussed in the following Subsections. The normalization between LECS and MECS were left free. The typical best fit values are in the interval 0.6-0.8.
The Galactic absorption is taken into account in all models, by multiplying each component by an extra absorption factor.
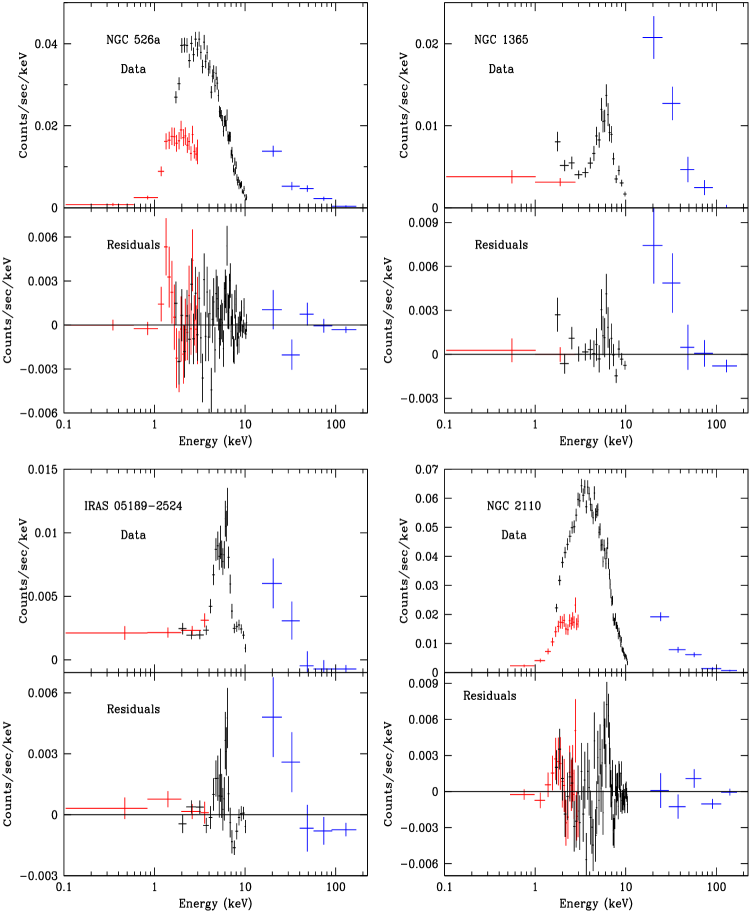
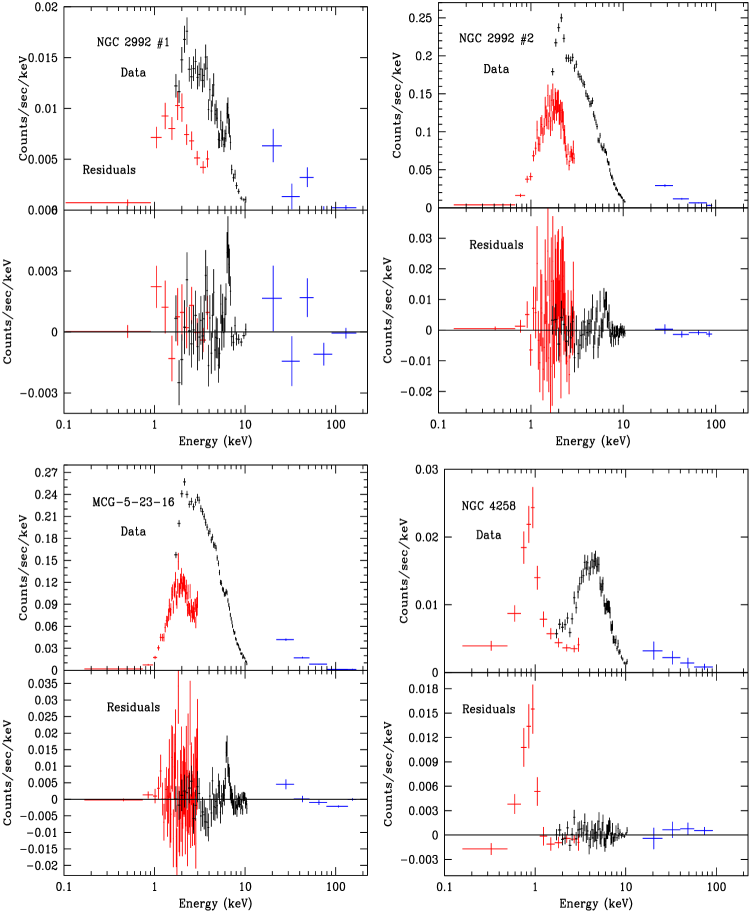
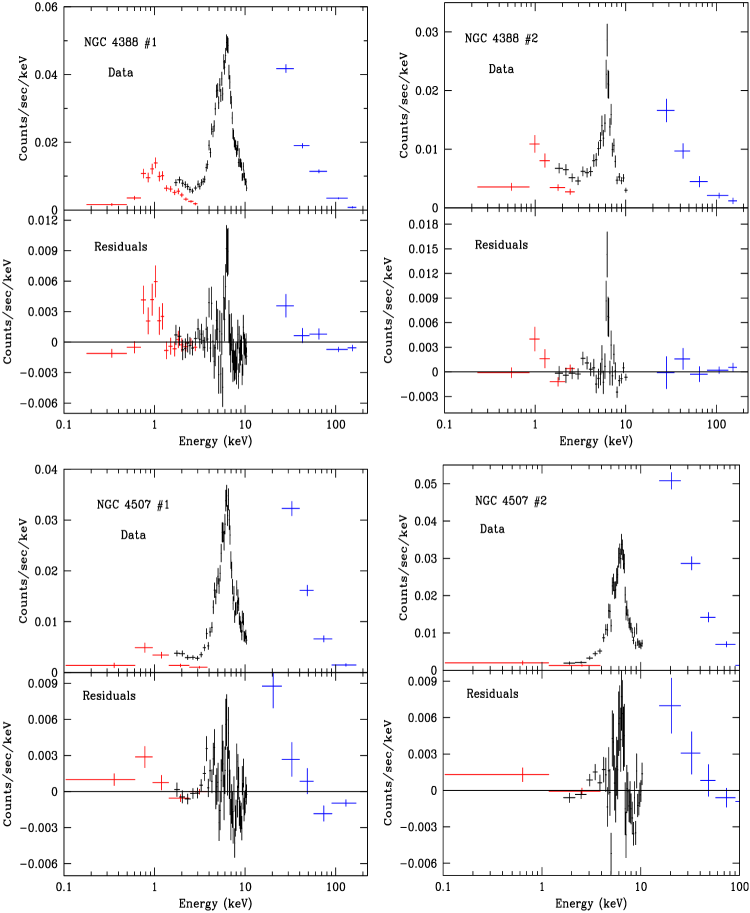
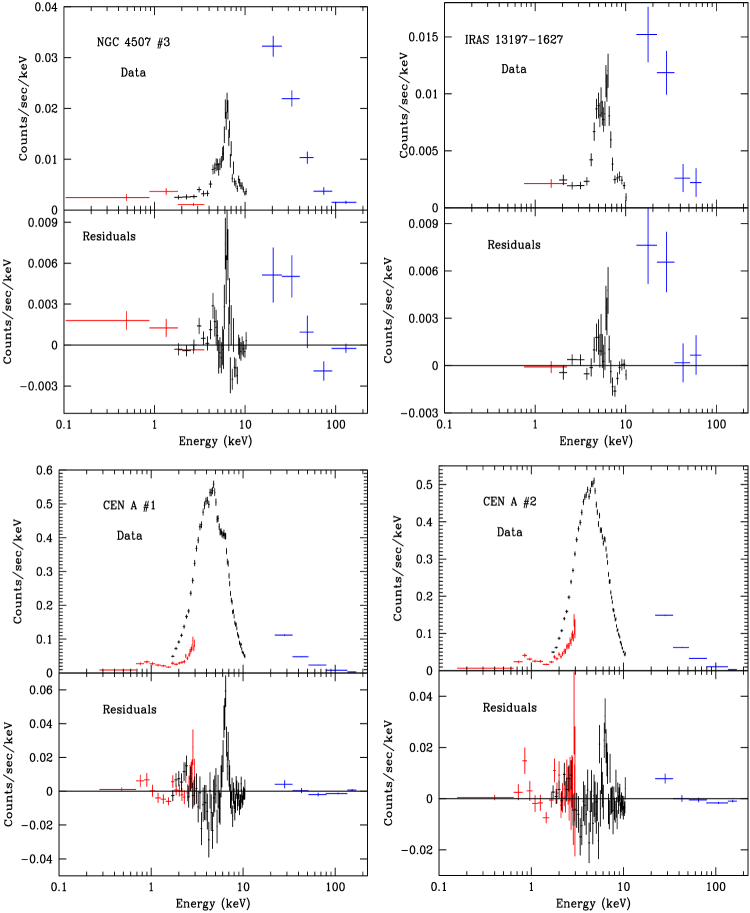
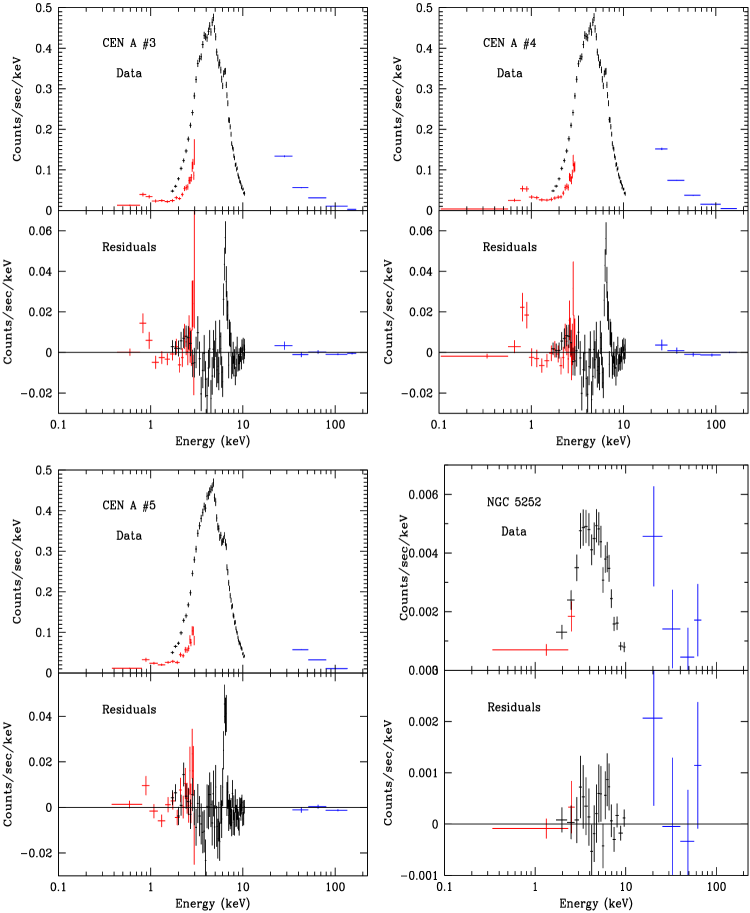
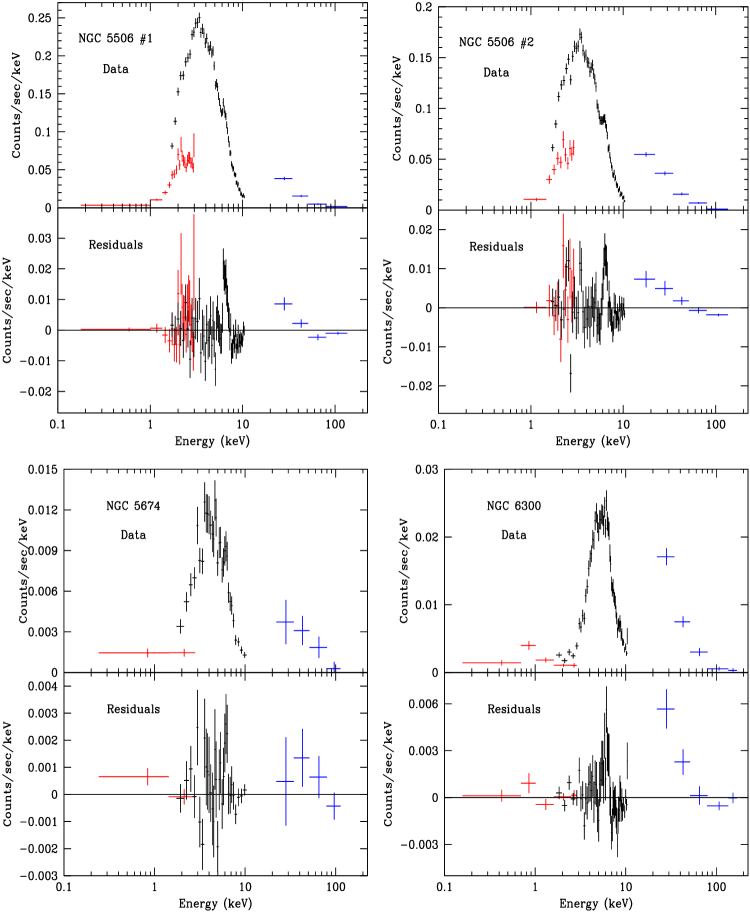
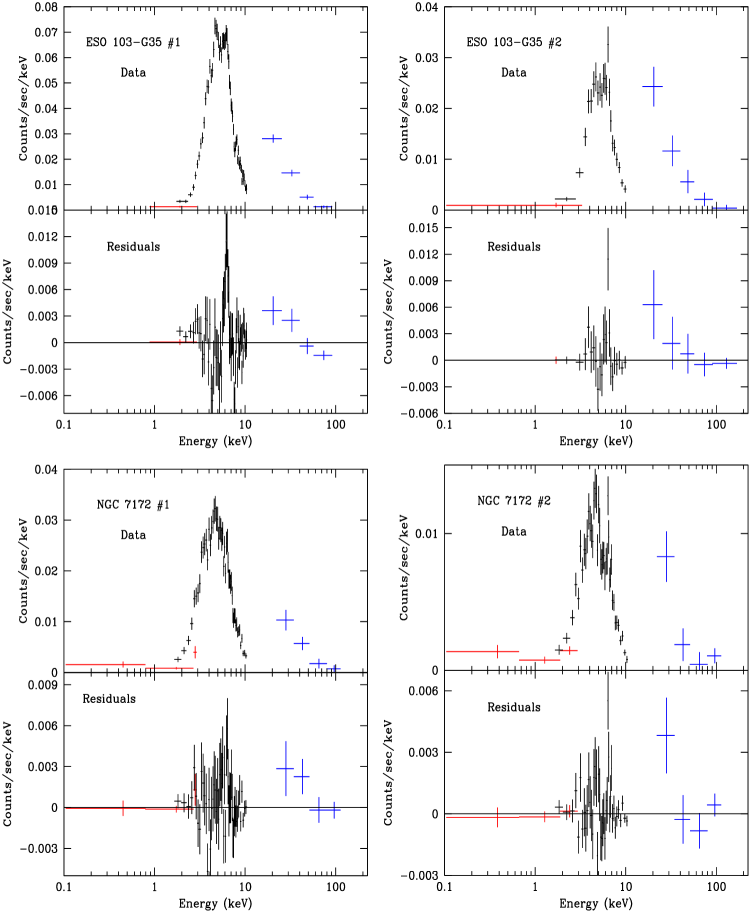
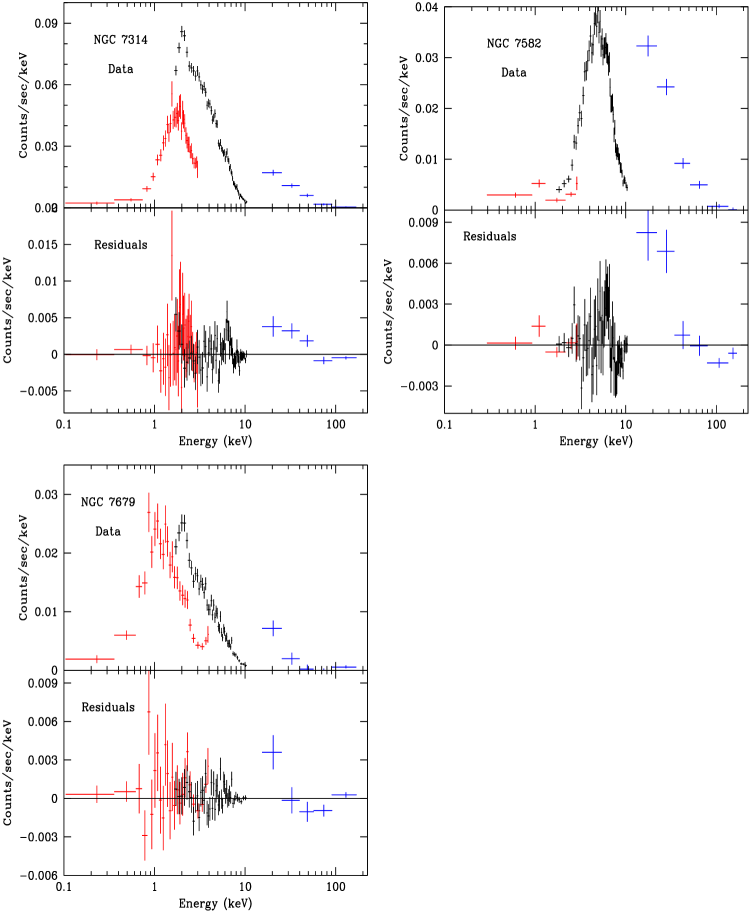
First, we fitted the data with a simple model, consisting of an absorbed power law plus an unabsorbed power law. This model is a good zero-order approximation of the continuum in Seyfert 2s. Our main aim is to highlight the other spectral features from the analysis of the residuals. In Table 3 we show the results of the spectral analysis. In Fig. 7 we plot for each spectrum the folded data+model and the contribution to from each spectral bin. This is an effective way to look graphically for statistically significant unfitted features.
Name Fluxa N Re /d.o.f. NGC 526a 1.72 1.55 1.6 1.3 38 278/242 NGC 1365 0.68 1.58 44 1.8 11 129/77 IRAS 05189-2524 0.35 2.41 8.6 2.1 218 88/72 NGC 2110 3.00 1.65 3.9 1.48 24 358/282 NGC 2992 #1 0.61 1.46 0.66 – – 253/174 NGC 2992 #2 7.37 1.69 0.85 – – 402/349 MCG-5-23-16 9.28 1.72 1.63 – – 536/376 NGC 4258 0.79 2.33 13.3 1.85 23 266/197 NGC 4388 #1 2.53 1.60 41.4 1.73 42 382/239 NGC 4388 #2 0.94 1.58 54 1.75 18 166/105 NGC 4507 #1 1.84 1.68 64 1.2 174 334/186 NGC 4507 #2 1.65 1.66 59 0.93 260 230/138 NGC 4507 #3 0.87 1.50 64 1.1 63 258/127 IRAS 13197-1627 0.47 1.70 33 3.5 6.5 144/87 Centaurus A #1 19.6 1.79 10.1 1.86 56 417/259 Centaurus A #2 25.4 1.77 9.40 2.05 67 396/273 Centaurus A #3 23.6 1.78 9.83 1.89 65 403/255 Centaurus A #4 23.6 1.78 9.86 2.10 54 407/266 Centaurus A #5 23.1 1.77 9.93 1.53 70 374/247 NGC 5252 0.26 1.52 6.2 3.7 29 80/70 NGC 5506 #1 7.47 1.82 3.46 1.2 96 408/256 NGC 5506 #2 7.21 1.75 3.41 1.7 76 340/228 NGC 5764 0.54 1.70 6.8 2.9 13 91/107 NGC 6300 1.29 1.71 21.9 2.8 78 261/183 ESO 103-G35 #1 2.63 1.94 20.5 – – 255/183 ESO 103-G35 #2 1.53 1.73 20 – – 56/76 NGC 7172 #1 1.12 1.68 10.5 2.6 123 152/165 NGC 7172 #2 0.60 1.59 9.9 2.3 46 153/161 NGC 7314 2.39 1.94 1.08 1.03 25 339/288 NGC 7582 2.0 1.55 12.8 2.1 36 265/187 NGC 7679 0.59 1.95 0.10 1.0 14 207/222
From the analysis of Fig. 7 we can identify the following unfitted features:
-
•
At low energies (E2 keV) several sources present a more complex spectral shape than a simple power-law. This is apparent, for example, for the objects NGC 526a, NGC 4258, NGC 4388, NGC 4507, Cen A.
-
•
An excess around 6.5 keV is present in most observations.
-
•
The high energy spectrum (E 20 keV) is in many cases convex, and cannot be reproduced by a single power-law.
We also note that in all the sources but one (NGC 7679) the photoelectric cut-off is highly significant, and permits a precise determination of the absorbing column density, NH.
Name N E kTd E W EW /d.o.f. NGC 526a 1.54 1.6 176 1.1 6.65 0.33 182 251/238 NGC 1365 0.75 26 44 2.7 6.22 – 642 106/74 IRAS 05189-2524 2.33 7.6 0.88 6.47 239 86/68 NGC 2110 1.62 3.7 6.34 235 275/278 NGC 2992 #1 1.63 1.1 1.1 6.61 0.16 684 172/170 NGC 2992 #2 1.71 0.85 – 6.55 0m 103 359/346 MCG-5-23-16 1.69 1.54 261 – 6.44 – 108 440/373 NGC 4258 2.25 12.1 0.67 6.56 80 162/192 NGC 4388 #1 1.23 31.4 108 2.4 6.42 0.28 606 272/236 NGC 4388 #2 1.25 38 264 3.4 6.36 564 111/101 NGC 4507 #1 0.69 38.5 36 3.7 6.35 0.43 1150 234/182 NGC 4507 #2 0.56 34.6 35 6.44 0.44 940 150/134 NGC 4507 #3 0.1 20.4 27.1 2.3 6.44 0.23 1000 164/124 IRAS 13197-1627 1.31 24.4 1.0 6.40 0m 463 116/77 Centaurus A #1 1.72 9.70 6.7 6.40 0m 98 297/256 Centaurus A #2 1.70 9.07 351 4.7 6.38 0m 50 342/270 Centaurus A #3 1.73 9.46 5.9 6.52 0m 109 271/252 Centaurus A #4 1.73 9.54 4.0 6.52 0m 108 291/263 Centaurus A #5 1.83 10.1 15 6.46 0m 118 307/244 NGC 5252 1.68 6.1 6.48 267 76/66 NGC 5506 #1 1.82 3.28 0.50 6.59 0.26 199 321/253 NGC 5506 #2 1.68 3.15 214 2.3 6.48 130 282/224 NGC 5764 1.69 6.3 1.1 6.36 221 82/103 NGC 6300 1.62 20.7 1.0 6.4m 0.44 267 236/180 ESO 103-G35 #1 1.69 18.2 84 – 6.44 0.20 234 185/181 ESO 103-G35 #2 1.62 18.3 6.49 244 44/72 NGC 7172 #1 1.64 9.7 6.46 116 148/162 NGC 7172 #2 1.72 10.8 6.62 157 149/157 NGC 7314 1.79 0.86 0.18 6.49 169 330/284 NGC 7582 1.31 10.5 109 1.04 6.28 0m 112 243/184 NGC 7679 1.70 1.1 – – – 208/221
At high energies the observed curvature can have two different origins: an high energy exponential cut-off, or a reflection component. In this case a degeneracy between these two components is possible, so we fitted our data with two new models: in the first one (model B) we replaced the unabsorbed power-law with a Raymond-Smith thermal model, and we added a Gaussian and an exponential cut-off to the absorbed power-law. In the second model (model C) we also added a warm reflection component, using a power-law with the photon index equal to that of the primary continuum, and a cold reflection component, using the PEXRAV model in XSPEC. This model assumes an infinite plane geometry for the reflector. This may not be a good approximation of the real reflector. However, the overall spectral shape of the reflection component should be only weakly dependent on the details of the absorber. The dependence of the spectral shape on the reflection angle in the PEXRAV model is low, therefore, given the uncertainty in the real absorber geometry, we chose to fix the inclination angle in the PEXRAV model to the value of 30 deg (the value has been chosen in order to have an average ratio between the observed section of the absorber and it real area of ). The results of the fits with model C are summarized in Table 5.
Name N E kTd E W EW R R /d.o.f. NGC 526a 1.54 1.6 176 1.1 6.65 0.33 182 251/237 NGC 1365 1.74 39 1.0 6.24 0m 290 3.8 91/72 IRAS 05189-2524 2.59 8.6 – 6.46 256 0.02 78/68 NGC 2110 1.66 3.8 6.38 242 274/277 NGC 2992 #1 1.77 1.4 1.16 6.63 765 0.8 170/169 NGC 2992 #2 1.79 0.93 – 6.52 0.36 154 0.3 350/344 MCG-5-23-16 1.77 1.59 157 – 6.45 126 0.54 404/373 NGC 4258 2.25 12.1 0.67 6.56 80 162/191 NGC 4388 #1 1.58 38 1.40 6.46 233 0.3 0.016 236/233 NGC 4388 #2 1.47 48 1.07 6.38 525 0.06 100/99 NGC 4507 #1 1.51 59 126 0.87 6.40 0.33 297 0.7 206/180 NGC 4507 #2 1.56 54 0.71 6.47 0.37 520 0.9 132/133 NGC 4507 #3 1.70 71 0.78 6.43 433 2.0 132/122 IRAS 13197-1627 1.77 33 0.90 6.43 585 2.1 98/77 Centaurus A #1 1.81 10.0 – 6.48 0.33 173 0.18 0.015 259/254 Centaurus A #2 1.78 9.30 0.56 6.41 75 0.15 0.011 290/267 Centaurus A #3 1.73 9.43 – 6.57 138 0.015 259/250 Centaurus A #4 1.73 9.36 530 0.54 6.57 141 0.014 245/260 Centaurus A #5 1.75 9.43 0.47 6.45 117 0.09 0.014 255/241 NGC 5252 1.83 6.8 0.54 6.47 278 1.6 71/65 NGC 5506 #1 2.03 3.68 6.70 0.36 229 2.3 269/251 NGC 5506 #2 2.02 3.85 0.84 6.52 164 1.2 224/220 NGC 5674 1.82 6.5 1.1 6.36 236 1 79/102 NGC 6300 1.87 22.8 0.82 6.27 0m 150 1.1 197/179 ESO 103-G35 #1 1.85 19.7 87 – 6.37 0.22 215 0.4 172/180 ESO 103-G35 #2 1.85 20.5 – 6.49 224 0.7 42/73 NGC 7172 #1 1.88 11.1 6.4m 0m 90 1.1 142/162 NGC 7172 #2 1.97 11.0 0.19 6.55 199 2.4 140/156 NGC 7314 2.07 1.22 3.7 6.37 102 2.4 276/283 NGC 7582 1.93 14.3 0.78 6.4m 0m 183 2.2 175/184 NGC 7679 2.08 0.6 – – – – 2.7 – 198/220
4 Results and Discussion
Our models A,B,C provide a good fit to almost all the sources of the sample: we obtained a reduced lower than 1.10 in 29 cases out of 31. The best model for each observation, and the reduced are listed in Table 6. We briefly comment about the “bad” fits ( 1.1) in the Appendix. Here we discuss the main results of our analysis:
Name Mod. NGC 526a B 1.05 NGC 1365 C 1.26 IRAS 05189-2524 C 1.15 NGC 2110 B 0.99 NGC 2992 #1 B 1.01 NGC 2992 #2 C 1.02 MCG-5-23-16 C 1.08 NGC 4258 B 0.84 NGC 4388 #1 C 1.01 NGC 4388 #2 C 1.01 NGC 4507 #1 C 1.08 NGC 4507 #2 C 0.99 NGC 4507 #3 C 1.08 IRAS 13197-1627 C 1.27 Centaurus A #1 C 1.02 Centaurus A # 2 C 1.09 Centaurus A # 3 C 1.04 Centaurus A # 4 C 0.94 Centaurus A # 5 C 1.10 NGC 5252 C 1.09 NGC 5506 #1 C 1.07 NGC 5506 #2 C 1.02 NGC 5674 C 0.77 NGC 6300 C 1.10 ESO 103-G35 #1 C 0.95 ESO 103-G35 #2 B 0.61 NGC 7172 #1 C 0.88 NGC 7172 #2 C 0.90 NGC 7314 C 0.98 NGC 7582 C 0.95 NGC 7679 C 0.90
4.1 Photon Index
The wide energy range and the good statistics of our spectra allow a precise determination of the photon index of the continuum power-law: 90% errors are typically a few percent. The photon index distribution is plotted in Fig. 1 versus the ratio between the reflected and transmitted component (see below for a discussion on this ratio).

The data are from the best fit model, either B or C, according to the minimun reduced . The average photon index is . The 1 dispersion is 0.23. A similarly interesting parameter is the “effective” photon index, i.e. the slope of a simple power-law fitting the whole spectrum (model A). This parameter is important for studies where the average X-ray SED of AGNs is approximated with a simple power-law (for example, in most synthesis models of the cosmic background). The average photon index derived from Table 3 is with a 1 dispersion of 0.21. The small discrepancy between the two evaluations of are due mainly to the contribution of the reflection component, which is higher at high energies, so flattening the spectrum. The contribution of the high-energy cut-off is small, since for most of the sources only a lower limit can be determined (see below). We note that our sample is the best currently available to determine the average of Seyfert galaxies. The typical extent of this interval is from 2-3 keV up to 200 keV, and even in the worst cases it is more than a decade (from 5-6 keV to 100 keV for NGC 4507). This is a significant improvement with respect to past works, based on GINGA or ASCA data. The photoelectric cut-off does not significantly reduce the energy range over which we observe the intrinsic emission of the AGN and, on the other side, makes simpler the separation of the low energy component.
4.2 Reflection components
Cold reflection: the cold reflection component peaks around 30 keV. Therefore, the PDS instrument allows a much better measurement of this feature than low energy instruments. The model we used assumes a viewing angle of 30o. Given the statistics in the PDS range, a variation of this angle is analogous to a change in the normalization, since the spectral changes are too tiny to be discriminated. The quantity used to measure the strength of reflection is the ratio, R, between the normalizations of the reflected and transmitted components. A comparison between Table 4 (model B, with no reflection) and Table 5 (model C, with reflection) illustrates the importance of a correct estimate of the reflection component. In most cases adding a reflection component significantly improves the fit (26 out of 31, Table 6). Moreover, in these cases a fit without reflection gives biased estimates of the continuum components: for example, photon indexes and high energy cut-offs are systematically lower in Table 4 than in Table 5.
Finally, it is worth noting that the errors associated to R are significantly higher than those of the other free parameters. This is an effect of the partial degeneracy between the different spectral components, in particular the intrinsic power law, the high-energy cutoff and the cold reflection component. If we freeze these parameters when estimating the errors on R, we obtain much smaller errors.
One of the main debates regarding the cold reflection component is whether it originates from the accretion disk or from cold material farther from the center (eg. the putative “torus” of unified models). Our sample contains multiple observations of 7 sources. This gives us the possibility to study the long term variability of the cold reflection component, and thus to give an estimate to the distance of the reflecting medium: if the reflector is the accretion disk, we expect the reflection and transmitted component to be closely related. In the other case, if the reflector distance from the center is greater than the light path in the characteristic variability time of the primary component, we expect the reflected component to remain constant. In order to study the correlation between the variability of the transmitted and reflected components, we define for each pair of observations of the same source a ratio f=F1/F2 where F is the 2-10 keV flux, and a ratio r=R2/R1. If the reflected component varies together with the transmitted one, the quantities Ri are expected to remain constant, and therefore r=1. If, on the other side, the absolute flux of the reflected component remains constant, then R 1/Fi, and r=f. In Fig. 2 we plot the quantities r and f. For each pair, we chose the fluxes in order to have F (then f). For the two sources with more than two observations (NGC 4507, three observations, and Cen A, 5 observations), we have 2 and 4 pairs, respectively. In these cases, F2 is defined as the lowest measured flux among all the observations of the same source. We also plot the two lines corresponding to r=1 and r=f. The plot clearly shows that the r=f line better represents the measures. This is strong evidence supporting a distant reflector, while the cold reflection from the disk is ruled out by the data.

If the cold reflection is mainly due to a distant reflector, the simplest structure of the circumnuclear medium would be obtained with a single cold medium responsible for both the cold reflection and absorption of the hard X-rays. However, in this scenario the ratios between the reflected and transmitted components are somewhat surprising. The model we used assumes a perfect efficiency reflection (i.e. no transmission) from an infinite plane slab covering a 2 angle. The normalization factor of the model is relative to the intrinsic continuum. Therefore, even assuming a perfectly face-on line of sight, the ratio between the normalizations of the reflection model and of the power-law should be not higher than 2. The value R=2 is for a completely Compton-thick reflector covering the whole plane angle. Assuming a different geometry for the reflector, in particular a non-planar one, can only slightly change the overall efficiency, as we can evaluate from the comparison of the PEXRAV model with the one of Ghisellini et al. (1994), which assumes a toroidal geometry for the absorber: the results are in agreement within a factor of . The model of Ghisellini et al. 1994 also shows that the reflection efficiency drops with the thickness of the reflector: at 30 keV the reflection efficiency is 55% for a Compton thick reflector (N cm-2), 23% for N cm-2 and only 8% for N cm-2. The values for the ratio we obtained (Table 5) are in many cases too high to be explained assuming a homogeneous reflector having the same column density as measured in absorption. In the extreme case of NGC 1365 the best fit value, R=3.8, is not acceptable. We discuss this case in the Appendix. Out of the other 20 objects, 17 have the value of R higher than the maximum allowed by the models described above, the only exceptions being NGC 526a, NGC 2110, NGC 4258 and Cen A. Part of the discrepancy can be due, in some cases, to the fact that the source is observed in a low state, and therefore the value of R is high, as explained above. However, this cannot be the case for 18 sources out of 21. Moreover, even in those cases where multiple observations are available, R is too high even in the high flux states. The only possible explanation is that the absorber is not homogeneous, and a Compton thick medium covers a significant fraction of the solid angle (but not the line of sight). We note that other recent studies on variability of NH support the view of a non homogeneous absorber (Risaliti et al. 2002).
Finally, our sample is useful to investigate the putative correlation between the photon index and the ratio R. Such correlation has been first claimed by Zdziarski et al. 1999, and further analyzed by Matt (2000) and Petrucci et al. (2001), taking advantage of the broad BeppoSAX band. At present it is still debated, since the two parameters are not independent in the fitting procedure, an increase of being compensated by a decrease of R. In Fig. 1 we plot the two quantities. A slight increase of for R is present, but the correlation is weaker than that found by Petrucci et al. 2001 for a sample of bright Seyfert 1s. We can explain this discrepancy using an argument of Matt 2000. In order to give a warning about the reality of this correlation, this author shows that if the soft component of the Seyfert 1 MKN 841 is fitted with a warm absorber instead of a blackbody, the best fit photon index changes by and, as a consequence, R changes by a factor or . This example shows how strong is the dependence among the different components of the continuum models. As we already pointed out above, our fits are made safer by the presence of the photoelectric cut-off, which clearly separates the soft component from the others. As a consequence, the statistical dependence among the two quantities is weaker in our sample. Therefore, the results plotted in Fig. 1 suggest that the correlation is probably not real.
Warm reflection: Adding a warm reflection component improves the fit only for three sources (IRAS 05189-2524, NGC 4388 and Cen A, see Table 5). In these cases the reflection efficiency is between 1% and 6%. In all the other cases we were able to estimate an upper limit for the warm reflection of the order of a few percent of the intrinsic component.
4.3 The high-energy cut-off
The energy of the exponential cut-off is plotted versus the photon index in Fig. 3.
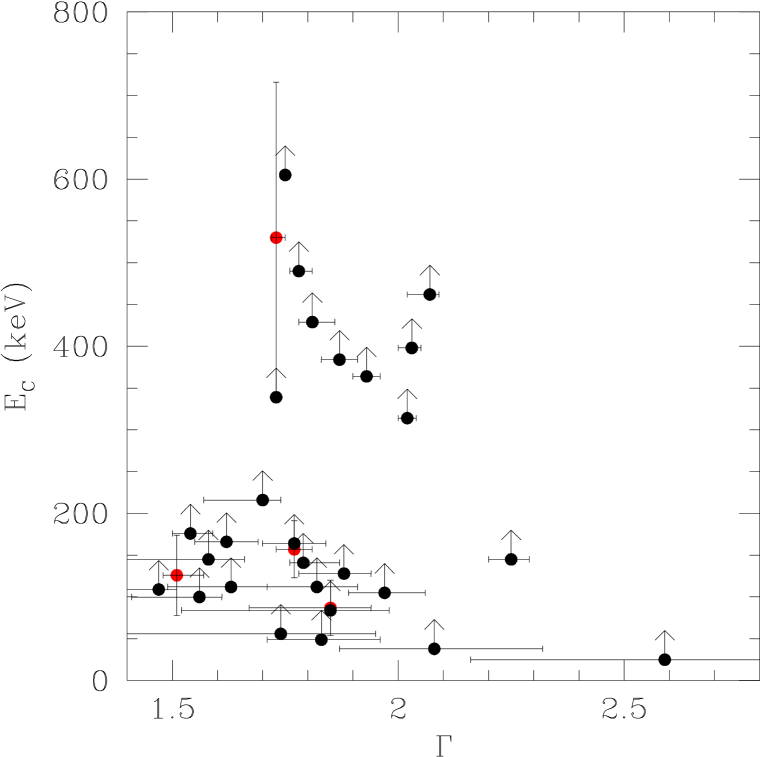
In most cases we have only lower limits, however some interesting conclusions can nevertheless be drawn. Many lower limits are too low to give significant constraints. However, we note a significant fraction of detections and lower limits higher than 300 keV: 6 sources out of 20 have have E300 keV. We conclude that a photoelectric cut-off in the 100-300 keV band is not an ubiquitous property of Seyfert galaxies.
4.4 The iron line
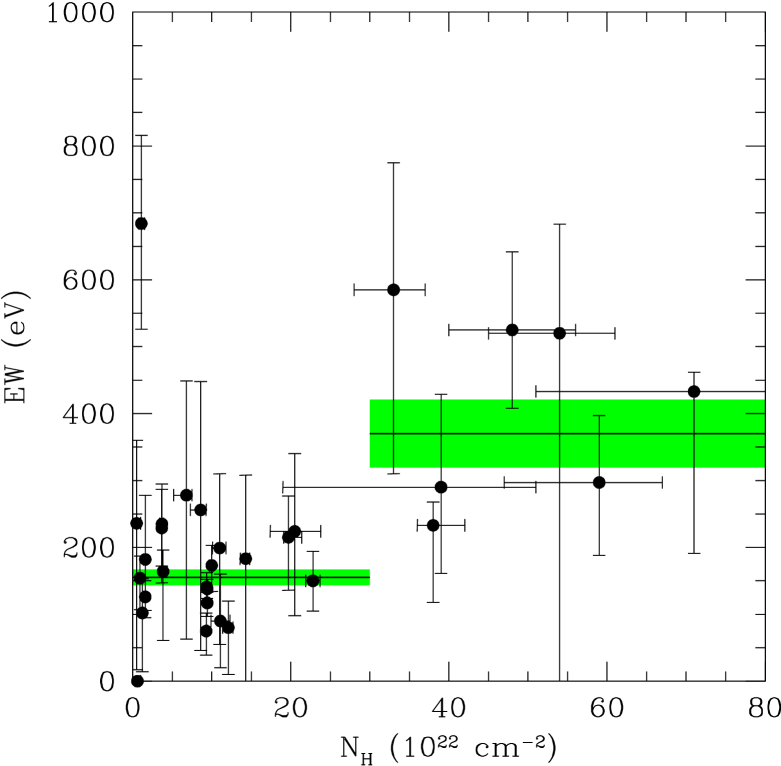
Equivalent width: We detect an iron K line in all the observations but one (NGC 7679). The equivalent width, EW, is in the range 100-300 eV for sources with low absorbing column density (N cm-2), in agreement with previous studies, and with the values found in Seyfert 1s (Gilli et al. 1999). In sources with a larger NH, the continuum at the energy of the line is partially absorbed, and the EW of the iron line is therefore expected to be higher. In Fig. 4, where we plot the EW of the iron line versus NH. A correlation is present: sources with N cm-2 have on average an EW higher that sources with N, even if the errors are too large to draw solid conclusions.
This correlation suggests that the iron line is produced, at least in part, by a reflector different from the accretion disk. Otherwise, we would not expect any increase of EW with NH, since the line would be as much absorbed as the continuum component. In Fig. 5 we plot the line EW versus the cold reflection ratio, R. A correlation is non clear, even if the errors are again too large to rule out an average increase of EW with R. We also note that in this kind of correlations, where the expected variation of EW is a factor of no more than 2-3, an important role could be played be the inclination of the accretion disk with respect of the line of sight: the primary continuum emission from an edge-on disk is weaker than that of a face-on disk with the same intrinsic luminosity. Therefore, if the iron line is partly produced by an outer reflector, the EW depends on the inclination angle. The effect is a further dilution of the correlations we are trying to investigate.

Line energy and width: In all cases the measured peak energy is compatible with neutral or little ionized iron. In 9 cases out of 31, we measure a line width significantly larger than 0. For all these cases we analyzed the model residuals to look for asymmetries in the line profile. We did not find any significant asymmetry, except than in one case, NGC 6300, which is discussed in the Appendix, and represents a convincing example of a relativistic line in Seyfert 2s.
4.5 Soft excess
In this work the soft emission is not analyzed in detail. A single thermal component, plus the warm reflection component, are used to fit the points at energies lower than the photoelectric cut-off. This gives on average good fits. The residuals at low energies are in no case high enough to alter the best fit values of the other high energy parameters which we are more interested to. In the simple model A we fit the soft component with a power-law with a free photon index. The ratio between the absorbed and the unabsorbed power-laws, reported in Column 6 of Table 3, shows that the normalization at 1 keV of the “soft” component is typically a few percent of that of the absorbed component. This confirms the separation of our fits in two almost independent parts: the high energy components depends only on the data at energies higher than the cut-off, while the soft component is entirely determined by the low energy counts.
5 Conclusions
We presented a homogeneous analysis of 31 spectra of 20 Compton thin Seyfert 2s observed with the BeppoSAX satellite. We fitted the spectra with multi-component models, including a cold and warm reflection, an iron line, a low-energy thermal emission, and a primary continuum modeled with an absorbed power law with a high-energy cut-off. We also investigated the main correlations among the best fit parameters, in order to test the unified models. The main conclusions are the following.
-
1.
Testing Unified models: The spectra of the objects in our sample are in good agreement with the standard unified model of AGNs: the primary continuum is well represented by a power law with photon index , with a dispersion . This is in agreement with previous studies on the hard X-ray emission of Seyfert 2s (Turner et al. 1997, Nandra & Pounds 1989, Smith & Done 1997, Turner & Pounds 1989), and with the hard X-ray spectra of Seyfert 1s. All the objects but one show significant cold absorption by gas with column density cm-2, in agreement with the optical classification of type 2 or 1.8/1.9. The only exception, NGC 7679, is an intriguing object, with no significant absorption in excess to Galactic in the X-rays, but also with no evidence of broad lines in the optical (see the Appendix and Della Ceca et al. 2001 for further discussion). We also fitted the hard spectrum of our objects with a simple absorbed power law, in order to compute the average observed photon index, . We found , with a dispersion .
An iron K emission line at energies keV is found in all the objects but one (NGC 7679). In agreement with the unified model, the average equivalent width of the line is higher in objects with higher absorbing column density. In 6 cases we found a broad profile of the line. In one case (NGC 6300) this profile is best fitted with a relativistic model. In the other 5 cases, the statistics is not enough to test models of relativistic lines.
-
2.
A reflected component is present in most of the objects (17 out of 21). A debated issue on X-ray spectra of Seyferts is whether the reflection is due to the accretion disk or to a farther reflector. Comparing the variations of the direct and reflected components in the 7 sources with multiple observations, we find that the variability data are better reproduced assuming that the reflector is located far ( light year) from the primary source.
-
3.
The ratio between the reflected and direct components is on average too high for a homogeneous reflector with the same column density as measured in absorption in our spectra. This is an indication that the circumnuclear medium is not homogeneous and probably a Compton thick gas cover a significant fraction of the solid angle. This structure is also suggested by X-ray variability studies of Seyfert galaxies (Risaliti et al. 2002) and will be further tested in a forthcoming detailed study of variability of this sample of AGNs (Risaliti et al. 2002, in preparation).
Acknowledgements.
I am grateful to the referee, Dr. K. Iwasawa, for helpful comments. This work was partially supported by the Italian Ministry for University and Research (MURST) under grant Cofin00-02-36.Appendix A Analysis of single sources
NGC 526a: The same set of BeppoSAX data on this source have been analyzed by Landi et al. (2001). The results obtained by these authors are in agreement with ours, within the errors. In particular, it is confirmed the relatively flat continuum spectrum: the best fit values for the photon index of the intrinsic power law are in the 1.47-1.6 range, in agreement with our result, .
NGC 1365: NGC 1365 is one of the few sources for which our models do not provide a good fit (=1.26 in model C). A more careful analysis of this object was performed by Risaliti et al. (2000). According to this work, the PDS data of NGC 1365 could be contaminated by the nearby active galaxy NGC 1386. Moreover, NGC 1365 shows an high and complex variability during the BeppoSAX observation. However, the best fit values in Risaliti et al. 2000 are in agreement with those obtained with our model C.
NGC 2992: This source shows the strongest long-term variability in our sample. Our analysis is in agreement with that of Gilli et al. (2000).
IRAS 05189-2524: The BeppoSAX observation of this source was analyzed in detail by. Severgnini et al. 2000 The reflected component is not required from the fit ( with one more free parameter). The fit obtained with model B is in agreement with that of Severgnini et al. (2000). The poor statistics (=1.2) is mainly due to an excess in the PDS data around 20 keV. The statistics is however not good enough to understand whether this excess is real or not. We note that given the high noise in the PDS data, Severgnini et al. 2000 chose not to use these data in their analysis.
NGC 4258: NGC 4258 is a nearby galaxy (estimated distance Mpc) hosting a weak AGN. In this object the integrated X-ray emission of galactic sources is not negligible with respect to the AGN contribution. Therefore, in models B and C we added an extra bremmshtralung component to take into account for the galactic contribution. The best fit temperature (kT=7 keV) and normalization are in agreement with those estimated in 5 different measures performed with ASCA (Reynolds et al. 2000). Our results is in agreement with the more detailed analysis of the same data performed by Fiore et al. (2001).
NGC 6300: In Fig. 6 we plot the residuals of the best fit of NGC 6300, obtained with model C, but without the Gaussian component that fits the iron K line. The asymmetry of the line is apparent: a clear “red wing” extends down to keV, while a broad blue wing is absent. We fitted this excess with a relativistic line model. We used the DISKLINE model in XSPEC, leaving all the parameters free. The best fit is obtained with a strongly relativistic profile: the best fit inner radius of the emitting region is 6.5 Shwarzchild radii; the inclination is . The improvement of the fit, with respect to the simple gaussian fit, is . We also tried a diskline modelem for a rotating disk, but the fit is worse, since this model can well reproduce the broad red wing, but not the narrow peak at E=6.1 keV. We note that a possible warning on this result could come from the high NH of this source (N cm-2). This implies that the continuum at the low energy peak of the line is partially absorbed. This could introduce systematic errors, making the reality of the red wing of the line less certain than it appears in our fit.
Another possible scenario is the one proposed by Guainazzi (2001): a good fit of the MECS spectrum can be obtained accepting very high values of the ratio R between the reflected and intrinsic component (R). In this way the flat profile of the cold reflection spectrum can reproduce the excess between 4 and 6 keV which has been interpreted above as a relativistic wing of the iron line. Such high values of R are possible, as suggested by Guainazzi (2001), if the intrinsic flux is variable, since the observed reflection component is produced by radiation emitted at a different time with respect to the observed primary emission.

ESO 103-G35: The BeppoSAX data of this source have been analyzed by Wilkes et al. (2000). Even if the models used in our work are slightly different, the basic results are in agreement with these authors. The only noticeable discrepancy is about the high energy cut-off measurements. In the first observation we find E keV. This is the lowest measured cut-off energy in our sample, but it is significantly higher than that found by Wilkes et al. 2000 (E keV).
NGC 7172: There are two published works on the analysis of the same data (Akylas et al. 2001 and Dadina et al. 2001). Akylas et al. 2001 propose a model with no reflection. Their best fit parameters are in agreement with our model B (Table 4). Dadina et al. 2001 find that the inclusion of a cold reflection slightly increase the goodness of the fit. The best fit slope of the continuum is significantly higher in this model Our results are in agreement with Dadina et al. 2001. Our best fit model C (Table 5) is only slightly better than model B, and predicts a steeper intrinsic continuum (), than model B (, in agreement with Akylas et al. 2001).
NGC 7582: Turner et al. (2000) present a detailed analysis of the same BeppoSAX data. The results are compatible, but these authors prefer a different interpretation for the high energy emission in excess of the simple powerlaw, which we fit with a strong cold reflection component. Arguing that the required reflection component is too high, they suggest that the intrinsic continuum (which is completely covered by gas with N cm-2, in agreement with our results), is also absorbed by a second screen with N cm-2, and a covering factor of %.
NGC 7679: This source is peculiar within our sample, for it is the only one with negligible X-ray absorption. The optical classification (pure Seyfert 2) suggests that the BLR emission is obscured by dust by at least 3-4 magnitudes . This, assuming a galactic dust-to-gas ratio, would imply an absorbing column density of at least 6-7 1021 cm-2. We can explain this discrepancy in two ways: a) the dust-to-gas ratio could be much higher than galactic, or the dust could be associated to a warm absorber; b) there could be a “hole” in the absorber of the nuclear source, so that the X-ray emission from the accretion disk is unabsorbed, but the broad lines, emitted by the larger Broad line Region, are obscured. This scenario is not unplausible, given the recent evidence of a complex structure in the Seyfert 2 absorbers (Risaliti et al 2002). Both the fits with and without the reflected component are acceptable (see Table 4 and 5). In our analysis the best reduced is obtained with a steep power law plus a strong reflected component. However, in a recent study of the same data, Della Ceca et al. (2001) propose a best fit model in agreement with the one in Table 4, without reflection, and with a photon index .
References
- a (1) Akylas A., Georgantopoulos I., & Comastri A., 2001, MNRAS, 324, 521
- a (2) Boella G., Butler R.C., Perola G.C., Piro L., Scarsi L. & Bleeker J., 1997a, A&AS 122, 299
- a (3) Boella G., Chiappetti L., Conti G. et al., 1997b, A&AS 122, 327
- a (6) Dadina M., Bassani L., Cappi M., et al., 2001, A&A 370, 70
- a (6) Della Ceca R., Pellegrini S., Bassani L., et al. 2001, A&A 375, 781
- a (7) Elvis M., 2000, ApJ, 545, 63
- a (8) Fiore F., Pellegrini S., Matt G., et al. 2001, ApJ 556, 150
- a (9) Frontera F., Costa E., Dal Fiume D., et al., 1997, A&AS 122, 357
- a (10) Ghisellini G., Haardt F., & Matt G., 1994, MNRAS 267, 743
- a (15) Gilli R., Comastri A., Brunetti G., & Setti G., 1999, NewA, 4, 45
- a (19) Gilli R., Maiolino R., Marconi A., Risaliti G., Dadina M., Weaver K.A., & Colbert E.J.M., 2000, A&A 355, 485
- a (23) Guainazzi M., et al., 1999, A&A 346, 407
- a (23) Guainazzi M., 2002, MNRAS 329, L13
- a (25) Haardt F., & Maraschi L., 1993, ApJ 413, 507
- a (26) Landi R., Bassani L., Malaguti G., et al., 2001, A&A 379, L46
- a (27) Malaguti G., et al. 1999, A&A, 344, 857
- a (32) Matt G., Perola G. C., & Piro L., 1991, A&A 247, 25
- a (33) Matt G., Brandt W. N., & Fabian A.C., 1996, MNRAS 286, 823
- a (35) Matt G., 2000, proceedings of “X-Ray Astronomy ’99”, in press (astro-ph 0007105)
- a (35) Nandra K., & Pounds K.A., 1994, MNRAS 268, 405
- a (40) Nandra K., George I.M., Mushotsky R.F., Turner T.J., & Yaqoob, T., 1997, ApJ, 476, 70
- a (41) Nicastro F., et al. 2000, ApJ 536, 718
- a (43) Parmar A.N., Martin D.D.E., Bavdaz M., et al., 1997, A&AS 122, 309
- a (44) Perola G. C., et al. 1999, A&A 351, 937
- a (45) Perola G. C., et al. 2000, A&A 358, 117
- a (46) Petrucci P. O., Maraschi L., Haardt F., et al. 2001, A&A 556, 716
- a (48) Risaliti, G., Maiolino, R., & Bassani, L. 2000, A&A, 356, 33
- a (49) Risaliti G., Elvis M., Nicastro F., 2002, ApJ in press
- a (50) Risaliti G., Marconi A., Maiolino R., Salvati M., & Severgnini P., 2001, A&A, 371, 37
- a (51) Severgnini P., Risaliti G., Marconi A., Maiolino R., & Salvati M., 2000, A&A, 368, 44
- a (53) Smith D.A., & Done C., 1996, MNRAS, 280, 355
- a (57) Turner T.J., Pounds K.A., 1989, MNRAS, 240, 833
- a (58) Turner T.J., George I.M., Nandra K., & Mushotsky R.F., 1997, ApJS, 113, 23
- a (59) Turner T.J., Perola G.C., Fiore F., Matt G., George I.M., Piro L., & Bassani L., 2000, ApJ, 531, 245
- a (66) Wilkes B.J., Mathur S., Fiore F., Antonelli A., & Nicastro F., 2000, ApJ, 549, 248