The stellar mass to light ratio in the isolated spiral NGC 4414
We present high resolution CO(1-0) interferometric observations and deep
HST B-V-I images of the flocculent isolated Sc type spiral NGC 4414. The
goal is to determine the stellar mass-to-light (M/L) ratio in a galactic disk.
NGC 4414 is an ideal object for this kind of study, as it is an unperturbed
object at high galactic latitude with very extended atomic gas (Hi).
Many Cepheid light curves were measured in NGC 4414 so its distance is
known to be about 19.2 Mpc. NGC 4414 is quite axisymmetric, with no bar and
poorly defined spiral structure, and the center is seen unobscured (no CO,
HI, H, or thermal dust emission near the nucleus), as in many
isolated spiral galaxies. Not only does this result in minimal non-circular
velocities but also, and this is a key to our success, the central light
profile traces the total mass. The stars are seen without a dust screen, the
central gas mass is very low (undetected), and we show that the dark matter is
negligible in the central regions.
We have developed an axisymmetric analytical gravitational
potential model to account for the central light (mass) profile, the dynamics
of the molecular gas in the highly obscured molecular ring, and the stellar
light profile outside the highly obscured region. A single dominant disk
component reproduces the disk dynamics and outer stellar light profile such
that even if other disk components were present they would not affect our
results. The contribution of dark matter is constrained by the extremely
extended HI rotation curve and is small, possibly negligible, at
distances less than 5 – 7 kpc from the center. Furthermore, the M/L ratios
we derive are low, about 1.5 in I band and 0.5 in K′ band. The B and V band
M/L ratios vary greatly due to absorption by dust, reaching 4 in the molecular
ring and decreasing to about 1.6 – 1.8 at larger radii. This unequivocally
shows that models, like most maximum disk models, assuming constant M/L ratios
in an optical waveband, simply are not appropriate. We illustrate this by
making mock maximum disk models with a constant V band M/L ratio. The key is
having the central light distribution unobscured such that it can be used to
trace the mass. The K’ band M/L ratio is virtually constant over the disk,
suggesting that the intrinsic (unobscured) stellar M/L ratio is roughly
constant. A primitive attempt to determine the intrinsic M/L ratio yields
values close to unity in the B,V, and I bands and slightly below 0.5 in K’.
Key Words.:
Galaxies: individual: NGC 4414 – Galaxies: spiral – Galaxies: evolution – Galaxies: ISM – Galaxies: kinematics and dynamics – Galaxies: dark matter1 Introduction
The presence and nature of Dark Matter (hereafter DM) is one of if not the major problem in modern Astrophysics. There is evidence for DM at the scale of individual galaxies, in clusters, and in the universe as a whole (see reviews by Ashman 1992; Sofue & Rubin 2001, and references therein), although a cosmological constant may replace DM at the largest scale. Recent results (Alcock et al. 1998; Renault et al. 1998) make it appear unlikely today that all dark matter could be baryonic, although a large fraction if not all of the DM currently ”observed” in galaxies could be baryonic. Estimating the content and distribution of DM in spiral galaxies is actually very difficult. The first essential step to understand the role of DM in galaxies is to successfully identify the mass contributions of the visible – stellar and gaseous – components. That is the subject of this work.
To do this properly, one must measure the rotation curve in a spiral with extended atomic hydrogen (HI). The rotation curve must be observed with high spatial resolution near the center to avoid beam-smearing effects. Because the visible matter dominates the mass in the central regions of spiral galaxies (even in Cold Dark Matter, hereafter CDM, simulations), the central part of the rotation curve can be used to estimate the mass-to-light (M/L) ratio of the stellar component. To minimize stellar confusion and galactic absorption, our galaxy of interest should be as far as possible from the galactic plane. The last requirement is that the galaxy be at a well known distance. An Sc type would be ideal because they are the most numerous and the mass and luminosity of the bulge are low compared to the disk, making mass-modeling in principle simpler. The galaxy presented here, NGC 4414, satisfies all of these criteria. NGC 4414 is an isolated object and its dynamics are not perturbed by gravitational encounters with other visible galaxies.
| reference | ||
|---|---|---|
| a | ||
| a | ||
| Inclination | a | |
| Position Angle | a | |
| Morphological Type | Sc | b |
| Optical Diameter | 4’ | c |
| Distance | 19.2 2 Mpc | d |
| Systemic Velocity | 716 km s-1 | e |
a: this paper, position of nucleus determined from HST observations of northern field. b: de Vaucouleurs et al. (1991). c: this paper. d: Turner et al. (1998); Thim (2000). e: Braine et al. (1993)
One of the most important questions to resolve is the value of the stellar mass-to-light ratio (M/L) of the galactic disk. In order to model rotation curves of spiral galaxies, the stellar light distribution in a given band is often scaled by the highest M/L ratio possible without generating higher rotation velocities than are actually observed in the inner disk – the so-called maximum disk model. This underlines the need for spatial and spectral resolution. Carbon Monoxide (CO) is an ideal tracer of the rotation curve in the disk because the CO emission comes from the cool dense gas which is naturally closer to the galactic plane and dynamically cold. The lines are much narrower than the H (or H etc.) lines and do not suffer from extinction. The molecular gas, traced by the CO lines, has higher column densities than the HI and can be observed at higher angular resolution. We present high resolution observations of the CO lines obtained with the IRAM interferometer. Earlier interferometric CO observations of NGC 4414 were presented by Sakamoto (1996) and Thornley & Mundy (1997b). The large scale molecular emission has been discussed in Braine et al. (1993, 1997); Braine & Hughes (1999), in which the ratio and its variation with galactocentric radius have been estimated. The H emission, tracing star formation and ionized gas, was measured by Pogge (1989).
Our goal is to strongly constrain the M/L ratio in the disk of NGC 4414 using a combined interferometric CO (inner part) and HI (outer part) rotation curve. NGC 4414 was part of the Hubble Space Telescope (HST) Cepheid key project (Turner et al. 1998) and thus very deep and detailed images are available in the B, V, and I bands. In addition the distance is known to within about 10%. We have chosen the I-band (m) as our reference stellar brightness because the longer wavelength should better trace the stellar mass and is less affected by extinction than the B or V bands.
An absolute distance D is a necessary parameter to estimate the M/L ratio. The luminosity is determined as , where S represents a flux, whereas the mass M is proportional to the galactocentric distance: where is the angular distance to the point whose rotation velocity is . Thus, so D must be known.
In Section 2 we present the new observational data - the HST B-V-I data and the CO(1-0) Plateau de Bure observations. In Section 3 we describe our gravitational potential model, based on the interferometric CO observations and the HST light profiles, to calculate (Sect. 4) the M/L ratio in the B, V, and I bands after subtraction of the gaseous mass. Our results are compared to the rather rare literature estimates of stellar M/L values and to the so-called “maximum disk” method.
In a companion paper we discuss the dark matter distribution in NGC 4414 based on our knowledge of the underlying visible mass and on various spherical and disk DM distributions, particularly those proposed by Navarro et al. (1996) and Moore et al. (1998, 1999) derived from simulations of galaxy formation in a CDM (or CDM) universe. Whether Modified Newtonian Dynamics (MOND, Milgrom 1983) can explain the rotation curve of NGC 4414 without DM is also addressed in the companion paper.
2 Observations and Data Reduction
2.1 HST BVI Observations
2.1.1 Data Reduction
The optical observations presented in this paper have been retrieved from the HST public archive (see Table 2 and Turner et al. (1998)).
| Optical | Obs. | Total Observing | |
|---|---|---|---|
| Band | Date | Time | |
| North | F439W (4311.85 Å) | Ap. 1996 | 5000 s |
| North | F555W (5442.23 Å) | Ap. 1996 | 32430 s |
| North | F814W (8001.59 Å) | Ap. 1996 | 10230 s |
| South | F439W (4311.85 Å) | Ap. 1999 | 2080 s |
| South | F555W (5442.23 Å) | Ap. 1999 | 1600 s |
| South | F814W (8001.59 Å) | Ap. 1999 | 1600 s |
We used WFPC2 automatic calibrated data corrected for ADC errors, bias and superbias levels, superdarks, obturation and pixel surface. The classical reduction procedure was applied using the IRAF software. We first corrected all the images for hot pixels, then cosmic rays were eliminated by combining consecutive exposures of a same field.
After this corrective stage, a mosaic of the 4 fields could be retrieved, or we could treat each field separately. Our goal was to obtain a complete mosaic of the galaxy, with the North (1996 HST Key Project) and South (1999 Hubble Heritage Project) part processed independently.
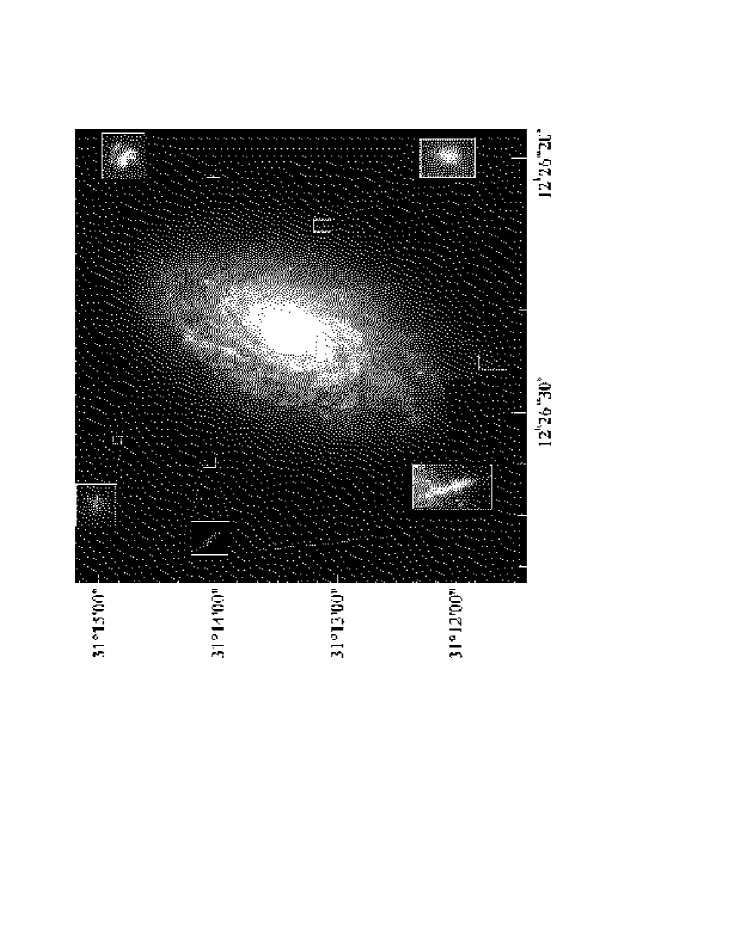
The next step was to estimate the shift between each image before adding them. The procedure is quite simple, only requiring selection of a few stars in each band. Because we calculate the shift and the rotation simultaneously, the stars must be sufficiently bright and homogenously spread over the whole image. This calculation was made using the GEOMAP procedure which models a polynomial transfer function between the reference image and each of the other images. All images in each band were then combined and rotated to obtain the B-V-I mosaics. (see Fig. 1)
2.1.2 Luminosity in the outer part of the galaxy
A bias problem appeared in the HST photometry data as the surface brightness observed far away from the center of the galaxy was abnormally strong. Such a luminosity could not have a physical meaning as it was more than an order of magnitude higher than expected. Because of the size of the galaxy it was not possible to calculate the sky background directly from the HST images.
Optical observations of numerous spiral galaxies, including NGC 4414, were made by Héraudeau & Simien (1996) in order to determine reliable luminosity profiles. Conveniently, they deduced luminosity profiles in the B, V and I bands. We chose to calculate the surface brightness (in ) 100 arcseconds from the center on the major axis of the galaxy. We subtracted a constant value to set the brightness in each band of the HST data at to the surface brightness given by Héraudeau & Simien (1996). The uncertainties for their photometry are quite low and the HST brightness profile after subtraction shows no odd bumps nor negative values. At higher brightness this problem becomes irrelevant and the agreement between the Héraudeau & Simien (1996) and the uncorrected HST data is good.
The conversion of instrumental magnitude to physical magnitude in the V band is immediate because it corresponds to the Johnson-Morgan photometric system (Holtzman et al. 1995). In the other bands we have to take into account the galaxy colors, presented as the colors of specific stellar populations. To identify the most representative spectral type of stars in the galaxy we compared the B-V and U-B colors of NGC 4414, and , to the colors of the stellar populations given in Table 3-3 of Mihalas & Binney (1981). Around these values, the corrections remain small for stars of spectral types between roughly F2 and M0; it is only for the spectral types O5 and M6 that the corrections can reach 0.1 or 0.2 magnitudes. For G0 and K0 the corrections remain nearly constant and we adopt these values (Table 3).
| True brightness | Biased brightness | Zero point | |
|---|---|---|---|
| Johnson | |||
| B-F439W | |||
| V-F555W | |||
| I-F814W |
2.1.3 Solar luminosity
To determine the solar luminosity in each WFPC2 optical band we integrated a synthetic solar spectrum (Hauschildt et al. 1999) over the bandpass of each HST filter. The results are given in Table 4. We can now express the surface brightness for each band from the flux per unit wavelength or per unit frequency.
| Filter | Pivot | Bandwidth | Solar |
|---|---|---|---|
| Wavelength | Luminosity | ||
| F | () | ||
| 439W | 4311.85 Å | 404.60 Å | 1.97592 |
| 555W | 5442.23 Å | 1044.65 Å | 5.66221 |
| 814W | 8001.59 Å | 1297.07 Å | 4.27211 |
2.2 IRAM Plateau de Bure interferometer CO(1-0) observations
We observed the emission line of the in NGC 4414 using the IRAM Plateau de Bure interferometer between May 1996 and April 1997. The five antennas of the array were equiped with dual-band SIS receivers yielding SSB receiver temperatures around 40 K at the observing frequency. The spectral correlator backend was centered at 114.996 GHz with a total bandwith of 360 MHz. The system temperature varied from about 300K to 400K (Table 5).
| Obs. Date | 1996 May 5 | 1996 Oct. 27 | 1996 Nov. 15 | 1996 Dec. 15 | 1997 Apr. 6 |
|---|---|---|---|---|---|
| Hour Angle | -0.9 to 2.9 | -1.0 to 4.9 | -0.6 to 3.8 | -3.8 to 0.6 | -5.0 to -0.8 |
| Configuration | D | D | C | C | D |
| Calibrator Flux density (Jy) | 3C273, 23.7 | 1156+295, 1.6 | 3C273, 24.4 | 3C273, 22.0 | 3C273, 23.0 |
| Primary Beam | 43.8 ” | ||||
| Restoring Beam | 3.28 ” 3.00 ” | ||||
| Velocity Resolution | 6.5 km s-1 | ||||
| Total Bandwidth | 360 MHz | ||||
| Typical TSYS | 300-400 K | ||||
The phase and amplitude calibrations were done in the antenna based mode using the strong quasars 3C273 and 1156+295 (Table 5). The data were corrected for residual atmospheric phase fluctuations. The flux density of the calibrators was determined from IRAM measurements and used to derive the absolute flux density scale in our map. The accuracy of the flux density scale was around 10%.
A mosaic map was made from our observations of six fields separated by 21′′ and covering the CO-bright disk of the galaxy. The image reconstruction was done using the GILDAS software. Several visibility tables were created each 2.5 MHz wide; the channel separation was thus 6.5 km.s-1. Natural weighting was used with no taper to Fourier transform the visibilities into images.
The six maps were combined to a single dirty mosaic (256 256 pixels with 0.45” sampling), then deconvolved and corrected from primary beam attenuation. The final dirty mosaic was cleaned with the CLARK method and restored with a 3.28” 3.0” gaussian beam (PA = ). To reduce contamination of adjacent fields in the cleaning phase due to border effects, each field was truncated where the primary beam power reaches a level of 10 %.
| Cardinal Position | R.A. Offset | Dec. Offset |
|---|---|---|
| North | -11.8 ” | 25.4 ” |
| North-East | -13.6 ” | 5.0 ” |
| North-West | 5.0 ” | 13.6 ” |
| South-East | -5.0 ” | -13.6 ” |
| South-West | 13.6 ” | -5.0 ” |
| South | 11.8 ” | -25.4 ” |
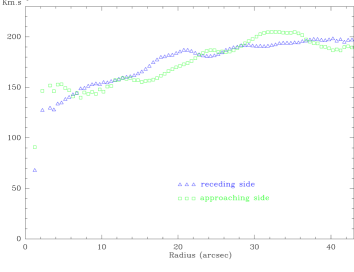
2.2.1 Rotation curve
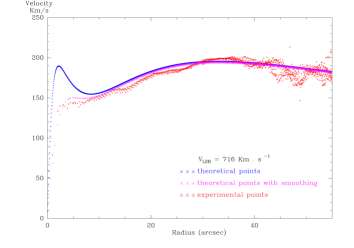
The rotation velocity of the molecular gas was calculated from the first moment of the Plateau de Bure interferometer CO(1–0) data cube (Fig. 2). Rather than using all channels in our calculations of the velocity at each position, a process which brings in noise because the signal is typically only present in a few channels at any given position, we used the fact that the rotation velocities were roughly known in advance.
The circular velocity given by our initial mass model gives us the approximate central velocity at each position and we have integrated the data over a total of 21 channels (136 km s-1) surrounding the model velocity.
| (1) |
The validity of this method was checked by looking at a very large number of spectra ”by hand”. The linewidths are much smaller than 21 channels so we are sure that we have included all possible velocities where emission could be present and thus that our moment calculation is not biased towards the model. In the central regions where the line widths are broad we have integrated over a much larger range.
2.3 The large-scale gaseous component
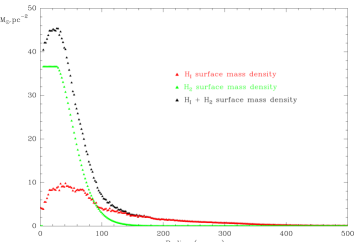
Before comparing the model mass density with the stellar luminosity profiles, we should subtract all of the visible non-stellar mass; namely the gas. In Paper II, we presented CO(1–0) and CO(2–1) observations over almost the entire optical disk of NGC 4414. 13CO observations were also made over a large part of the disk in both lines. Using the CO() line ratio to estimate the gas excitation temperature, we used the Virial theorem to estimate the factor to convert CO intensities into H2 mass densities. As explained in detail in Braine et al. (1997), our estimates were also supported by the 13CO and 1.2mm thermal dust emission maps. We use these results, corrected slightly by the results of our ISO LWS observations (Braine & Hughes 1999), to derive the molecular gas surface density. The total molecular gas mass (including the He in the molecular clouds) is about .
To determine the atomic gas surface density, we have re-reduced the Thornley & Mundy (1997b) HI observations made with the VLA in the C and D configurations. Using uniform weighting the C configuration data were Fourier transformed and cleaned retaining high angular resolution, . The D configuration data were naturally weighted to obtain high surface brightness sensitivity. The C and D configuration data were combined in the image plane in a flux-conserving way to maintain high angular resolution where the signal is strong and retain the sensitivity to low surface brightness features in the outer regions where angular resolution is not as important. A very simple method was used: when the brightness of the low resolution map exceeded a certain value, the output map was a linear combination
| (2) |
for each pixel where below the threshold and where C and D are the C and D array maps and is the HI column density of the pixel in the D configuration map and is a constant chosen such that the C array dominates () in the highest brightness regions. The maximum HI column density in the C array map is cm-2 and the total mass of the atomic gas (HI plus associated He) is . The total neutral gas mass (HI + H2 and associated He) is then , which we have taken to be the total gaseous mass, neglecting the likely insignificant mass of ionized gas.
The HI and H2 column density maps were then used to construct the radial surface density profile shown in Fig 3. With the gaseous surface density known at each radius, we could easily subtract its contribution to the total mass. The high-resolution Plateau de Bure data are not used here because such high angular resolution is not necessary for azimuthally averaged surface densities while it is important not to resolve out flux as is the case for interferometric CO maps of galaxies.
3 Gravitational Potential Model
In this section we describe the axisymmetric part of the gravitational potential of the flocculent galaxy NGC 4414. Axisymmetry is a good approximation given the morphology of NGC 4414. The asymmetries are relatively small, reaching 20% in the K′ band image of Thornley & Mundy (1997a) over only a very small fraction of the disk; this justifies our approach.
To characterize the gravitational potential, we have used the Miyamoto & Nagai (1975) potential which is a particularly flexible and simple analytic potential-density pair. We compared with an exponential disk which allows us to retrieve the rotation curve as well as our model, but not better. However the exponential disk model has two dimensions, whereas our model is in three dimensions and can mimic an exponential disk or more spherical forms.
The Miyamoto-Nagai (hereafter M-N) gravitational potential is:
| (3) |
The M-N potential is free from any singularities and composed of elementary functions. The linearity of Poisson’s equation allows us to sum several components correponding to different regions of the galaxy, such as the nucleus and disk.
| (4) | |||||
and correspond to the spherical Plummer potential and the thin-disk Kuzmin potential cases, respectively. To estimate the mass M and to calculate the density , the Laplace equation has to be solved:
| (5) |
Yielding
| (6) |
The parameters for this kind of model are , and , where is the dimension of the galaxy (or given component of the galaxy), the thickness, and the mass of the galaxy or component described by and . The ratio is a measure of the flatness of the component which becomes a sphere for .
The in-plane circular velocity of a single component is then given by:
| (7) |
or, for several components as in all real cases:
| (8) |
If the disk is now inclined by an angle from the line of sight, we could integrate the volumic density along the line of sight, to obtain the surface density. As the volumic density is proportional to the mass of the component under consideration, the surface density is too.
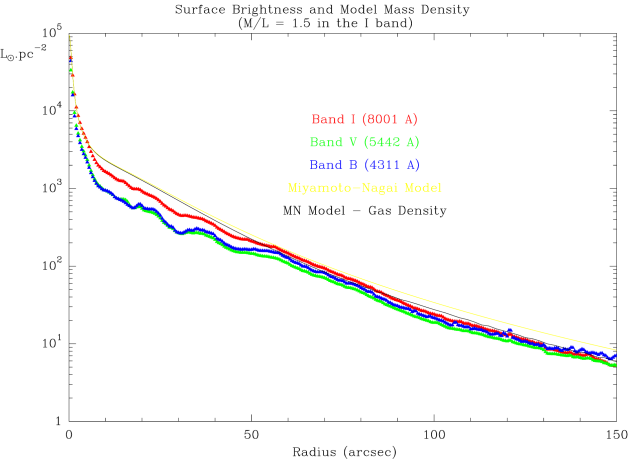
Our choice of components was guided by the CO(1–0) high-resolution rotation curve and by the fact that the mass profile should follow the HST I-band light in the center, which is relatively unobscured by gas and dust. In the outer regions, beyond the interferometer observations, we have been guided by the fact that the lower resolution observations show a much lower amount of gas and dust. We chose the I-band (F814W) surface brightness because: () the light is less biased to the young stellar population, which represents a small fraction of the mass in a spiral galaxy, and () the absorption of light by dust is less than in the B or V-bands (F439W and F555W).
Initially, two components were chosen to represent the dynamics of the galaxy, a small bulge component and a thin disk component for the rest. The very high central peak brightness required us to have two central components in the end, even if we could not constrain this region dynamically because no molecular gas is present in the nucleus. We would like to stress that the decomposition into M-N components provide mainly convenient analytic expressions for the potential and density following the rotation curve and light profiles in the appropriate regions. The components adopted for the “best” model are given in Table 7. The central components occupy the region with little or no gas and dust and follow the stellar brightness. Virtually all of the visible mass is in a single component which represents the disk, essentially stellar but including the gas as well. A ”negative” component with obviously no physical meaning was added in order to make the model fit to the stellar luminosity better in the outer disk; the effect of this component on the velocities within the visible disk is negligible (less than 5%) and is of course included in the calculations.
All of the components are disk-like although the light distribution is slightly “thicker” in the inner few arcseconds. The shape of the smallest component is influenced only by the light because it is so small () that at radii few arcseconds the rotation velocity is affected only by its mass and not shape. The two inner components ( and ) enable us to fit the steep rise of the rotation curve. Two M-N components are used to model the stellar + gaseous disk but this should really be viewed as a single structure of mass whose mass density drops off more quickly with radius than a single M-N component (pc). This disk simultaneously reproduces the inner rotation curve and the luminosity profile at larger radii, where the dust obscuration is known to be lower. It also reproduces the observed disk thickness and inclination. While other, probably more complicated, mathematical formulations could certainly be used, they would have to yield the same result.
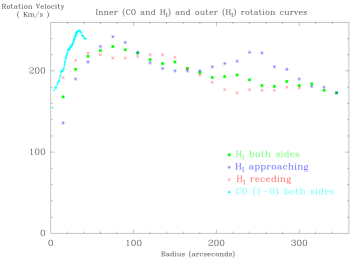
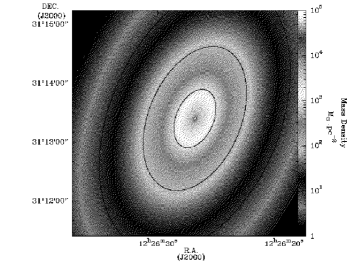
To better compare our model to the CO data, we smoothed the model rotation curve using the CO synthesized beam parameters, a gaussian beam with a position angle of . The observed and model rotation curves are shown in Fig. 5. An image of the projected surface density of the mass model we have adopted is shown in Fig. 6. Comparison with the observed HST light profiles is shown in Fig. 7.
| Component | a (pc) | b (pc) | M () |
|---|---|---|---|
| Nucleus | 70 | 20 | 2.5 |
| Nucleus | 380 | 30 | 4.0 |
| Stellar+Gaseous Disk | 2500 | 150 | 86 |
| Negative component | 11000 | 500 | 16 |
At this stage, our model only contains visible mass components and these are shown to dominate at radii less than about 10 kpc (). This enables us to determine the mass-to-light ratio within the optical disk (next section).
4 The M/L ratio
The mass in the central regions of a spiral galaxy is completely dominated by the stellar mass. For NGC 4414 this can be readily seen by taking the dark mass necessary to fit the outer point in the HI rotation curve – roughly within the last radius and for a spherical distribution – and assuming a shape for the halo. For a rather concentrated “CDM” halo (Navarro et al. 1996), pc-3 where is the outer radius of the rotation curve (Fig. 4). At a radius of 10pc, the density is then about 2M⊙pc-3 and the mass at pc is about M⊙. The stellar luminosity is about L⊙pc-2, yielding a luminosity in the same region of L⊙. Even for an M/L of unity, the dark matter provides less than 0.1% of the mass in the nucleus. For in the halo (Moore et al. 1998, 1999), the dark mass is still only a few percent of the luminous mass. Clearly, with less centrally concentrated haloes, as is typically suggested by observations (Côté et al. 2000; Salucci 2001; de Blok et al. 2001), the central contribution of the dark matter will be even less.
All the conditions are therefore met to derive the stellar M/L ratio in NGC 4414: the distance is known to within %; the central stellar luminosity is well known and not greatly obscured (we know this from the CO, HI, and SCUBA observations); all of the other mass components – dark matter, neutral gas, ionized gas, have been shown to be negligible compared to the stellar mass. For all halo profiles yielding the observed outer rotation curve, the luminous mass dominates out to beyond 10 kpc (about ), enabling the stellar M/L ratio to be determined as for the center, the gaseous component being sufficiently well quantified. Following the same calculation as in the previous paragraph, and dark matter profiles yield dark masses of and within radii of 5 and 7 kpc respectively. This is much less than the stellar mass and thus can not significantly affect our estimates of M/L.
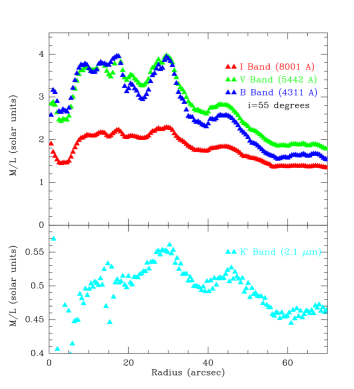
The stellar M/L ratio is then the mass model (after subtraction of the small gaseous component – Sect. 2.3), which is dominated by a single component of scale length 2.5 kpc, divided by the stellar luminosity and is shown in Fig. 9. In the B and V bands the M/L ratio is between 1.5 and 2 except for radii where it reaches about 4 in solar units. The same structure is seen in the I band but with lower amplitudes – M/L is about 1.5 reaching slightly over 2. It is immediately apparent that the high M/L ratios in the and bands at radii are due to extinction by the very abundant dust (Papers I,II,III and Braine et al. in prep.). The intrinsic M/L ratio is about or over unity in each of these bands. The gas mass has been subtracted from the mass model before calculating the M/L. This has no effect in the central regions but becomes important at larger radii (compare gas-subtracted and total mass model curves in Fig. 7 for M/L=1.5 in the I band).
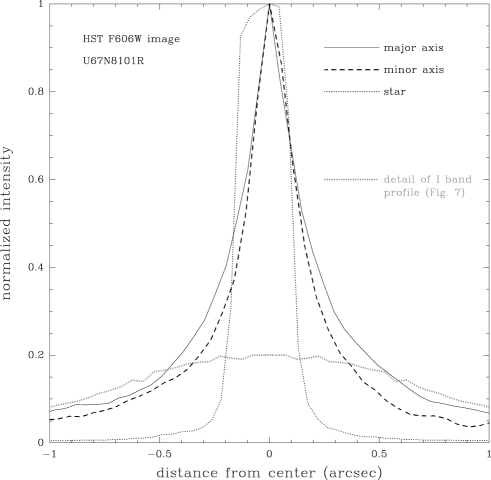
The increase in M/L at very small radii is not significant. The HST images of the nucleus of NGC 4414 are all, or nearly all, saturated. When combined and reduced to a common pixel size, the central flux is underestimated. To illustrate this, we compare the central portion of the -band profile shown in Fig. 7 with a cut across the nucleus in a single relatively short F606W filter image where the nucleus falls in the PC portion (Fig. 8). For similar fluxes at from the center, the short exposure has 5 times the central flux. Even in this 160 second image, the two central pixels are identical and only 8% below the saturated flux of the star about away so this image may be slightly saturated as well.
The fact that we see the nucleus of NGC 4414 is an important aid because one is then not tempted to invoke an unknown bulge component which, although only a small contributor over the whole disk could well change the shape of the rotation curve in the inner few kpc. The inner region is crucial because it is where we are sure that the stellar mass dominates the dark mass and where our new high-resolution data provide the necessary information. If the center were covered by dust, it would be very difficult to estimate the bulge component because beyond the central region the bulge light would have to be separated from disk light, introducing serious uncertainties. Seeing the rapid decline in the central luminosity allows us to determine the central light profile.
4.1 Comparison with other estimates of M/L
Few reliable M/L values are available. Pryor & Meylan (1993) studied the mass-to-light ratios for 56 Galactic globular clusters using King-Michie dynamical models. They found a median value of the ratio of 2.3. Dubath & Grillmair (1997) derived a similar medium value for 9 globular clusters in M31. This value is slightly higher than ours () in the region where dust is less obstructing, and clearly consistent with ours because the stellar population of globular clusters is older than that of the galactic disk.
In Figure 9 we show K’ band mass to light ratio variations in the galactic disk. The value is nearly constant, , and close to the near infrared mass to light ratio given by Olling & Merrifield (2001) for the Milky Way disk, in solar units, and well within the range found by Bell & de Jong (2001) through population syntheses. The K’ band M/L ratio is low because of the contribution of giants which have a particularly strong effect due to intrinsically low M/L and their very red colors. The K’ band variations are the same as in the optical bands, but with weaker amplitudes, about 10 % in the K’ band, 40 % in the I band and reaching factors of 2 - 2.5 in the V and B bands. These variations result from absorption of the starlight by dust so fluctuations appear in the same regions of the galaxy for each band. The longer wavelength emission suffers less from the extinction so the variations decrease with wavelength.
The mass to light ratio we show in Fig 9 can be compared with estimates for other spiral disks, typically obtained through mass modeling with a constant M/L (usually B band) and yielding results equivalent to maximum disk (next subsection). Hoekstra et al. (2001) find B band M/L ratios from 1.2 to 5.8, with an average of 3.5 for full-sized spirals. The extreme values are not outliers but the whole range is covered, which intrinsically would not be expected for spiral disks. We suspect that the large range mostly reflects the different coverage by dust.
4.2 Comparison with maximum-disk model
In a maximum disk model (van Albada & Sancisi 1986; Palunas & Williams 2000) the mass distribution follows the light distribution, the M/L ratio being constant along the luminous disk. The disks are called maximum because as much mass as possible is attributed to the stellar disk without generating circular velocities greater than observed. Typically, the band used is either B or V. To compare with our gravitational model we made a maximum disk model by fitting the HST V-band luminosity curve. We used four Miyamoto-Nagai components to fit the V-band luminosity curve. A very similar fit is obtained in B band. We tested two different values of . fits the inner part of the rotation curve at about 5′′ (a true maximum disk model) and fits the peak of the rotation curve at about 35′′. To correctly compare model and observations, we smoothed the velocity field with the same parameters as described in Section 3, i.e. a gaussian beam with a position angle of . To complete this study of the maximum disk we included a spherical halo of Dark Matter. The mass of the halo was calculated from the Hi data taking a (M/L = 1.7) or (M/L = 3.5) sphere with an outer radius of 33.5 Kpc (i.e. 360 ”). A provides a worse fit but the results in this section are quite independant of the dark matter halo.
It appears clearly that the velocities generated by a maximum disk (M/L = 3.5) are too high from about 5” to 15” (500 to 1500 pc) and that the dark matter halo provides no solution to the problem. The difference is much greater than the observational uncertainties. Lowering the M/L ratio to fit the velocities at small radii (M/L = 1.7), say 500 pc, requires a very unphysical dark halo shape.
This shows that a constant M/L ratio, particularly in a short wavelength band such as B or V, is inappropriate. Were the nucleus covered or partially covered by dust, and thus less luminous, we might not have been able to show that M/L cannot be constant.

4.3 The intrinsic M/L ratio
The near constancy of M/L at 2.1 m suggests that the underlying M/L ratio is single-valued over the disk. This is supported by the fact that the increases in K’ band M/L occur at the same positions as in the B and V bands, with a much lower amplitude as expected for extinction, so the overall K’ band M/L is very close to its value where less extinction is present, about [M/L]. Below we attempt to estimate the intrinsic M/L ratio of the stellar population of the disk of NGC 4414.
The M/L ratios in all bands reach roughly constant levels at radii , outside of the star-forming molecular ring. Without prior knowledge of the intrinsic (unreddened) colors, the best way to estimate the extinction is through the atomic gas column density. The HI column density at these radii is about cm-2 (Thornley & Mundy 1997b), such that on average the stellar light will be extincted by about cm-2. From Fig. 8 of Draine & Lee (1984), we estimate at the wavelength of the F814 filter and with expressed in cm, in cm-2. This leads to an I band (F814) extinction of about 0.3 in the regions where the I band M/L reaches a plateau at 1.4.
From Draine & Lee (1984) we estimate the extinction ratio between the HST I and V bands to be about 0.56, between the values given by Rieke & Lebofsky (1985) and Cohen et al. (1981). Similarly, the HST B to V band extinction ratio should be about 1.3, again between the values given by Rieke & Lebofsky (1985) and Cohen et al. (1981). We estimate the ratio between K’ and V band extinctions to be about 0.09, slightly lower than in Rieke & Lebofsky (1985) and in agreement with Cohen et al. (1981). Using these extinctions to correct the observed mass to light ratios leads to M/L ratios of roughly unity in the B,V, and I bands. The results are summarized in Table 8.
| Band | Observed M/L | corrected M/L | ||
|---|---|---|---|---|
| B | 1.7 | 0.7 | 0.76 | 0.85 |
| V | 1.9 | 0.54 | 0.58 | 1.1 |
| I | 1.4 | 0.3 | 0.33 | 1.0 |
| 0.46 | 0.05 | 0.05 | 0.42 |
These values should be viewed as upper limits, although they are likely quite close to the reality, because extinction due to molecular gas has not been included. Molecular clouds are smaller denser objects that HI clouds and are closer to the galactic plane. Thus, they may very strongly obscure a small fraction of the starlight, causing a minor overestimate of the mass to light ratio. At smaller radii the covering fraction of the clouds is certainly significantly higher.
In the molecular ring, the extinction is roughly 1.6 mag in B, 1.3 in V, 0.9 in I, and 0.2 in , assuming that the corrected M/L ratios given above are accurate. In upcoming papers we plan to determine the extinction more accurately by avoiding the azimuthal symmetry hypothesis and studying the whole galaxy point by point. Population syntheses may also help to constrain the intrinsic colors and M/L ratios, using the values here as a starting point. These issues are beyond the scope of this paper.
5 Conclusion
This work leads to the following conclusions:
- The mass model is constrained by the light distribution in the central few hundred parsecs (r 4”) and at large radii (r 50”) and by the high-resolution rotation curve at intermediate radii. A single component dominates the mass over the whole disk so the agreement between the outer light distribution and rotation curve at smaller radii is natural.
- Because the central few hundred parsecs are not covered by dust, we are able to unambiguously show that a constant M/L ratio in the B or V bands is highly incorrect due to extinction at radii of 5” r 50”. A low M/L (1 or 2) requires an enormous, unphysical, DM contribution at radii greater than 15” (1.5 kpc). A higher M/L (e.g. 3) gives far too much mass to the bright central region such that the calculated rotation velocities are far greater than observed at 5” r 20”.
- The M/L ratio, shown in Fig. 9, reaches about 4 in the highly obscured radii 5” r 50” in the B and V bands but is below 2 in the center and the less obscured outer regions. The I band M/L ratio shows the same structure as in B and V but only varies between 1.4 and 2. At the longer K’ (2.1 m) wavelength, the M/L ratio is almost constant at about 0.5 M⊙/L but again shows the same absorption regions as in B,V and I.
- The intrinsic stellar M/L ratio, corrected for extinction, is close to unity in the B, V, and I bands, and only 0.4 or so in band (Table 8). If the recent Freedman et al. (2001) distance is correct, then the M/L given here should be raised by 8.5%, well within the uncertainty of this work.
All of our conclusions deal with the optical disk of NGC 4414 where the visible matter dominates the rotation velocities, such that the uncertainties linked to the DM distribution have no effect on these conclusions. In a companion paper we use our knowledge of the visible mass distribution to constrain the shape of the dark matter envelope.
Acknowledgements.
We would like to thank Michele Thornley for providing us with her K’ band image. We would also like to thank the referee, G.D. Bothun, for his helpful remarks.References
- Alcock et al. (1998) Alcock, C., Allsman, R. A., Alves, D., Ansari, R., Aubourg, E., Axelrod, T. S., Bareyre, P., Beaulieu, J.-P., Becker, A. C., Bennett, D. P., Brehin, S., Cavalier, F., Char, S., Cook, K. H., Ferlet, R., Fernandez, J., Freeman, K. C., Griest, K., Grison, P., Gros, M., Gry, C., Guibert, J., Lachieze-Rey, M., Laurent, B., Lehner, M. J., Lesquoy, E., Magneville, C., Marshall, S. L., Maurice, E., Milsztajn, A., Minniti, D., Moniez, M., Moreau, O., Moscoso, L., Palanque-Delabrouille, N., Peterson, B. A., Pratt, M. R., Prevot, L., Queinnec, F., Quinn, P. J., Renault, C., Rich, J., Spiro, M., Stubbs, C. W., Sutherland, W., Tomaney, A., Vandehei, T., Vidal-Madjar, A., Vigroux, L., & Zylberajch, S. 1998, ApJ, 499, L9
- Ashman (1992) Ashman, K. M. 1992, PASP, 104, 1109
- Bell & de Jong (2001) Bell, E. F. & de Jong, R. S. 2001, ApJ, 550, 212
- Braine et al. (1997) Braine, J., Brouillet, N., & Baudry, A. 1997, A&A, 318, 19
- Braine et al. (1993) Braine, J., Combes, F., & van Driel, W. 1993, A&A, 280, 451
- Braine & Hughes (1999) Braine, J. & Hughes, D. H. 1999, A&A, 344, 779
- Cohen et al. (1981) Cohen, J. G., Persson, S. E., Elias, J. H., & Frogel, J. A. 1981, ApJ, 249, 481
- Côté et al. (2000) Côté, S., Carignan, C., & Freeman, K. C. 2000, AJ, 120, 3027
- de Blok et al. (2001) de Blok, W. J. G., McGaugh, S. S., Bosma, A., & Rubin, V. C. 2001, ApJL, 552, L23
- de Vaucouleurs et al. (1991) de Vaucouleurs, G., de Vaucouleurs, A., Corwin, J. R., Buta, R. J., Paturel, G., & Fouque, P. 1991, in Third reference catalogue of bright galaxies (1991)
- Draine & Lee (1984) Draine, B. T. & Lee, H. M. 1984, ApJ, 285, 89
- Dubath & Grillmair (1997) Dubath, P. & Grillmair, C. J. 1997, A&A, 321, 379
- Freedman et al. (2001) Freedman, W. L., Madore, B. F., Gibson, B. K., Ferrarese, L., Kelson, D. D., Sakai, S., Mould, J. R., Kennicutt, R. C., Ford, H. C., Graham, J. A., Huchra, J. P., Hughes, S. M. G., Illingworth, G. D., Macri, L. M., & Stetson, P. B. 2001, ApJ, 553, 47
- Hauschildt et al. (1999) Hauschildt, P. H., Allard, F., & Baron, E. 1999, ApJ, 512, 377
- Héraudeau & Simien (1996) Héraudeau, P. & Simien, F. 1996, A&AS, 118, 111
- Hoekstra et al. (2001) Hoekstra, H., van Albada, T. S., & Sancisi, R. 2001, MNRAS, 323, 453
- Holtzman et al. (1995) Holtzman, J. A., Hester, J. J., Casertano, S., Trauger, J. T., Watson, A. M., Ballester, G. E., Burrows, C. J., Clarke, J. T., Crisp, D., Evans, R. W., Gallagher, J. S., Griffiths, R. E., Hoessel, J. G., Matthews, L. D., Mould, J. R., Scowen, P. A., Stapelfeldt, K. R., & Westphal, J. A. 1995, PASP, 107, 156
- Mihalas & Binney (1981) Mihalas, D. & Binney, J. 1981, Galactic astronomy: Structure and kinematics /2nd edition/ (San Francisco, CA, W. H. Freeman and Co., 1981. 608 p.)
- Milgrom (1983) Milgrom, M. 1983, ApJ, 270, 365
- Miyamoto & Nagai (1975) Miyamoto, M. & Nagai, R. 1975, PASJ, 27, 533
- Moore et al. (1998) Moore, B., Governato, F., Quinn, T., Stadel, J., & Lake, G. 1998, ApJL, 499, L5
- Moore et al. (1999) Moore, B., Quinn, T., Governato, F., Stadel, J., & Lake, G. 1999, MNRAS, 310, 1147
- Navarro et al. (1996) Navarro, J. F., Frenk, C. S., & White, S. D. M. 1996, ApJ, 462, 563
- Olling & Merrifield (2001) Olling, R. P. & Merrifield, M. R. 2001, MNRAS, 326, 164
- Palunas & Williams (2000) Palunas, P. & Williams, T. B. 2000, AJ, 120, 2884
- Pogge (1989) Pogge, R. W. 1989, ApJS, 71, 433
- Pryor & Meylan (1993) Pryor, C. & Meylan, G. 1993, in ASP Conf. Ser. 50: Structure and Dynamics of Globular Clusters, 357+
- Renault et al. (1998) Renault, C., Aubourg, E., Bareyre, P., Brehin, S., Gros, M., Lachieze-Rey, M., Laurent, B., Lesquoy, E., Magneville, C., Milsztajn, A., Moscoso, L., Palanque-Delabrouille, N., Queinnec, F., Rich, J., Spiro, M., Vigroux, L., Zylberajch, S., Ansari, R., Cavalier, F., Moniez, M., Beaulieu, J.-P., Ferlet, R., Grison, P., Vidal-Madjar, A., Guibert, J., Moreau, O., Maurice, E., Prevot, L., Gry, C., Char, S., Fernandez, J., & The EROS Collaboration. 1998, A&A, 329, 522
- Rieke & Lebofsky (1985) Rieke, G. H. & Lebofsky, M. J. 1985, ApJ, 288, 618
- Sakamoto (1996) Sakamoto, K. 1996, ApJ, 471, 173+
- Salucci (2001) Salucci, P. 2001, MNRAS, 320, L1
- Sofue & Rubin (2001) Sofue, Y. & Rubin, V. 2001, ARA&A, 37, 137
- Thim (2000) Thim, F. 2000, in ASP Conf. Ser. 203: IAU Colloq. 176: The Impact of Large-Scale Surveys on Pulsating Star Research, 231–232
- Thornley & Mundy (1997a) Thornley, M. D. & Mundy, L. G. 1997a, ApJ, 484, 202
- Thornley & Mundy (1997b) —. 1997b, ApJ, 490, 682
- Turner et al. (1998) Turner, A., Ferrarese, L., Saha, A., Bresolin, F., Kennicutt, R. C., Stetson, P. B., Mould, J. R., Freedman, W. L., Gibson, B. K., Graham, J. A., Ford, H., Han, M., Harding, P., Hoessel, J. G., Huchra, J. P., Hughes, S. M. G., Illingworth, G. D., Kelson, D. D., Macri, L., Madore, B. F., Phelps, R., Rawson, D., Sakai, S., & Silbermann, N. A. 1998, ApJ, 505, 207
- van Albada & Sancisi (1986) van Albada, T. S. & Sancisi, R. 1986, Royal Society of London Philosophical Transactions Series, 320, 447