1RXS J232953.9+062814: A Dwarf Nova with a 64-minute Orbital Period and a Conspicuous Secondary Star 111Based in part on observations obtained at the MDM Observatory, operated by Dartmouth College, Columbia University, Ohio State University, and the University of Michigan.
Abstract
We present spectroscopy and time-series photometry of the newly discovered dwarf nova 1RXS J232953.9+062814. Photometry in superoutburst reveals a superhump with a period of 66.06(6) minutes. The low state spectrum shows Balmer and HeI emission on a blue continuum, and in addition shows a rich absorption spectrum of type K4 2. The absorption velocity is modulated sinusoidally at min, with semi-amplitude km s-1. The low-state light curve is double-humped at this period, and phased as expected for ellipsoidal variations. The absorption strength does not vary appreciably around the orbit. The orbital period is shorter than any other cataclysmic variable save for a handful of helium-star systems and V485 Centauri (59 minutes). The secondary is much hotter than main sequence stars of similar mass, but is well-matched by helium-enriched models, indicating that the secondary evolved from a more massive progenitor. A preliminary calculation in which a 1.2 M⊙ star begins mass transfer near the end of H burning matches this system’s characteristics remarkably well.
1 Introduction
Cataclysmic variable stars (CVs) are close binary systems in which a low-mass secondary transfers mass onto a white dwarf; Warner (1995) wrote an excellent monograph on CVs. Orbital angular momentum losses evidently drive CV evolution. As the orbit shrinks, the secondary star’s Roche critical lobe contracts, causing mass transfer. The Roche geometry tightly constrains the secondary star’s mass at a given orbital period . Short-period systems have low-mass secondaries, so if the chemical composition is normal (), the secondary is faint and contributes negligibly to the visible-light spectrum (Fig. 4 of Patterson 2001). For normal compositions the radius is expected to reach a minimum around 0.05 , leading to a predicted period minimum around 70 – 75 minutes (the exact value being dependent on ), with subsequent evolution driving the system to greater separations (Kolb & Baraffe, 1999; Patterson, 1998; Pacynszki & Sienkiewicz, 1981).
During outburst, short-period dwarf nova systems often show photometric oscillations (superhumps) at periods a few percent longer than . The superhump frequency is thought to be the beat between and a tidally driven precession of an eccentric disk. The fractional period excess of the superhump appears to be a measure of the mass ratio (Patterson, 2001).
We recently observed 1RXS J232953.9+062814 (hereafter RX2329+06), a newly-recognized dwarf nova system with below the canonical minimum period for hydrogen-rich secondary stars. Our observations reveal an unexpectedly hot secondary star. We suggest that the secondary has undergone substantial nuclear evolution leading to an enhanced helium abundance.
2 Observations and Analysis
Our optical photometry is from differential CCD measurements, mostly from the Center for Backyard Astrophysics (CBA) worldwide network of small telescopes (Skillman & Patterson, 1993). Our spectroscopy is from the 2.4 m Hiltner telescope at MDM Observatory on Kitt Peak. Details of the instrumental setup and reduction were as described in Thorstensen et al. (1998). We obtained a total of 77 exposures of 360 s each, on 2001 Nov 20 - 22 and 24 UT, spanning 6.0 h of hour angle.
We defer detailed discussion of the outburst photometry for a longer paper. Briefly, the superhump period during outburst was 0.04637(4) d, decreasing gradually over the next 10 days to around 0.0458 d.
For astrometry, we obtained several -band images with the 1.3m McGraw-Hill telescope at MDM. We compared these with archival sky-survey data from the USNO Flagstaff Station Image and Catalogue Archive, and found mas yr-1 in P.A. degrees. The ICRS position at J2000, referred to USNO A2.0 (Monet et al., 1996) and five Tycho-2 stars (Høg et al., 2000), was , ,
Fig. 1 shows the mean low-state spectrum. Broad Balmer emission is prominent, along with weaker emission from He I (Table 1). The Balmer lines show double peaks most of the time, separated by km s-1 when the peaks are most distinct. The continuum has , and the flux level indicates (estimated uncertainty). The spectrum also shows conspicuous absorption features which appear consistent with a late-type star.
We measured absorption velocities by cross-correlating our spectra against a rest-frame sum of several IAU velocity standards, using xcsao (Kurtz & Mink, 1998). Although the absorption was nearly invisible in the individual spectra, the cross-correlation technique succeeded in all cases, giving typical formal errors km s-1. A least-squares period search of the absorption velocities (Thorstensen et al., 1996) showed a strong, unambiguous period near 64 minutes, and a sine fit (Fig. 2) gave the parameters in Table 2. H emission-line velocities measured using a convolution method sensitive to the line wings (Schneider & Young, 1980) gave noisier velocities (also in Fig. 2), but yielded the same period. Fig. 3 shows a greyscale representation of the spectra with phase (Taylor & Thorstensen, 1998). The absorption spectrum and its modulation are obvious, and the H emission line also shows an apparent -wave.
Using library spectra from Pickles (1998), we estimate the secondary’s spectral type to be K4 subclasses. Earlier spectral types do not show CaI 6162 as strongly as RX2329+06, and later types begin to show molecular features which are not present here. Assuming the secondary’s absorption line strengths are similar to the library spectra, we estimate that the secondary contributes per cent of the light near 5500 Å.
The bottom panel of Fig. 2 shows phase-averaged white-light differential photometry from the CBA network. The double-peaked modulation is consistent with ellipsoidal variations, which are not unexpected since the secondary contributes so strongly to the total light.
3 Inferences
Distance. The secondary spectrum and period constrain the distance. From Roche lobe arguments we infer R⊙ (see below), where the uncertainty is conservative since scales as . K-star surface brightnesses inferred from Table 3 of Beuermann et al. (1999) then imply that the secondary has . Our data give for the secondary alone, where the uncertainty includes the flux calibration and the secondary’s relative contribution. The distance is then 210 (+110, ) pc. At the nominal distance the transverse velocity is 61 km s-1. The quiescent disk at 210 pc has , rising to in outburst, which agrees well with the - relation of Warner (1987).
Masses. There are no eclipses, so the inclination is uncertain. The secondary’s velocity amplitude gives a mass function of 0.194(6) M⊙. This may be distorted by illumination effects, but we see no evidence of variation of the line features around the spectrum. The secondary is presumably at least M⊙, which implies a white dwarf mass M⊙, not a particularly stringent constraint. In principle, the ellipsoidal variations could constrain , but this is sensitive to the assumed limb-darkening parameters (Bochkarev et al., 1979) and to the fractional contribution from the secondary. We tried measuring the emission lines with a range of convolution parameters (Shafter, 1983), but found a consistent 0.05-cycle phase offset between the emission velocities and the expected phase of the white dwarf motion, so we do not use the emission lines to estimate the mass ratio.
The mass ratio can be estimated from the superhump period excess , using the - relationship calibrated by Patterson (2001). At maximum light, , implying , or M⊙ for a broadly typical M⊙. The Roche constraint implies at this period (Beuermann et al., 1998); combining this with yields . The illustrative system with M⊙ would reproduce the observed mass function at degrees.
4 Discussion
It is surprising to find such a hot secondary at this short period, where the secondary mass must be M⊙. No calculation beginning with a solar-abundance secondary has produced periods this short (Kolb & Baraffe, 1999), and hydrogen-rich stars of this small a mass would be much cooler than observed.
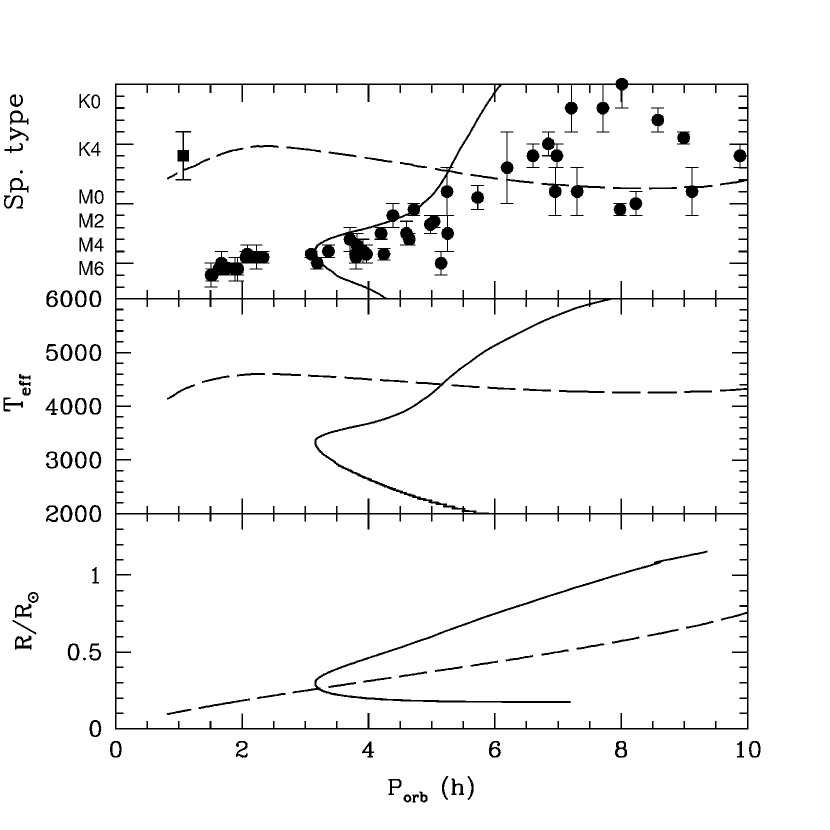
We suggest that the secondary is substantially enriched in helium, as a result of nuclear evolution prior to mass transfer. As shown by Baraffe & Kolb (2000), secondary donors which have evolved off the Zero Age Main Sequence (ZAMS) at the onset of mass transfer can explain a substantial fraction of the observed CVs with late spectral types and h. Test calculations with constant mass transfer rates show that significantly evolved donors (e.g. with mass transfer starting near the end of central H burning) can be much hotter at a given h than ZAMS donors. This is illustrated in Fig. 4, which displays sequences with initial donor mass = 1.2 and starting mass transfer on the ZAMS (solid line) or near the end of H burning (dashed line). As already noted by Baraffe & Kolb (2000), such extreme sequences never become fully convective, because of the lower central H abundance, and may continue to transfer mass in the 2-3 h period gap. If they sequences do so, they can reach very low orbital periods with unusually high .
For the test case shown in Fig. 4, the evolved sequence (dashed line) reaches = 64 min with a mass 0.11 and a radius 0.13 , in close agreement with the estimates in §3. We derive a spectral type K5, based on the empirical SpT - relation of Beuermann et al (1998), again matching observation. We stress that our spectral type estimate is to be treated with caution, since the surface chemical composition is expected to be non-standard, with a mass fraction of H 30-40%. Because CNO-processed material should be visible on the surface, the model has C significantly depleted and N enriched by a factor 5, whereas O is hardly affected.
We stress that this evolutionary sequence is preliminary, but it provides a surprisingly good match to the observed properties of RX2329.
The emission line fluxes (Table 1) suggest that helium is enhanced. The ratio of H to HeI is about 3.6. We measured the H/6678 ratio in archival spectra of SU UMa stars (Thorstensen et al., 1996; Thorstensen & Taylor, 1997; Thorstensen, 1997) and found typical values of 8, with none below 6. This could be an excitation effect, but even high-excitation novalikes such as V603 Aql (Patterson et al., 1997) have larger ratios. The 59-minute binary V485 Cen also appears to have an unusually low H/6678 in the spectrum published by Augusteijn et al. (1996), but absorption features are not evident there. As noted earlier, the relative CNO abundances should be affected, but we cannot comment on this since CNO elements lack strong lines at this .
In sum, RX2329 is a CV in which the secondary evidently has undergone significant nuclear burning and then had much of its mass stripped away, since at its present mass, its nuclear evolution timescale greatly exceeds the Hubble time. If the white dwarf mass is similar to most CVs ( M⊙), much of the mass lost by the secondary appears to have been lost from the system. Evidently the system formed with a secondary considerably more massive than the white dwarf. In principle this leads to mass transfer on a thermal timescale, until becomes small enough for the system to reappear as a standard CV (see Baraffe & Kolb 2000 for a discussion).
Acknowledgments. We gratefully acknowledge funding by the NSF (AST 9987334), and we thank the MDM staff for their excellent support. Special thanks go to the CBA observers who contributed to the photometry, including Dave Skillman, Arto Oksanen, Ed Beshore, and Tonny Vanmunster; a fuller report on their work will be forthcoming. We made use of the USNOFS Image and Catalogue Archive operated by the United States Naval Observatory, Flagstaff Station (http://www.nofs.navy.mil/data/fchpix/).
Note added 2002 January 29: We obtained seven more spectra with the 2.4m on 2002 Jan. 21 UT. Combining absorption velocities from these with the 2001 November data yields a refined = 0.0445671(2) d.
References
- Augusteijn et al. (1996) Augusteijn, T., van der Hooft, F., de Jong, J.A., and van Paradijs, J. 1996, A&A, 311, 889.
- Baraffe & Kolb (2000) Baraffe, I., & Kolb., U. 2000, MNRAS, 318, 354
- Beuermann et al. (1998) Beuermann, K., Baraffe, I., Kolb, U., & Weichhold, M. 1998, A&A, 339, 518
- Beuermann et al. (1999) Beuermann, K., Baraffe, I., & Hauschildt, P. 1999, A&A, 348, 524
- Bochkarev et al. (1979) Bochkarev, N. G., Karitskaya, E. A., & Shakura, N. I. 1979, Sov. Astron., 23, 8
- Høg et al. (2000) Høg, E., Fabricius, C., Makarov, V. V., Urban, S., Corbin, T., Wycoff, G., Bastian, U., Schwekendiek, P., & Wicenec, A., 2000, A&A, 355, L57
- Kolb & Baraffe (1999) Kolb, U., & Baraffe, I. 1999, MNRAS, 309, 1034
- Kurtz & Mink (1998) Kurtz, M.J., Mink, D.J., 1998, PASP 110, 934
- Monet et al. (1996) Monet, D. et al. 1996, USNO-A2.0, (U. S. Naval Observatory, Washington, DC)
- Pacynszki & Sienkiewicz (1981) Paczynski, B., and Sienkiewicz, R. 1981, ApJ, 248, L27
- Patterson et al. (1997) Patterson, J., Kemp, J., Saad, J., Skillman, D. R., Harvey, D., Fried, R., Thorstensen, J. R., & Ashley, R. 1997, PASP, 109, 468
- Patterson (1998) Patterson, J. 1998, PASP, 110, 1132
- Patterson (2001) Patterson, J. 2001, PASP, 113, 736
- Pickles (1998) Pickles, A. J., 1998, PASP, 110, 863
- Schneider & Young (1980) Schneider, D. and Young, P. 1980, ApJ, 238, 946
- Shafter (1983) Shafter, A. W. 1983, ApJ, 267, 222
- Skillman & Patterson (1993) Skillman, D. R., & Patterson, J. 1993, ApJ, 417, 298
- Taylor & Thorstensen (1998) Taylor, C. J., and Thorstensen, J. R. 1998, PASP, 111, 184
- Thorstensen (1997) Thorstensen, J. R., 1997, PASP, 109, 1241
- Thorstensen et al. (1996) Thorstensen, J. R., Patterson, J., Shambrook, A., and Thomas, G. 1996, PASP 108, 73
- Thorstensen & Taylor (1997) Thorstensen, J. R., & Taylor, C. J., 1997, PASP, 109, 1359
- Thorstensen et al. (1998) Thorstensen, J. R., Taylor, C. J., & Kemp, J. 1998, PASP, 110, 1405
- Warner (1987) Warner, B. 1987, MNRAS, 227, 23
- Warner (1995) Warner, B. 1995, Cataclysmic Variables (Cambridge University Press)
| Feature | E.W.aaEmission equivalent widths are counted as positive. | FluxbbAbsolute line fluxes are uncertain by a factor of about 2, but relative fluxes of strong lines are estimated accurate to per cent. | FWHM ccFrom Gaussian fits. |
|---|---|---|---|
| (Å) | (10-15 erg cm-2 s1) | (Å) | |
| H | 12 | 30 | 32 |
| HeI4471 | 4: | 9: | 24: |
| HeII4686 | 3: | 5: | 25: |
| H | 18 | 29 | 32 |
| H | 25 | 26 | 41 |
| HeI 6678 | 7 | 7 | 49 |
| HeI 7067 | 7 | 6 | 54 |
| Data set | aaBlue-to-red crossing, HJD . | ||||
|---|---|---|---|---|---|
| (d) | (km s-1) | (km s-1) | (km s-1) | ||
| Absorption | 2234.79927(8) | 0.044566(3) | 348(4) | 4(3) | 15 |
| H emission | 2234.8239(9) | 0.04458(4) | 73(9) | 38 |