Automating the Synthetic Field Method:
Application to Sextans A
Abstract
We have automated the “Synthetic Field Method” developed by Gonzalez et al. (1998) and used it to measure the opacity of the ISM in the Local Group dwarf galaxy Sextans A by using the changes in counts of background galaxies seen through the foreground system. The Sextans A results are consistent with the observational relation found by Cuillandre et al. (2001) between dust opacity and HI column density in the outer parts of M31.
Space Telescope Science Institute, 3700 San Martin Drive, Baltimore, MD 21218, USA
Kapteyn Institute, Landleven 12, 9747 AD Groningen, the Netherlands
1. Introduction
To observe the opacity and distribution of dust independent of theoretical models for the light or dust distribution, the dust needs to be backlighted by a more distant source. The group led by Keel and White used an occulted galaxy for this purpose and their studies (Domingue et al. (1999, 2000), Keel et al. (2001) and White et al. (1992, 2000)) showed insight into the fine structure of the dust in a few galaxies.
Gonzalez et al. (1998) developed a method to use the distribution of field galaxies which they called the “Synthetic Field Method” (SFM); it is not restricted to the case of nearby galaxy pairs and it can supply values for the dust opacities of galaxies in the disks of spirals and irregulars in general.
2. The Synthetic Field Method
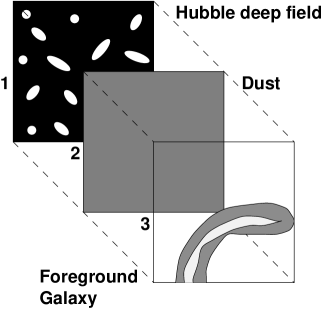
The method consists of comparing the numbers of the background galaxies found in Wide Field Camera images of nearby spiral and irregular galaxies with those of simulations. These simulations are a Hubble Deep Field image, extincted by a certain opacity added to the original data. (see figure 1.) By adding the extincted HDF frame to the original data, all the effects of clustering and confusion by the foreground galaxy are calibrated. All the three HDF frames are used in seperate simulations to account as much as possible for clustering biases; however, clustering of the field galaxies remains the main uncertainty. Visual identification of the background galaxies in both the data and the simulations is very time consuming. Therefore we have searched for ways to automate the procedure.
2.1. Automating the SFM
Sextans A was the test case for automating the SFM together with NGC4536. In both cases results from manual galaxy counts were available. The automation works briefly as follows: a modified Source Extractor v2.2.2 (Bertin & Arnouts 1996) provides catalogues of objects with a variety of structural parameters. (Source Extractor’s neural network classification, concentration, contrast, flux radius, area, ellipticity, color and asymmetry). 111Concentration, contrast and asymmetry were defined as in Abrahams (1993).
Candidate objects are selected based on a score which is determined by a series of criteria for the structural parameters; values typical for background galaxies earn an object a higher score while those typical for stars and globular clusters result in a lower score. The advantages of the system are that objects does not need to meet all the criteria to be selected, and criteria can involve combinations of parameters.
The selected objects in the original data were checked visually to exclude diffraction spikes and blended stars. The selected objects in the simulations were automatically checked for the data-objects, thus leaving only simulated galaxies.
| Position | Exposure Time (s) | final pixelscale | |
|---|---|---|---|
| I | V | ||
| Sextans A North | 38400 (32) | 19200 (16) | 0.05” |
| Sextans A South | 1800 (3) | 1800 (3) | 0.05” |
3. Sextans A data
Sextans A provided an excellent opportunity to test the automated Synthetic Field Method with data on most of the galaxy with varying exposure times but with the two filters (V (F555W) and I (F814W)) used by Gonzalez et al. (1998) (tabel 1).
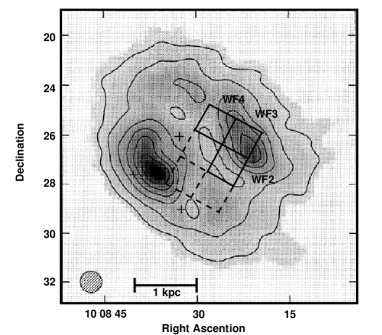
HI maps from Skillmann et al. (1988; figure 3) showed that the HST fields covered a range of HI column densities; figure 3) This allows us to compare dust to gas ratios similar to the approach of Cuillandre et al. (1999) in the outskirts of M31.
4. Results
The results for the WF3 and 4 are consistent with 0 magnitude opacity and WF2 with 0.5 magnitude. (see figure 2) However the error in the number of background galaxies due to their clustering is such that all can be considered consistent with no dust opacity. As can be seen from figure 4 the determined opacities for Sextans A all correspond to the relation Cuillandre et al. (2001) found experimentally in Sextans A.


5. Discussion
We conclude first that the SFM can be applied with almost the same
accuracy on fields with widely different exposure times. The
limitations come from background galaxy clustering and confusion,
not sensitivity.
Secondly, the SFM can be automated to a satisfactory degree.
As the clustering is the main uncertainty, applying the SFM to larger areas
with similar properties (HI column density, inside or outside the spiral arm
or at a certain radius) will lower these errors and give a general picture of
dust distribution in irregular and spiral galaxies.
We intend now to carry out a survey using the SFM of suitable WFPC data currently in the HST archive.
References
Bertin, E. and Arnouts, S., 1996, AAPS, 117, 393
Cuillandre, J., Lequeux, J., Allen, R.J., Mellier, Y. and Bertin, E., 2001,
ApJ, 554, 190
Domingue, D.L., Keel, W.C., Ryder, S.D. and White, R.E., 1999, AJ, 118, 1542
Domingue, D.L., Keel, W.C. and White, R.E., 2000, ApJ, 545, 171
Fruchter, A. and Hook, R.N., Proc. SPIE, 3164, 120
González, R.A., Allen, R.J., Dirsch, B.,
Ferguson, H.C., Calzetti, D.
and Panagia, N.,1998, ApJ, 506, 152
Keel, W.C. and White, R.E., 2001, AJ, 121, 1442
Skillman, E.D., Terlevich, R., Teuben, P.J. and van Woerden, H., 1988,
AAP, 198,33
White, R.E. and Keel, W. C., 1992, Nat, 359, 129
White, R.E., Keel, W.C. and Conselice, C.J., 2000, ApJ, 542, 761