The Type IIn SN 1995G: Interaction with the CSM. ††thanks: Based on observations collected at ESO - La Silla (Chile), Asiago (Italy) and Lick (USA)
Abstract
We present the photometric and spectroscopic evolution of the type IIn SN 1995G in NGC 1643, on the basis of 4 years of optical and infrared observations. This supernova shows very flat optical light curves similar to SN 1988Z, with a slow decline rate at all times. The spectra are characterized by strong Balmer lines with multiple components in emission and with a P-Cygni absorption component blueshifted by only 700 km s-1. This feature indicates the presence of a slowly expanding shell above the SN ejecta as in the case of SNe 1994aj and 1996L. As in other SNe IIn the slow luminosity decline cannot be explained only with a radioactive energy input and an additional source of energy is required, most likely that produced by the interaction between supernova ejecta and a pre–existent circumstellar medium. It was estimated that the shell material has a density cm-3, consistent with the absence of forbidden lines in the spectra. About 2 years after the burst the low velocity shell is largely overtaken by the SN ejecta and the luminosity drops at a faster rate.
keywords:
supernovae: general - supernovae: individual: SN 1995G, SN1988Z - galaxies: individual: NGC 1643, circumstellar matter1 Introduction
Supernovae of type II (SNe II) are characterized by H lines in their spectra. Among them a sub-class has been isolated which shows slow photometric evolution, absence of broad P-Cyg absorptions, and emission lines (H, in particular) with multiple components. Schlegel (1990) labeled these SNe as type IIn, where the “n” stands for“narrow”, though this designation is somewhat misleading because of the simultaneous presence of narrow and broad components. Best studied cases of this class are SN 1988Z (Stathakis & Sadler, 1991; Turatto et al., 1993; Filippenko, 1997; Aretxaga et al., 1999) and SN 1995N (Fox et al., 2000; Fransson et al., 2001). We recall that some very bright SNe IIn with very broad emission components, implying velocities as large as 17000 km s-1, may be associated with GRB, namely SN 1997cy [2000] and SN 1999E [1999, 1999a]. Another group, sometimes called SNe IId (or SNe IIsw), shows narrow P–Cygni absorptions on top of otherwise normal SNe II spectra (SN 1984E [1984], SN 1994aj [1998], SN 1996L [1999] and SN 1996al [2002]). These features have been explained by the presence of a thick expanding shell above the photosphere.
The present paper contains an extensive study of SN 1995G, an object which sharing properties both of SN 1988Z and SNe IId reinforces the link between these apparently different objects. It is worth to remind that a few other objects sharing some of the features of SN 1995G have been reported in recent years, i.e. SN 1997ab (Salamanca et al. 1998), SN 1997eg (Salamanca et al. 2001) and SN 1998S (Fassia et al. 2000, 2001).
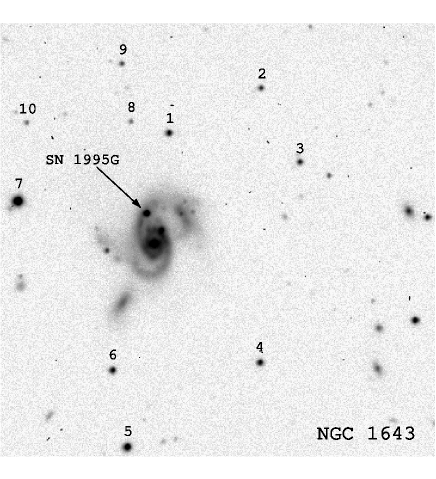
SN 1995G was discovered by Evans et al. [1995] on Feb. 23.5 U.T., using the 1-m reflector of the Australian National University in Siding Spring at an apparent visual magnitude of 15.5. McNaught & Cass [1995] measured the SN position as R.A. = , Dec = (equinox 2000.0), 4”.5 E and 16”.1 N from the center of NGC 1643 (see Fig. 1), a Sbc galaxy, with = 485029 km/s [1993]. Lacking other determinations, in the following we will adopt the galaxy distance modulus derived from the recession velocity, after correction for the Local Group infall into the Virgo Cluster (LEDA111http://leda.univ-lyon1.fr). Assuming =65 km s-1 Mpc-1, we obtain =34.32 (cfr. Sect. 4.2).
The basic information about SN 1995G and the parent galaxy is summarized in Tab. 1. It is worth mentioning that another type II supernova, SN 1999et (Cappellaro, 1999b), has been discovered in the same host galaxy.
We checked that no –ray burst has been detected by BATSE in the months before the discovery within 2 error radii from the position of SN 1995G. The closest event is burst 4B 950206B, which occurred 18 days before SN 1995Gdiscovery at 2.33 BATSE error radii.
The observations of SN 1995G, described in Sect. 2, are analyzed in Sect. 3 and 4. The discussion of the data is given in Sect. 5, and the conclusions are summarized in Sect. 6.
| SN 1995G | ||
| (J2000.0) | 04h43m4422 | |
| (J2000.0) | °18′538 | |
| Offset SN - Gal. Nucleus | 4”.5E, 16”.1N | |
| SN Type | IIn | |
| Discovery Date | 1995 Feb 23.5 | |
| (Julian Date) | (2449772) | |
| Discovery Magnitude | 15.5 | |
| NGC 1643 | ||
| (J2000.0) | 04h43m44s | |
| (J2000.0) | °19′10″ | |
| Morph. Type | SB(r)bc pec? | |
| Magnitude | 14.00 | |
| Galactic Extinction | 0.19 | |
| Diameters | 10 10 | |
| (km s-1) | 485029 | |
| (=65 km s-1 Mpc-1) | 34.32 | |
2 Observations
The photometric observations of SN 1995G in the optical bands cover a period of about 2.5 years. They were carried out using different ESO telescopes at La Silla and the Asiago 1.82m reflector.
CCD frames were reduced in the IRAF environment applying bias and flat-field corrections. At early phases, when the SN was bright, the SN magnitudes were measured with a PSF-fitting technique, which was preferred over aperture photometry because of the SN location inside a spiral arm. The late time photometry was obtained by means of a template subtraction technique, i.e. subtracting from the frame to be measured a late (5 years after discovery) image of the field after proper geometric, photometric and PSF matching.
The SN photometry has been performed relative to a local sequence (Fig. 1) calibrated during several photometric nights by comparison with standard stars from the list of Landolt [1992]. The magnitudes of the local sequence and those of the SN are reported in Tab. 2 and Tab. 3, respectively. At the last epochs since the SN was not detected, only upper limits are reported.
Errors on the magnitudes of the local sequence stars are estimated as the r.m.s. of the available measurements (no error is reported if only one measure is available). Photometric errors of the SN were estimated for some representative epochs (col. 6 of Tab. 3). They have been obtained via artificial star experiments, placing stars of the same magnitude as that of the SN in locations close to that of the SN, then computing the deviations of the recovered magnitudes.
| 1 | 2 | 3 | 4 | 5 | |
|---|---|---|---|---|---|
| U | 18.260.09 | 18.74 | 18.83 0.04 | 18.53 0.13 | 17.370.08 |
| B | 18.110.02 | 18.950.02 | 18.650.02 | 18.190.02 | 17.080.02 |
| V | 17.360.01 | 18.360.02 | 17.940.02 | 17.420.01 | 16.310.01 |
| R | 16.890.01 | 18.010.01 | 17.460.02 | 16.950.01 | 15.810.01 |
| I | 16.470.01 | 17.680.01 | 17.080.02 | 16.520.01 | 15.380.03 |
| 6 | 7 | 8 | 9 | 10 | |
|---|---|---|---|---|---|
| U | 17.970.03 | 16.21 | 19.54 | 20.00 | 20.03 |
| B | 17.990.01 | 15.590.01 | 19.690.02 | 19.620.06 | 21.300.10 |
| V | 17.420.01 | 14.700.02 | 19.430.03 | 18.800.02 | 19.510.01 |
| R | 17.060.01 | 14.180.01 | 19.280.03 | 18.330.02 | 18.340.02 |
| I | 16.710.01 | 13.690.01 | - | - | - |
| Date | JD | U | B | V | V) | R | I | J | H | K’ | Instrument |
|---|---|---|---|---|---|---|---|---|---|---|---|
| 28/02/95 | 49776.6 | - | 16.40 | 16.00 | - | 15.73 | 15.63 | - | - | - | 0 |
| 06/03/95 | 49782.6 | 15.96 | 16.33 | 16.02 | 0.03 | 15.76 | 15.56 | - | - | - | 1 |
| 30/03/95 | 49807.5 | - | 16.58 | 16.26 | - | - | - | - | - | - | 2 |
| 26/09/95 | 49986.6 | - | 18.81 | 18.07 | - | 17.41 | 16.95 | - | - | - | 0 |
| 14/10/95 | 50004.8 | - | 18.86 | 18.17 | - | 17.50 | 17.21 | - | - | - | 2 |
| 24/10/95 | 50014.6 | - | 18.91 | 18.23 | - | 17.59 | - | - | - | - | 0 |
| 24/10/95 | 50015.5 | - | 18.88 | 18.19 | - | 17.56 | - | - | - | - | 0 |
| 14/11/95 | 50035.5 | - | - | 18.43 | 0.05 | 17.83 | 17.41 | - | - | - | 3 |
| 22/11/95 | 50044.4 | - | 19.10 | 18.34 | - | 17.85 | - | - | - | - | 0 |
| 24/11/95 | 50045.5 | - | 19.03 | 18.47 | - | 17.87 | - | - | - | - | 0 |
| 17/01/96 | 50100.3 | - | - | 18.66 | - | 18.07 | - | - | - | - | 0 |
| 19/01/96 | 50101.6 | - | 19.25 | 18.66 | - | 18.11 | 17.77 | - | - | - | 4 |
| 18/02/96 | 50131.6 | - | 19.24 | 18.74 | - | - | - | - | - | - | 4 |
| 22/02/96 | 50135.6 | - | - | - | - | 18.03 | 17.82 | - | - | - | 1 |
| 04/09/96 | 50330.9 | - | 19.83 | 19.38 | 0.10 | 18.67 | - | - | - | - | 4 |
| 06/09/96 | 50332.8 | - | - | - | - | 18.64 | 18.53 | - | - | - | 4 |
| 19/11/96 | 50406.7 | 20.00 | 19.89 | 19.54 | - | 18.83 | 18.62 | - | - | - | 1 |
| 30/11/96 | 50418.3 | - | - | - | - | - | - | 18.3 | 17.7 | 17.2 | a |
| 02/01/97 | 50450.7 | - | 19.93 | 19.65 | - | 18.98 | 18.80 | - | - | - | 1 |
| 24/01/97 | 50473.1 | - | - | - | - | - | - | 18.5 | 18.2 | 17.6 | a |
| 28/03/97 | 50534.1 | - | - | - | - | - | - | 18.4 | 18.4 | 17.4 | a |
| 17/09/97 | 50709.4 | - | - | - | - | - | - | 19.1: | - | - | a |
| 22/09/97 | 50713.9 | - | 21.27 | 21.44 | 0.40 | 20.22 | 20.14 | - | - | - | 4 |
| 17/11/97 | 50770.7 | - | - | - | - | - | - | 19.2 | - | - | a |
| 22/12/98 | 51169.8 | - | - | 21.4 | - | 21.2 | - | - | - | - | 1 |
| 03/01/99 | 51182.7 | - | - | - | - | - | - | 20.7 | - | - | b |
| 04/11/99 | 51486.8 | - | - | - | - | 22.1 | - | - | - | - | 5 |
0 = Asiago 1.82m; 1 = Dutch 0.91m; 2 = ESO 3.6m + EFOSC1; 3 = NTT 3.5m
+ EMMI; 4 = ESO 2.2m + EFOSC2;
5 = Danish 1.54m + DFOSC; a = ESO 2.2m + IRAC2; b = NTT + SOFI
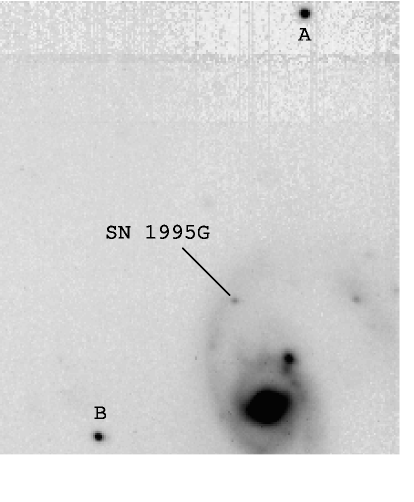
In addition to optical data, a number of late infrared observations have been obtained. For each epoch, a sequence of SN and nearby sky frames are available. After flat–field correction and sky subtraction, the frames were aligned and combined. For the IR photometric calibration we used standard stars taken from Carter & Meadows [1995], Hunt et al. [1998] and Persson et al. [1998]. The local sequence consists of only two stars in the field (see Fig. 2 and Tab. 4). The IR magnitudes of SN 1995G are reported in Tab. 3. Typical errors of the SN infrared magnitudes are 0.2 mag (0.4 mag on Sept. 17, 1997).
| Filter | A | B |
|---|---|---|
| J | 15.880.07 | 16.320.02 |
| H | 15.40 | 15.600.02 |
| K’ | - | 15.520.05 |
Optical spectroscopic observations were obtained at La Silla, Asiago and Lick Observatories. The log of these observations is given in Tab. 6. Wavelength calibrations were performed using comparison spectra of HeAr lamps while the flux calibration was done using spectra of standard stars (Stone & Baldwin, 1983; Baldwin & Stone, 1984; Hamuy et al., 1992; Hamuy et al., 1994) taken during the same nights. We made also an attempt to correct the SN spectra for atmospheric absorptions lines by comparison with the observed spectrum of a featureless hot star. Finally, the flux calibration of the reduced SN spectra was checked against the broad band photometry and found in reasonable agreement (typical error is 20-30%).

3 Photometry
3.1 Optical Light and Colour Curves
The BVRI light curves of SN 1995G (plus 2 measurements in U) are shown in Fig. 3. Though there are not definite evidences, we believe that the SN was discovered very close to maximum brightness. The blue color of the first spectrum is consistent with this belief (cf. Sect. 4).
| (Days) | ||||
|---|---|---|---|---|
| 0-215 | 1.19 | 1.07 | 0.80 | 0.65 |
| 215-680 | 0.25 | 0.33 | 0.31 | 0.36 |
| 680-940 | 0.51 | 0.68 | 0.47 | 0.51 |
At all wavelengths the light curves are relatively flat, decreasing by only 5 magnitudes in 2.5 years. The slopes of the light curves computed in different time intervals are given in Tab. 5. During the first months the slopes are steeper and then level out with time, until 1–2 years after the discovery they are as flat as 0.2-0.3 mag/ in all optical bands. A steepening in the luminosity decline was observed only after 650 days (about 0.5 mag/). A part from that, as we will see later, the light curve is very similar to that of SN 1988Z [1993].
Also, the colour evolution of SN 1995G (Fig.4) is similar to that of SN 1988Z. Because of the cooling of the expanding layers, most “normal” (non–interacting) SNe II show a rapid reddening after the explosion and only the emergence of nebular lines makes the colour turn blue again [1994]. In SN 1995G instead we observe a slow increase in from 0.3 to 0.7 in days, then the colour curve flattens somewhat. Allowing for the large uncertainties, the SN seems to become blue again at about 2.5 years after the discovery. It is interesting to note that the color curves of other SNe IIn, SN 1988Z (Turatto et al., 1993; Aretxaga et al., 1999) and SN 1997cy (Turatto et al., 2000), show similar properties, while the few points of SN 1996L (Benetti et al., 1999) indicate a more rapid evolution.

3.2 The Absolute and Bolometric Light Curves
Adopting the distance modulus =34.32 and a total absorption =0.20 (cfr. Sect. 4.2), we can calculate the absolute magnitudes near maximum. The values are: , , and . Figure 5 shows the comparison of the absolute V light curve of SN 1995G with those of other representative SNe II. It is remarkable the close coincidence with SN 1988Z.

In order to compute the energy budget of SN 1995G and to simplify the comparison with theory, it is useful to determine the bolometric light curve. Unfortunately no detections at UV, X–ray or radio wavelengths are available and we stress that in the case of SN 1988Z the contributions at these wavelengths were important [1999]. Actually, the position of SN 1995G was targeted with the VLA on 1995 June 22 (Van Dyk, private communication), but no radio emission was detected.
The available data range from U to K’ bands with much denser sampling at optical wavelengths. U data are available only at two distant epochs. We have estimated the contribution at intermediate epochs interpolating the U band contribution to the total emission between the two available epochs. Unfortunately near–IR observations start only when those in the U band cease, that is after 600 days.
The bolometric light curve is shown in Fig. 6 along with those of other SNe IIn and that of SN 1987A. As a reference we note that the luminosity of SN 1995G at the time of the first observation is only 5 times that of SN 1987A at the secondary maximum, while after two years it is 200 times brighter. Note that these latter are lower limits to the ratio of the bolometric luminosities because in the case of SN 1987A the IR contribution is included. The curves of SN 1995G and SN 1988Z [1999] are very similar. SN 1997cy, to date the most luminous type II SN, had a much faster decline rate and indeed after day 600 SN 1995G outshines SN 1997cy.

Since IR observations of SN 1995G are available only at late epochs, their contribution to the energy budget immediately after the SN explosion is unknown. We note, however, that around day 640 after the discovery, when we have the broadest photometric coverage from U to K’, the cumulative contribution of J, H, K’ bands is about 50 that of UBVRI. Our data indicate that the contribution of the near–IR increases with time, because the decline rates of infrared light curves appears to be slower than the optical ones.
We note that our IR observations of SN 1995G in the interval between day 640 and day 750 do not show the rise of the K’ continuum detected by Fassia et al. [2000] for the type IIn SN 1998S and attributed to emission from pre-existing, warm dust in the circumstellar material.
4 Spectroscopy
| Date | JD | Days | Instrument | Grism or | Resol. | Exp. | Range |
|---|---|---|---|---|---|---|---|
| from disc. | grating | ( A) | (min.) | ( A) | |||
| 25/02/95 | 49773.5 | 2 | Lick | 600,1200,600 | 7,4,7 | 7.5,7.5,7.5 | 3380-7300 |
| 30/03/95 | 49807.5 | 36 | ESO3.6+EF.1 | B300,O150,R300 | 18.4,7.6,21.5 | 10,15,10 | 3715-9805 |
| 14/10/95 | 50004.9 | 233 | ESO3.6+EF.1 | B300 | 18.4 | 15 | 3745-6940 |
| 31/10/95 | 50021.6 | 250 | As1.82+BC | 150 | 23 | 60 | 4530-8305 |
| 14/11/95 | 50035.7 | 264 | NTT+EMMI | gm3 | 7.8 | 30 | 3860-8390 |
| 19/01/96 | 50101.7 | 330 | ESO2.2+EF.2 | gm1,gm6 | 36,11.2 | 30,30 | 3325-9215 |
| 18/02/96 | 50131.6 | 360 | ESO2.2+EF.2 | gm6 | 11.2 | 60 | 4450-7060 |
| 06/09/96 | 50332.5 | 561 | ESO2.2+EF.2 | gm3,gm5 | 8.8,10.8 | 30,30 | 3220-9250 |
| 19/12/96 | 50436.5 | 665 | ESO1.5+BC | gt | 8 | 60 | 3515-9280 |
| 17/02/97 | 50496.6 | 725 | ESO1.5+BC | gt | 10 | 60 | 3085-10640 |
| 22/09/97 | 50713.9 | 942 | ESO2.2+EF.2 | gm5 | 11 | 60 | 5205-9305 |
4.1 The Spectral Evolution

The spectral evolution of SN 1995G during the first 2.5 years after the explosion is shown in Fig. 7. The first spectrum was taken within two days from the discovery [1995]. It shows a relatively blue continuum (Teff=8800 K after de–reddening, cfr. Sect. 4.2) with relatively narrow Balmer P–Cygni features superimposed on broader emission components. The overall intensity ratio of H/H is 1.58, lower than Case B recombination (2.8) while the intensity ratios of the individual components (cfr. Sect. 4.4) are very difficult to measure. The departure from simple recombination is the result of line formation in an extended atmosphere where the underlying continuum flux is stronger at H than at H. The P–Cygni absorption minima are displaced by about 700 km s-1 from the emission-line cores both for H and Fe II lines.
The next spectrum, taken about one month later, is similar, with a continuum temperature Teff=7000 K and several narrow P-Cyg lines of H, O I, Ca II and Fe II (see Sect. 4.3). Neither He nor Na I D lines are visible. The most evident difference with respect to the first spectrum is in the H/H ratio which has now increased to 3.0. Again this can be understood to result from the decrease of the continuum flux at H relative to H. Indeed, in the same period the ratio of the equivalent widths does not change significantly (EW(H)/EW(H)=3.0 and 3.2, respectively). Though conspicuous, the emission lines in the early spectra account for only about 4% of the total optical flux and have only a small influence on the SED.
The SN was then recovered eight months after discovery when the spectrum had noticeably changed. The continuum was redder and fainter, and dominated by emission lines of H, H and the infrared Ca II triplet. He I lines (e.g. 7065 A) appear and remain clearly visible for about 1 year, but contrary to other lines they do not show a blueshifted absorption. The He I 5876 A line is blended with Na I D, the latter having the narrow P–Cygni component. The very late spectrum shows only Balmer lines in emission (and probably IR Ca II). It should be noted that the galaxy contribution to the spectrum is not completely removed when the SN fades and the spectra are contaminated by the unresolved [S II] 6717,6731 A doublet, coming from an underlying H II region. Probably the background contaminates also the H narrow component with a (small) contribution to the total flux of the line. It is remarkable that during all the evolution there is a monotonic increase of the Balmer decrement.
In Fig. 8 we compare the spectrum of SN 1995G taken on 1995 March 30 with those of other SNe IIn. Despite the general similarity, the spectrum shows important differences with both SN 1997cy, and SN 1988Z. The line widths of these two objects are much broader than those of SN 1995G, implying expansion velocities of about 15000 km s-1 instead of 4-5000km s-1, hence probably higher explosion energies (Turatto et al., 2000; Aretxaga et al., 1999). The fact that SN 1995G and SN 1988Z have different kinematics of the ejecta, but nearly identical broad band light curves and overall luminosity evolution (Fig. 6) must be connected to the different densities of the respective circumstellar media (cfr. Sect. 5).
The spectrum of SN 1995G more closely resembles that of SN 1999eb taken 2 months after the discovery, and SN 1999el taken 18 days after the discovery (see Fig. 8). They have similar continua and strong emission lines with similar profiles. Curiously, the light curves of these objects having strong spectral similarities to SN 1995G, are steeper than that of SN 1995G, as shown by sparse unpublished observations from our archive.
In recent years several SNe have shown narrow P-Cygni absorptions. As we mentioned before, a number of SNe, sometimes dubbed IId or IIsw, show these features over an otherwise normal, broad–line photospheric spectrum. The spectrum of one of these, SN 1996L [1999] is shown in Fig. 8. It has been argued that in all these cases the narrow P-Cygni features originate in a slowly expanding shell of gas which has been ejected shortly before the explosions. In spite of the fact that these SNe show spectroscopic signature of eject-CSM interaction, they have light curves that decline as steeply as typical linear SNe II, and hence differ from SN 1995G.

4.2 The Recession Velocity and the Interstellar Absorption
The recession velocity of the host galaxy at the location of the SN, km s-1, has been derived from the narrow emission lines (H, H, [N II] and [O III]) arising from the H II regions surrounding the SN and measured on the spectrum of better resolution. This value is consistent with the nuclear velocity of NGC 1643, km s-1 [1993], since SN 1995G is located in an outer arm of the parent galaxy.
Interstellar absorption lines of Na I D are not clearly detected neither at the rest wavelength nor in the parent galaxy rest–frame, suggesting that the reddening cannot be particularly strong. The values of Galactic absorption by Schlegel et al. [1998] and RC3 are in good agreement, respectively and 0.19. In the following we will adopt for SN 1995G a total extinction , assuming therefore no absorption within the parent galaxy.
4.3 Line Identification
The line identifications have been made on two good signal–to–noise spectra taken on day 36 (1995 March 30) and day 561 (1996 September 6). The identifications are shown in Fig. 9.

At early times the strongest features are the H I Balmer lines characterized by broad emissions on top of which are narrow P-Cygni features. Fe II multiplet lines are also identified as absorption features in the bluest part of the spectrum (cfr. Fig. 9). Ca II H & K, and its IR triplet are also present and resolved in the multiplet components, as well as the O I lines at 7772 A and 8446 A. Two emissions at about 6250 and 5530 A (not marked in the figure) might be attributed to Sc II. Noticeable is the absence at this epoch of Na I D and He I lines which will appear only later (cf. Sect. 4.5). Unlike the case of SN 1988Z very high ionization (coronal) lines are not detected.
Numerous lines are identified also at the late epoch. Because of the small velocity of the emitting layers, the individual components of the IR Ca II triplet are resolved as well as the strong O I 8446 A emission. The strength of this line and the uncertain presence of other oxygen lines (such as O I 7772 A) is suggestive of the Ly pumping mechanism [1980]. [O I] 6300, 6363 A is not unambiguously identified because of the presence of other lines. Fe II is still present in numerous multiplets, while the presence of [Fe II] lines is not certain. In contrast with early spectra, many He I emissions lines become visible; among these the most obvious are at 7065, 6678, 5876, 5015, 4471 A, none of which shows the P–Cygni absorption component still visible in other lines. The 5876 A line is blended with Na I D.

4.4 The Profile and Evolution of the Balmer Lines
| Date | days after | v(H) | v(Fe II 5169A) |
|---|---|---|---|
| discovery | (km s-1) | (km s-1) | |
| 25/02/95 | 2 | 710 | 510 |
| 30/03/95 | 36 | 840 | 750 |
| 14/10/95 | 233 | 750: | 600: |
| 31/10/95 | 250 | - | 630: |
| 14/11/95 | 264 | 670 | 470 |
| 19/01/96 | 330 | 620 | 470 |
| 18/02/96 | 360 | 670 | 590 |
| 06/09/96 | 561 | 750 | 800 |
| Date | Phase | FWHM∗(H) [km s-1] | flux†(H) [ erg cm-2 s-1] | Balmer decrement | |||||||||
| [days] | broad | interm. | narrow | abs. | broad | interm. | narrow | abs. | total | obs. | |||
| 25/02/95 | 2 | 4150 | 1850 | 950 | 400 | 416 | 530 | 219 | -138 | 1170 | 1.58 | 1.50 | |
| 30/03/95 | 36 | 4600 | 2100 | 700 | 400 | 226 | 373 | 225 | -75 | 824 | 3.03 | 2.89 | |
| 14/10/95 | 233 | 360 | 5.45 | 5.20 | |||||||||
| 31/10/95 | 250 | 524 | 5.35 | 5.09 | |||||||||
| 14/11/95 | 264 | 3100 | 1300 | 250 | 450 | 202 | 320 | 11 | -68 | 533 | 5.61 | 5.35 | |
| 19/01/96 | 330 | 3000 | 1200 | 100: | 450 | 197 | 277 | 25 | -59 | 729 | 5.52 | 5.26 | |
| 18/02/96 | 360 | 3450 | 1400 | unres. | 450 | 138 | 321 | 11 | -68 | 470 | 6.02 | 5.74 | |
| 06/09/96 | 561 | 531 | 6.32 | 6.02 | |||||||||
| 19/12/96 | 665 | 2200 | 1150 | unres. | 450: | 85 | 124 | 53 | -14: | 262 | 6.56 | 6.24 | |
| 17/02/97 | 725 | 176 | 12.57 | 11.97 | |||||||||
| 22/09/97 | 942 | Boxy(FWZI) | 116 | ||||||||||
(*)deconvolved for the spectral resolution
corrected for reddening
The line profiles of H and H are complex and evolving with time. At early phases the lines show strong and narrow emission cores with blue absorptions superposed on broad wings. The relative intensities of the components change and the absorption features completely disappear at about 2 years. The temporal evolution is summarized in Fig. 10 together with that of other significant lines.
The expansion velocities at the photosphere derived from the P-Cygni minima are reported in Tab. 7. The velocities measured for H are of the order of 700–800 km s-1 thus indicating that either the kinetic energy of the ejecta is very small, as in the case of SN 1997D (Turatto et al., 1998; Benetti et al., 2001) or that they arise from an outer, slowly expanding shell as in the case of SNe 1994aj [1998] and 1996L [1999]. The expansion velocities measured from the Fe II 5169A absorption are on average slightly lower, about 600 km s-1. The typical FW half depth of the H absorption lines is around 400-450 km s-1(cfr. Tab. 8). Contrary to the absorption lines of normal SNe which form just above the receding photosphere (and hence show a progressive red-shift of the minima), the absorptions of SN 1995G remain at constant location in wavelength.
To disentangle the different components of H, we performed a multicomponent Gaussian fit of the lines. Within the first two years at least two emission components and a narrow blueshifted P-Cygni absorption are required to get a reasonable fit. However, the fitting of spectra of higher signal–to–noise and resolution requires a third emission component. The fitting was performed using the deblending option of the splot command in IRAF. A part for giving an inital guess for the position, FWHM and peak intensity of each component, no additional constraints were imposed. The FWHM and fluxes of the components of H are shown in Tab. 8. Although we are aware that fitting multiple Gaussian components to the composite spectral profile is somewhat arbitrary, we believe that it is safe to conclude that the observed emission lines arise from regions with significantly different characteristic velocities.
From the Table we note a slow monotonic evolution of the FWHM(H). The broad component has a FWHM of 4000–4500 km s-1 in the first spectra, decreasing to about 3000 km s-1 after 1 year and to 2200 km s-1 after 2 years. The intermediate component also declines from about 2000 to 1200 km s-1. The narrow component is resolved in the early spectra, while at later epochs the line width is below the spectral resolution. The evolution in width and intensity of this narrow component demonstrates that it is not due the galaxy background although some contamination is possible (cfr. the [N II] 6584A emission on day 665, Fig. 10). At the last epoch (942 days) the Gaussian fit fails because the profile is clearly boxy with FWZI km s-1.
The total H flux, as well as the fluxes of the individual components, show an overall decline with time. Small scale fluctuations in the H flux are to be ascribed to uncertainties in the absolute flux calibration and/or to uncertainties in the fitting. The comparison of the H integrated luminosity evolution of SN 1995G with that of other SNe (Fig. 11) shows that SN 1995G is similar to the CSM–interacting type IIn rather than to the radioactivity–powered normal SNe II, e.g. SN 1987A. We note however, that while the bolometric light curve of SN 1995G was nearly identical to that of SN 1988Z (Fig. 6), the H flux is about 0.8 dex fainter.

4.5 He I Lines
He I emission lines are not visible in the first spectra (cfr. Fig. 7 and 10). They emerge only after day 200, reach the maximum intensity between 8 and 20 months, and then disappear. In the 561 day spectrum, when He emissions reach the maximum relative intensity, we identify He I 4471 A, 6678 A and 7065 A. None of these lines show evidence of an absorption component. Other He I lines are probably blended with lines of other ions, e.g. with Fe II 4921 A and 5015 A. In particular, He I 5876 A is blended with the Na I D P-Cygni feature.
For the clean 7065 A emission we measure a FWHM velocity between 1200-1800 km s-1, close to that of the intermediate component of the Balmer lines. The flux of this line is about erg cm-2 s-1, between day 250 and 561. In the spectrum of day 665 the flux is one order of magnitude smaller (about erg cm-2 s-1); afterward the line was not detected. Other He I lines seem to have a similar evolution.
The strength of the He I 7065 A line with respect to other lines, e.g. 5876 A, suggests that nonthermal processes are at work. A similar evolution of He lines was observed in SN 1996L [1999].
5 Discussion
The light curves of the type II SN 1995G presented in Sect. 3 show relatively high luminosity and very slow luminosity declines. The absolute magnitude () is similar to that of SN 1988Z and SN 1994W [1998], two objects sharing some of the properties of SN 1995G.
The slow fading of SN 1995G persists well beyond 5-6 months, an epoch at which the light curves of normal SNe II, powered by the radioactive decay of 56Co, decline at about 1 mag/100 (Fig. 5 and 6). Therefore, another source of energy in addition to the radioactive decay is needed to power the light curve of SN 1995G. The similarity at all epochs SN 1988Z suggests that also in this case the surplus energy comes from the transformation of kinetic energy of the ejecta into radiation owing to interaction with a dense CSM.
Aretxaga et al. [1999] have proposed that in the case of SN 1988Z most of the energy have been emitted as X–rays and as ionizing radiation. They estimated that the total radiated energy was as high as ergs, suggesting complete reprocessing of the mechanical energy of the ejecta in only a few years. Unfortunately no X–rays observation is available for SN 1995G. The ionization energy computed from the H luminosity [1999] is considerably smaller for SN 1995G than for SN 1988Z, because of the weaker line emission (Fig. 11). However, despite significant differences in the H luminosity, the bolometric luminosities of the two SNe are very similar. The radiated energy of SN 1995G integrated over the 3 years of observations is almost the same as in SN 1988Z in the same period ( ergs in BVR).
The optical light curves of SN 1988Z, the X–rays and H emission, and the line–width evolution are reproduced by a model in which the ejecta is interacting with a dense ( cm-3) and homogeneous CSM (Aretxaga et al., 1999; Terlevich et al., 1992). In these conditions the SN remnant evolves very rapidly and radiative cooling becomes important well before the thermalization of the ejecta. The ejecta-CSM interaction causes the formation of a hot shocked shell between two shock waves: a forward shock ( 10000 km s-1) encountering and heating the CSM to a temperature of about K and a slow reverse shock ( 1000 km s-1) which thermalizes the SN ejecta to a temperature of about K. A high flux of X–rays photons is produced in the high-density material shock front, while the cooling shocked gas reinforces the intensity of H components. The reference model by Terlevich et al. [2001] of the interaction of the ejecta with a circumstellar shell ( cm-3 and ) does not fit completely the observations of SN 1995G. In particular, the observed H luminosity of SN 1995G after 230 days (1 tsg) is fainter by a factor 10 and the Balmer decrement is too steep. Indeed these differences are not surprising, because type IIn SNe exhibit considerable heterogeneity, indicating that the physical conditions and/or the geometry of the interaction can be very different. For example SN 1988Z remained visible for over 10 years, while SN 1994W dropped in luminosity after four months probably because the interaction ceased earlier. SN 1997cy, the brightest SN IIn rapidly faded below the detection limit after two years [2000].
The first spectrum of SN 1995G shows a continuum corresponding to TBB=8800 K, a temperature close to that of SN 1987A a couple of days after the explosion, supporting the idea that SN 1995G was discovered soon after the explosion (Sect. 3.1). On the other hand, the small temperature variation over the first month (TBB(36d)=7000 K) gives the opposite indication. The spectra show some distinctive feature compared to those of SN 1988Z, which shared similar bolometric evolution. The narrow absorption components were never detected in the spectra of SN 1988Z, although this might be due to the modest spectral resolution of those observations.
The spectra of SN 1995G are very similar both as line ratios and profiles to those of SN 1994W around maximum [1998]. In particular, H shows the same velocity profiles with absorption minima blue shifted by similar amounts (cfr. Fig. 10 with Fig. 3 in Sollerman et al., 1998). Other ions, e.g. Ca II and Fe II, show similar line profiles. Instead the blackbody temperature of SN 1995G is lower, and two days after the discovery it corresponds to that of SN 1994W on day 80.
From the blackbody fits and the bolometric luminosity we can derive the photospheric radii on days 2 and 36, which are of cm and cm, respectively.
Up to about 1 yr the P-Cygni profiles of H and Fe lines are rounded and the narrow emission and absorption components are symmetric. This indicates that optical depths of these lines are , the lines are scattering dominated and originate in a rather thin shell close to a (pseudo)photosphere. Rybicki and Hummer (1978) showed that in this situation of an expanding shell the optical depth in a line depends on the velocity gradient. Fransson(1984) elaborating on this presented a precise expression for the optical depth which was then used in the specific case of SN 1994W by Sollerman et al. [1998] to derive a lower limit to the density in the shell under the assumption that the lines had a large optical depth because their profiles were rounded or parabolic [1978]. The case is, in this respect, very similar to that of SN 1995G thus we can use the expression cm-3, where is the shell velocity in units of km s-1 and is the shell radius in units of cm. Assuming that the shell radius is close to that of the photosphere, using the values of derived from the minima of the absorptions, we get cm-3, consistent with the absence of forbidden lines. The density of the slowly expanding material in SN 1995G is therefore similar to that of SN 1994W but higher than in SN 1988Z, for which the ratio of [O III] 4363, 4959 and 5007 A lines indicate densities cm-3 (Statakis & Sadler, 1991; Filippenko, 1991).
Another distinctive characteristic of some SNe IIn, e.g. SN 1988Z, SN 1995N (Benetti et al., 1995; Turatto et al., 2002) and SN 1986J [1993], is the presence of narrow emission lines of very high ionization (e.g. [Fe VII], [Fe X]) which are direct evidence of energy dissipation in powerful shock waves. In SN 1995G such lines are not present.
We noted in Sect. 4 that it is possible to identify gas with different kinematics. The results of a multicomponent fit for SN 1995G have been summarized in Tab. 8. Compared to the expansion velocity of the broadest component of SN 1988Z (FWHM km s-1), the broad component in SN 1995G is much slower (FWHM km s-1), while the other components are similar. This implies that the fast–moving ejecta photoionized by the hard radiation of the shock move more slowly, justifying the absence of very high ionization species.
Similarly to SN 1996L [1999], after day 200 high excitation He lines emerge. The low temperature of the envelope suggests that these lines result from non-thermal processes. The unusual relative strengths of the He I lines probably owe their origin to excitation by a radiative shock in the dense or clumpy wind with the consequent large optical depth in the He I 3889A line. Such line ratios have been observed in some symbiotic stars by Proga et al. [1994] who appealed to the calculations of Almog and Netzer [1989] to show that large optical depths of He I 3889A combined with high densities may produce these unusual line ratios. We have demonstrated the plausible existence of high densities at intermediate velocity probably associated with shock propagation. The bump in the H light curve during the same interval may result from the same shock excitation.
After 2 years, the absorption components disappear and H evolves to a boxy profile. Simultaneously the H luminosity declines and the light curves become steeper, but still not as much as the decay rate of 56Co. This may suggest that the interaction is fading. Something similar happened in SNe 1994aj [1998] and 1996L [1999] in which the narrow P-Cygni profiles of gradually disappeared, leaving broad boxy emissions. In the case of SN 1996L we observed the progressive development of the narrow features first as pure emissions, and later as P–Cygni structures, when significant recombination took place. After 100 days the lines broadened and the absorption progressively disappeared. This has been interpreted as the onset of the interaction of the ejecta with an outer shell which is progressively swept away. The analysis of the timing of these phases led to the conclusion that the shell was produced by a wind episode that started 9 years before the explosion and lasted 6 years. Benetti et al. [1999] noticed that SNe 1994aj and 1996L had linear light curves in the early 100 days, which is indirect evidence of low–mass, wind–deprived envelopes.
The case of SN 1995G is different. The light curve remains very flat since the discovery, indicating that the interaction with the CSM started soon after the burst, and is still continuing at the time of our last observation on day 942. Therefore, if the CSM is due to a stellar wind from the progenitor, a strong wind persisted almost to the time of the explosion. From the duration of the interaction, given a wind velocity is 750 km s-1 and a maximum expansion velocity of the ejecta of 4500 km s-1(Fig. 10), we derive that the wind episode started at least a dozen years before the burst. The dense CSM could be due also to the presence of a companion which might have stripped gas from the precursor or might have lost its own envelope.
The fact that the P-Cygni profile is already well developed at the discovery, contrary to the case of SN 1996L, indicates that the recombination of the shell took place earlier, probably because of higher densities ( cm-3). After 2 years, however, most of the slowly expanding shell has been swept away by the forward shock, the optical depth of the unshocked material is low, and the line profiles show only the boxy shape due to the shock. The simultaneous decrease of brightness (increase of decline rate of the light curves) can be evidence of a steepening of the density profile in CSM shell. Yet, up to 3 years after the discovery, there is evidence that the residual interaction between the SN ejecta and CSM has not completely ceased.
Thus, SN 1995G seems to be an intermediate case between SN 1988Z interacting with a dense CSM from the early stages after the explosion, and less extreme objects like SNe 1994aj and 1996L which interaction with a shell of material ejected a few years before the explosion were limited in time.
5.1 Progenitor Mass Loss
In Sect. 5 we pointed out that the Terlevich et al. [2001] model of the interaction of the ejecta with a dense, uniform density gas, which reproduces the observations of SN 1988Z, does not fit all the observables of SN 1995G. Chugai & Danziger [1994] presented calculations of the dynamical interaction of the ejecta of SN 1988Z with a dense clumpy circumstellar wind (). Following the latter approach we can derive some important parameters of the progenitor.
We assume that the velocity of the broad H emission is representative of the velocity of the ejecta, since this component is supposed to originate in the shocked ejecta.
The interaction between the ejecta and the progenitor’s wind follows two distinct phases: initially the outer part of the SN ejecta, having a power-law density distribution, collides with the wind. This is the so-called free expansion phase. In this phase the shock velocity (which is observed as the velocity of the broad component of H) is given by
| (1) |
where is the kinetic energy of the ejecta in units of erg, is the time elapsed since the explosion in years, is the wind density parameter, is the wind velocity and g cm-1. A lower limit for can be obtained from the general expression for the luminosity of the shock wave:
| (2) |
Here is the SN luminosity (which is dominated by the interaction) and is the efficiency of conversion of mechanical into optical energy.
In the case of SN 1995G at years, we estimate erg s-1 (with a considerable uncertainty, because of the paucity of observed data at this epoch) and km s-1. If we assume , equation (2) gives g cm-1. For a wind velocity km s-1, typical of a red supergiant (RSG), we get yr-1, which is a lower limit because in general . Such large results from the fact that is large but is small. In the case of SN 1988Z, which has the same but km s-1, yr-1. From Eq. (1) and g cm-1 we obtain the ejecta mass of SN 1995G: . So, if erg, .
Eventually, the outer, power–law part of the ejecta overtake the wind, and the interaction is then between the wind and the inner part of the ejecta, which has a flat density profile. In this regime, called the blast wave phase [1994], the velocity is
| (3) |
where and are the kinetic energy and the mass of the ejecta, respectively, and is the ratio of kinetic to total energy (typically 1/2). For the parameters of SN 1995G, this gives , so if erg, .
Since it is not clear which phase of the interaction was observed in SN 1995G, the mass of the ejecta can be estimated from the above considerations to be in the range provided that and erg. Including the mass of the neutron star remnant, we obtain a pre–SN mass between 5 to 11 , which correspond to zero–age main sequence masses around if a new empirical formulation of the mass–loss rate and a diffusive approach of turbulent mixing is adopted [1999]. We stress that the values of the mass loss are very sensitive to metallicity and that the estimates of are strongly dependent on the value of the explosion energy. The uncertainties on the progenitor mass are therefore very large, meaning that it could be significantly lower.
As for the H luminosity, this is a constant factor of 6 smaller in SN 1995G than in SN 1988Z. However, the width of the intermediate component of H is about a factor of 4-5 smaller (2000 vs. 9000 km s-1), so if the wind is clumpy as in SN 1988Z, but the density is higher in SN 1995G ( was higher), this may be a natural result.
We note also that the small inferred mass of the precursor of SN 1988Z () is a consequence of the assumptions erg and . If a higher value of the kinetic energy is used for SN 1988Z, as may be suggested in Aretxaga et al. [1999], a larger ejecta mass is obtained. On the other hand decreasing leads to a higher wind density and mass–loss rate (and to a larger mass lost in the wind), but it also leads to a smaller ejecta mass through eq. (1). Whether this leads to a significantly different estimate of the mass of the progenitor is not clear, however, as this depends on the duration of the strong RSG wind episode.
6 Conclusions
This paper presents the photometric and spectroscopic observations of SN 1995G obtained at ESO La Silla, Lick and Asiago, over a period of more than 4 years after the discovery.
The broad band and bolometric light curves are flatter than those expected from radioactive decay. The luminosity peak and evolution are very similar to those of the well studied SN 1988Z. This implies the presence of an additional source of energy, most likely the interaction of the ejecta with a dense CSM.
The line profiles show evidence of different components. The strongest line, H, shows relatively narrow P-Cygni profiles with minima displaced by 700-800 km s-1superimposed on an intermediate width emission FWHM km s-1and on a broader component having FWHM km s-1. The widths of these emission lines decrease with time. At 942 days after maximum the Hemission has a boxy shape with FWZI=2500 km s-1, suggesting that most of the expanding shell has been swept away and the optical depth of the material is low. The emission lines of SN 1995G were narrower than in SN 1988Z, indicating slower expansion velocities of the ejecta.
The detection of strong He lines between about 200 and 600 days after the discovery indicates the presence of non-thermal effects. Simple considerations about the density of the slowly expanding material indicate densities cm-3, in agreement with the absence of forbidden lines.
In the hypothesis that the additional source of luminosity of SN 1995G is the conversion to radiation of the kinetic energy of the ejecta due to interaction with a precursor wind, we estimate the mass of the ejecta and the mass loss. We obtain and = 0.002 /yr, respectively, provided that the conversion efficiency is and the explosion energy is erg.
Acknowledgments
We acknowledge support from the Italian Ministry for
University and Scientific and Technological Research (MURST) through grant
Cofin MM02905817.
A.V. Filippenko is grateful for a Guggenheim Fellowship
and for NSF grant AST–9987438.
References
- [1989] Almog, Y., Netzer, H., 1999, MNRAS, 238, 57.
- [1999] Aretxaga, I. et al., 1999, MNRAS, 309, 343
- [1984] Baldwin, J. A., Stone, R. P. S., 1984, MNRAS, 206, 241
- [1979] Barbon, R., Ciatti, F., Rosino, L., 1979, A&A, 72, 287
- [1990] Barbon, R., Benetti, S., Rosino, L., Cappellaro, E., Turatto, M., 1990, A&A, 237, 79
- [1999] Barbon, R., Buondí, V., Cappellaro, E., Turatto, M., 1999, A&AS, 139, 531B
- [1995] Benetti, S., Bouchet, P., Schwarz, H., 1995, IAUC 6170
- [1998] Benetti, S., Cappellaro, E., Danziger, I. J., Turatto, M., Patat, F., Della Valle, M., 1998, MNRAS, 294, 448
- [1999] Benetti, S., Turatto, M., Cappellaro, E., Danziger, I. J., Mazzali, P. A., 1999, MNRAS, 305, 811
- [2001] Benetti, S., Turatto, M., Balberg, S., Zampieri, L., Shapiro, S. L., Cappellaro, E., Nomoto, K., Nakamura, T., Young T. R., Patat, F., 2001, MNRAS, 322, 361
- [2002] Benetti, S. et al., 2002, in prep.
- [1999b] Cappellaro, E., 1999, IAU Circ., 7304
- [1999a] Cappellaro, E., Turatto, M., Mazzali,P.M., 1999, IAU Circ., 7091
- [1990] Carter, B. S., 1990, MNRAS, 242, 1
- [1995] Carter, B. S., Meadows, V. S. 1995, MNRAS, 276, 734
- [1987] Catchpole, R. M. et al., 1987, MNRAS, 229, P15
- [1988] Catchpole, R. M. et al., 1988, MNRAS, 231, P75
- [1989] Catchpole, R. M. et al., 1989, MNRAS, 237, P55
- [1994] Chevalier, R. A., Fransson, C., 1994, ApJ, 420, 268
- [1991] Chugai, N. N., 1991, MNRAS, 250, 513
- [1994] Chugai, N. N., Danziger, I. J., 1994, MNRAS, 268, 173
- [1991] de Vaucouleurs, G., de Vaucouleurs, A., Corwin, H. G., Buta, R. J., Paturel, G., Foque, P., 1991, Third Reference Catalogue of Bright Galaxies, Springer-Verlag Berlin Heidelberg New York
- [1984] Dopita, M. A., Cohen, M., Schwartz, R. D., Evans, R., 1984, ApJ, 284, 69
- [1995] Evans, R. O., Shobbrook, J., Beaman, S., Cass, P., 1995, IAU Circ., 6138
- [2000] Fassia, A. et al., 2000, MNRAS, 318, 1093
- [Fassia et al.(2001)] Fassia, A. et al. 2001, MNRAS, 325, 907
- [1997] Filippenko, A. V., 1997, ARA&A, 35, 309
- [1991] Filippenko, A. V., 1991, in SN 1987A and Other Supernovae, ed. I. J. Danziger and K. Kjar, (Garching, ESO), 343
- [1995] Filippenko, A. V., Schlegel, D., 1995, IAU Circ., 6139
- [1999] Filippenko, A. V., Leonard, D. C., Riess, A. G., 1999, IAU Circ., 7091
- [Fox et al.(2000)] Fox, D. W. et al. 2000, MNRAS, 319, 1154
- [ 1984] Fransson, C., A&A, 1984, 132, 115.
- [ 2001] Fransson, C., Chevalier, R. A., Filippenko, A.V., Leibundgut, B., Barth, A. J., Fesen, R. A., Kirshner, R. P., Leonard, D. C., Li, W., Lundqvist, P., Sollerman, J., Van Dyk, S. D., ApJ submitted (astro-ph 0108149)
- [2000] Germany, L., et al., 2000, ApJ, 533, 320
- [1980] Grandi, S.A., 1980, ApJ 238, 10
- [1997] Hagen, H. J., Engels, D., Reimers, D., 1997, A&A, 324, L29
- [1992] Hamuy, M., Walker, A. R., Suntzeff, N. B., Gigoux, P., Heathcote, S. R., Phillips, M. M., 1992, PASP, 104, 533
- [1994] Hamuy, M., Suntzeff, N. B., Heathcote, S. R., Walker, A. R., Gigoux, P., Phillips, M. M., 1994, PASP, 106, 566
- [1993] Huchra, J., Latham, D. W., Da Costa, L. N., Pellegrini, P. S., Willmer, C. N. A., 1993, AJ, 105, 1637
- [1998] Hunt, L. K., Mannucci, F., Testi, L., Migliorini, S., Stanga, R. M., Baffa, C., Lisi, F., Vanzi, L., 1998, AJ, 115, 2594
- [1992] Landolt, A. U., 1992, AJ, 104, 340
- [1995] McNaught, R. H., Cass, C. P., 1995, IAU Circ., 6140
- [1978] Mihalas, D., 1978, Stellar Atmospheres, 2nd ed. (San Francisco: Freeman)
- [1994] Patat, F., Barbon, R., Cappellaro, E., Turatto, M., 1994, A&A, 282, 731
- [1999] Patat, F., Salvo, M., Pizzella, A., 1999, IAU Circ., 7107
- [1998] Persson, S. E., Murphy, D. C., Krzeminsky, W., Roth, M., Rieke, M. J., 1998, AJ, 116, 2475
- [1994] Proga, D., Mikolajewska, J., Kenyon, S.J., 1994, MNRAS, 268, 228
- [1978] Rybicki, G.R., Hummer, D.G., 1978, ApJ, 219, 654
- [Salamanca et al.(1998)] Salamanca, I., Cid-Fernandes, R., Tenorio-Tagle, G., Telles, E., Terlevich, R. J., & Munoz-Tunon, C. 1998, MNRAS, 300, L17
- [2001] Salamanca, I., Terlevich, R.J., Tenorio-Tagle, G., MNRAS submitted, (astro-ph 0112067)
- [1999] Salasnich, B., Bressan, A., Chiosi, C., 1999, A&A, 342, 131.
- [1998] Schlegel, D. J., Finkbeiner, D. P., Davis, M., 1998, ApJ, 500, 525
- [1990] Schlegel, E. M., 1990, MNRAS, 244, 269
- [1975] Schultz, G. V., Wiemer, W., 1975, A&A, 43, 133
- [1998] Sollerman, J., Cumming, R. J., Lundqvist, P., 1998, ApJ, 493, 933
- [1991] Stathakis, R. A., Sadler, E. M., 1991, MNRAS, 250, 786
- [1983] Stone, R. P. S., Baldwin, J. A., 1983, MNRAS, 204, 237
- [1992] Terlevich, R., Tenorio-Tagle, G., Franco, J., Melnick, J., 1992, MNRAS, 255, 713
- [1995] Terlevich, R., Tenorio-Tagle, G., Rozyczka, M., Franco, J., Melnick, J., 1995, MNRAS, 272, 198
- [2001] Terlevich, R., Rozyczka, M., Tenorio-Tagle, G., Franco, J., (2001) in preparation
- [1993] Turatto, M., Cappellaro, E., Danziger, I. J., Benetti, S., Gouiffes, C., Della Valle, M., 1993, MNRAS, 262, 128
- [1998] Turatto, M., Mazzali, P. A., Young, T. R., Nomoto, K., Iwamoto, K., Benetti, S., Cappellaro, E., Danziger, I. J., de Mello, D. F., Phillips, M. M., Suntzeff, N. B., Clocchiatti, A., Piemonte, A., Leibundgut, B., Covarrubias, R., Maza, J., Sollerman, J., 1998, ApJ, 498, 129
- [2000] Turatto, M., Suzuki, T., Mazzali, P. A., Benetti, S., Cappellaro, E., Danziger, I. J., Nomoto, K., Nakamura, T., Young, T. R., Patat, F., 2000, ApJ 534, 57
- [2002] Turatto, M.et al., 2002 in prep.
- [1996] Van-Dyk, S. D., Weiler, K. W., Sramek, R. A., Schlegel, E. M., Filippenko, A. V., Panagia, N., Leibundgut, B., 1996, AJ, 111, 1271