First optical light from the supernova remnant G 17.42.3
Deep optical CCD images of the supernova remnant G 17.4–2.3 were obtained and faint emission has been discovered. The images, taken in the emission lines of HN ii, [S ii] and O iii, reveal filamentary structures in the east, south–east area, while diffuse emission in the south and central regions of the remnant is also present. The radio emission in the same area is found to be well correlated with the brightest optical filament. The flux calibrated images suggest that the optical filamentary emission originates from shock-heated gas ([S ii]/H 0.4), while the diffuse emission seems to originate from an H ii region ([S ii]/H 0.3). Furthermore, deep long–slit spectra were taken at the bright O iii filament and clearly show that the emission originates from shock heated gas. The O iii flux suggests shock velocities into the interstellar clouds” greater than 100 km s-1, while the S ii ratio indicates electron densities 240 cm-3. Finally, the H emission has been measured to be between 7 to 20 erg s-1 cm-2 arcsec-2.
Key Words.:
ISM: general – ISM: supernova remnants – ISM: individual objects: G 17.4-2.31 Introduction
The Galactic supernova remnants (SNRs) have been identified by both radio (non-thermal synchrotron emission) and optical (optical emission lines) surveys. New searches in both wavebands continue to identify galactic SNRs (Fesen & Hurford 1995, Fesen et al. 1997; Green 2001 and references therein; Mavromatakis et al. 2000, 2001, 2002) but since the last few years, observations in X-rays have also detected new SNRs (e.g. Seward et al. 1995). The ratio of [S ii]/H has become the standard discriminator used in optical SNR observations because the photoionized nebulae (like H ii regions and planetary nebulae) usually exhibit ratios of about 0.1-0.3, while collisionally ionized nebulae (like known Galactic SNRs) show ratios typically greater than 0.4 (Smith et al. 1993). Fesen et al. (1985) suggested that a division at [S ii]/H 0.5 does not provide clear evidence to distinguish SNRs from photoionized regions and additional observations of the strong forbidden oxygen lines (O i, O ii and O iii) are needed to give a complete diagnostic. Furthermore, theoretical shock models , generally predicted [S ii]/H ratios of 0.5 to 1.0 for SNRs (Raymond 1979, Shull & McKee 1979).
G 17.42.3 is not a well known SNR, and was first detected by Reich et al. (1988) in their Effelsberg 2.7–GHz survey, while its radio image was published by Reich et al. (1990). It is classified as a circular supernova remnant with an incomplete radio shell, characterized by diffuse shell–like emission, an angular size of 24′ and a radio spectral index of 0.8 (Green 2001). Case & Bhattacharya (1998) calculated its surface brightness to be W m-2 Hz-1 m-1. Because, there is no direct distance determination, they have made an estimation by utilizing the radio surface brightness – diameter relationship () and found a distance of 8.5 kpc, but still the uncertainties are large (40%). Green et al. (1997), through their survey with the Parkes 64 m telescope, detected maser OH (1720 MHz) emission. In radio surveys of the surrounding region, no pulsar was found to be associated with G 17.4–2.3 but another SNR has been discovered in its neighborhood. G 17.82.6 has a very well defined shell, it lies about 30′ north–east of G 17.4–2.3 and has an angular diameter of 24′ (Reich et al. 1988). Neither of these remnants has been detected optically in the past and from our observations no optical emission has been found in G 17.8–2.6. On the other hand, X–ray emission was not detected from G 17.4–2.3 in the ROSAT All–sky survey, while there is some evidence of X–ray emission from the neighboring SNR G 17.8–2.6.
In this paper, we report the discovery of faint optical filaments from G 17.4–2.3. We present HN ii, S ii and O iii images which show filamentary structure along the south–east edge of the remnant correlated very well with the radio emission. Spectrophotometric observations of the brightest filament were also obtained and the emission lines were measured. In Sect.2, we present informations concerning the observations and data reduction, while the results of our imaging and spectral observations are given in Sect. 3 and 4, respectively. In the last section (Sect. 5) we discuss the physical properties of G 17.4–2.3.
2 Observations
2.1 Imagery
The observations presented here were performed with the 0.3 m Schmidt-Cassegrain (f/3.2) telescope at Skinakas Observatory in Crete, Greece in August 20 and 21, 2001. The 10241024 (with 1919 m2 pixels) Tektronix CCD camera was used resulting in a scale of 4″.1 pixel-1 and a field of view of 70′ 70′.
Two exposures in O iii and S ii of 2400 s each were taken during the observations, while one exposure of 1800 s and one of 2400 s were obtained with the HN ii filter. Note that the final images in each filter are the average of the individual frames.
The image reduction (bias subtraction, flat-field correction) was carried out using the standard IRAF and MIDAS and their negative gray–scale representation using the STARLINK Kappa and Figaro packages. The astrometry information was calculated for each image individually using stars from the Hubble Space Telescope (HST) Guide Star Catalogue (Lasker et al. 1999). The spectrophotometric standard stars HR5501, HR7596, HR7950, and HR8634 (Hamuy et al. 1992; 1994) were used for absolute flux calibration. All coordinates quoted in this paper refer to epoch 2000.
2.2 Spectroscopy
Low dispersion long–slit spectra were obtained with the 1.3 m telescope at Skinakas Observatory in 2001 August 21. The 1300 line mm-1 grating was used in conjunction with a 2000800 SITe CCD (1515 m2 pixels) which resulted in a scale of 1 Å pixel-1 and covers the range of 4750 Å – 6815 Å. The slit width is 77 and it was oriented in the south–north direction, while the slit length is 79. The coordinates of the slit centre are 18h31m30s and 14°51′33″ and two spectra of 3600 s each were obtained. The spectrophotometric standard stars HR5501, HR7596, HR9087, HR718, and HR7950 were observed in order to calibrate the spectra of G 17.4–2.3.
| N1 | SW1 | Center1 | H ii 2 | |
|---|---|---|---|---|
| HN ii | 116.0 | 111.2 | 108.0 | 99.7 |
| S ii | 16.3 | 22.1 | 17.3 | 8.6 |
| O iii | 13.0 | 4.7 | 22.1 | – |
Fluxes in units of erg s-1 cm-2 arcsec-2
1Median values over a 36″ 21″ box
2Median values over a 60″ 60″ box
3 Imaging of G 17.4–2.3
3.1 The HN ii and S ii emission line images
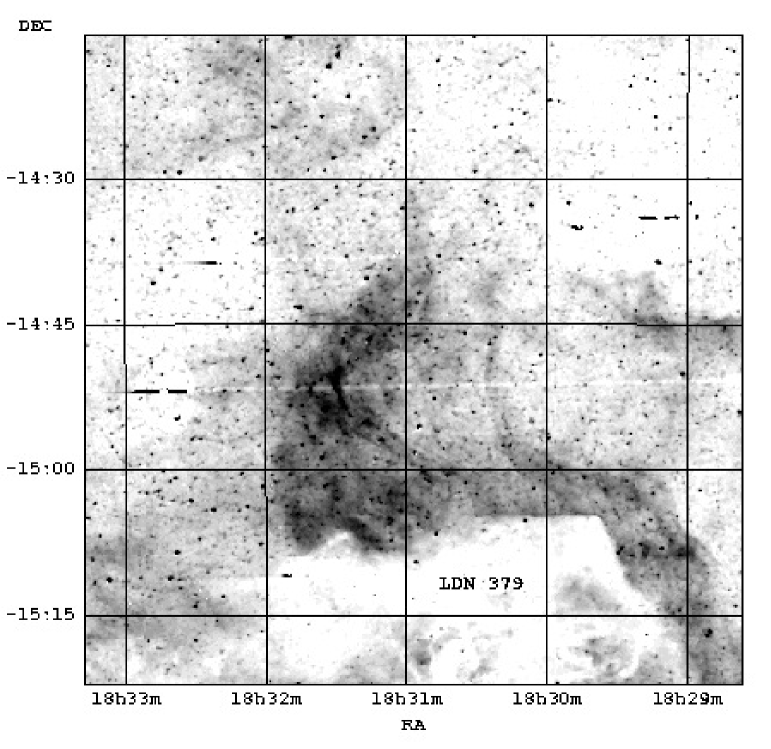
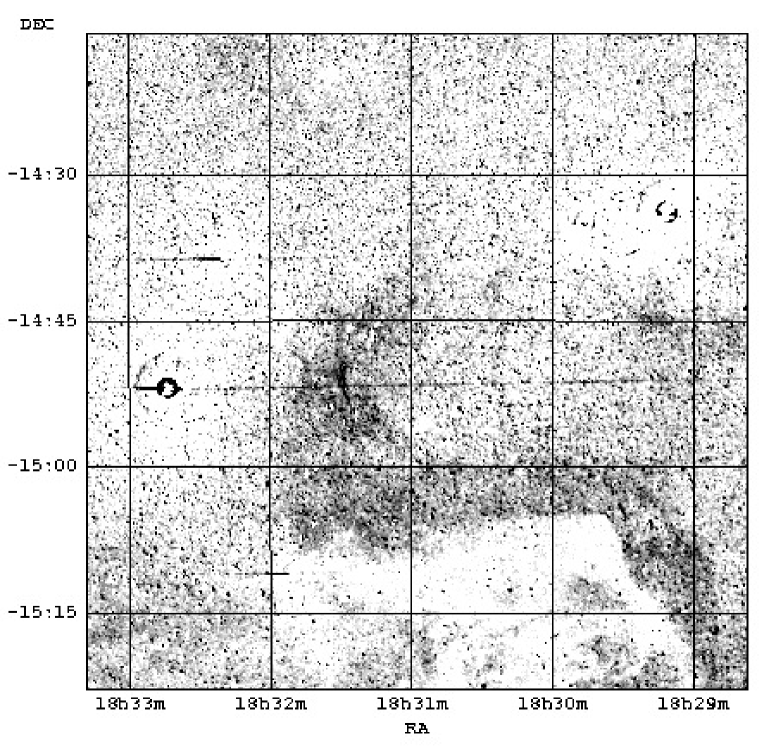
The major characteristic revealed from our HN ii and [S ii] images (Fig. 1 and 2, respectively) seems to be the low surface brightness of G 17.4–2.3. The weak diffuse emission is present in the south, south–east and central areas of the remnant, while no emission is detected in the north–west part. The most interesting region lies in the east part of the remnant, where a filamentary structure exists, which is very well correlated with the radio emission. In Table 1, we present typical average fluxes measured in several locations within the field of G 17.4–2.3 including the unknown H ii region which is located south–east of the remnant. A deeper study of these images shows that the emission from the brightest part of the remnant (east filament) originates from shock heated gas since we estimate a ratio [S ii]/H 0.4–0.6, while a photoionization mechanism produces the south–east H ii region (S ii/H 0.2–0.3). The possibility that the H ii emission contaminates the remnant’s emission can not be ruled out since for some of the areas close to the filament as well as to the central region of the remnant, we estimate [S ii]/H 0.2–0.3. The known dark, extended nebula LDN 379 (Lynds lyn65 (1965)), which is at a distance of 200 pc (Hilton et al. hil86 (1986)) is also visible in the low ionization images.
3.2 The O iii 5007Å image
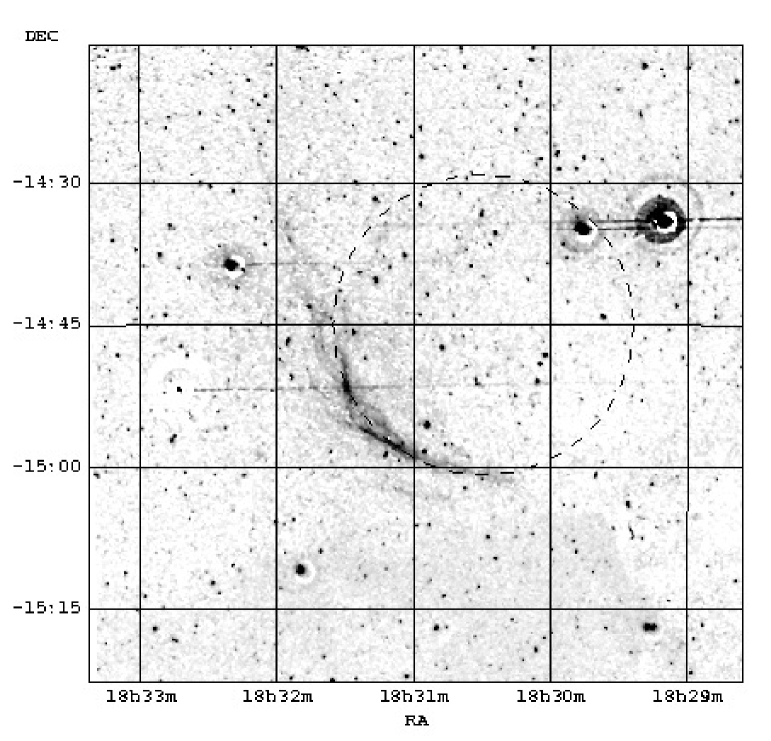
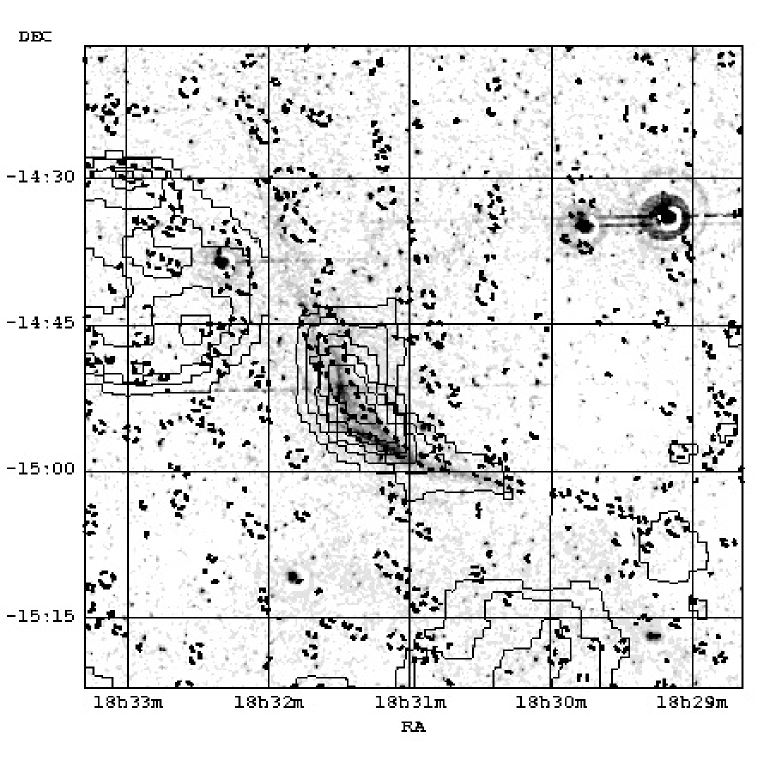
In contrast to the previous results, the image of the medium ionization O iii line shows clearly filamentary nature of the observed emission (Fig. 3). This bright filament extends for 24′ in the east, south–east, while no significant emission was found in other areas of the remnant. We do not detect O iii emission where the diffuse HN ii and S ii emission is detected. Table 1 lists also typical O iii fluxes measured in different parts of the filament. The latter, matches very well with the radio maps of G 17.4–2.3 at 1400 MHz and 4850 MHz, suggesting their association (Fig. 4). The correlation shows that the filament is located close to the outer edge of the radio contours but the low resolution of the radio images does not help us to determine the actual position of the filament with respect to the shock front. The geometry of the O iii filament allows us to define a 26′ circle in diameter (dashed circle in Fig. 3) for the remnant, with its center at 18h30m23.3s, 14°45′25″. Note that the optical angular size is in very good agreement with the value of 24′ given in Green’s catalogue (Green 2001). However, a larger angular diameter cannot be excluded since X–ray emission has not been detected so far and the radio shell is incomplete.
4 The long–slit spectra from G 17.4–2.3
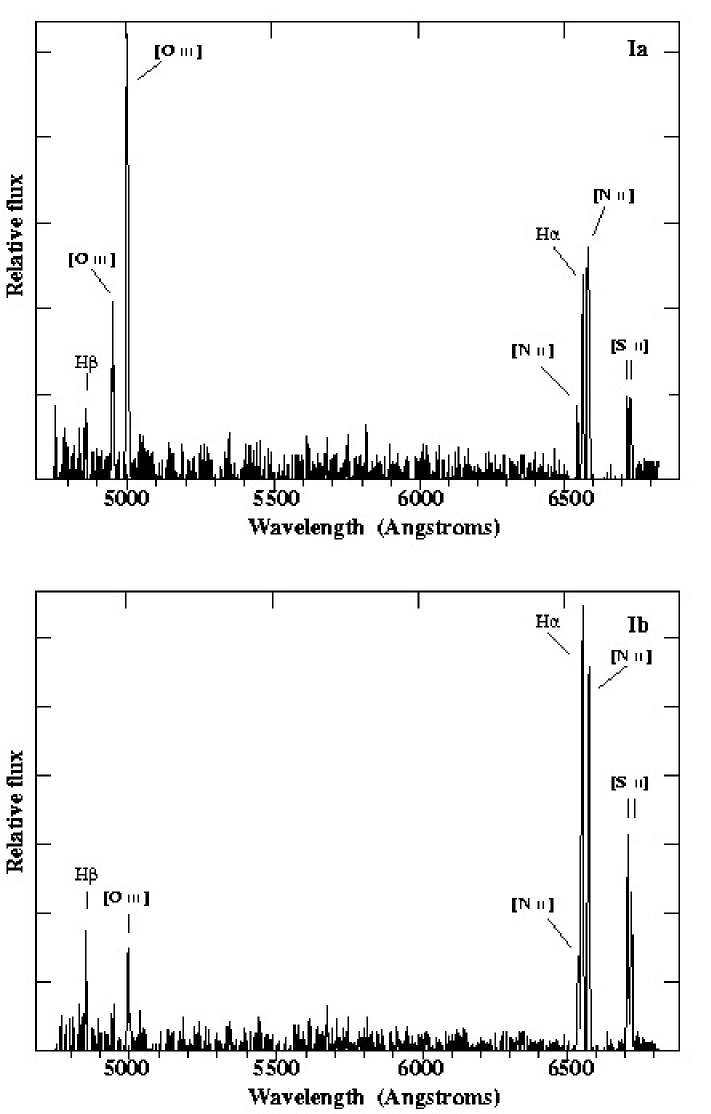
The low resolution spectra were taken on the relatively bright optical filament in the east part of the remnant (its exact position is given in Sect. 2.2). In Table 2, we present the relative line fluxes taken from two different apertures (Ia and Ib, Fig. 5) along the slit. In particular, apertures Ia and Ib have an offset of 9″.5 and 118″.5 north of the slit centre, respectively. The apertures Ia and Ib were selected because they are free of field stars in an otherwise crowded field. In addition, these apertures include sufficient line emission, especially in the blue part of the spectrum, to allow an accurate determination of the observed lines. The background extraction aperture was taken towards the north end of the slit. We utilized the flux calibrated images to identify the nature of this background emission used in the spectra. The S ii/H ratio of 0.2 measured in the images suggests an H ii origin for the background aperture emission. Assuming that its strength does not change appreciably at the Ia and Ib positions we performed the background subtraction to identify the SNR emission. The signal to noise ratios presented in Table 2 do not include calibration errors, which are less than 10%. Both extracted apertures show clearly that the observed optical emission originates shock heated gas, since the S ii/H 0.7. The S ii ratio of 1.2–1.4 indicates low electron densities (Osterbrock 1989).
The very strong O iii emission detected in aperture Ia suggests a shock velocity greater than 100 km s-1 (Cox & Raymond 1985), while the sulfur lines ratio indicate an electron density 240 cm-3 (Osterbrock 1989). However, taking into account the statistical errors on the sulfur lines, electron densities up to 400 cm-3 are compatible with our measurements. The shock velocity implies by the Ib spectrum could be less but still around 100 km s-1, while the electron density is even lower than in Ia (less than 120 cm-3).
5 Discussion
The supernova remnant G 17.4–2.3 shows up as an incomplete shell in the radio bound without any X–ray emission detected so far. The low ionization images generally show diffuse emission in the south and south–east areas of the remnant. In contrast, a filamentary structure has been discovered in the medium ionization O iii line in the east, south–east region which is very well correlated with the radio emission at 1400 and 4850 MHz and could define the remnant’s outer edge. This correlation indicates that the observed emission is associated to G 17.4–2.3. Both the calibrated images and the long–slit spectra suggest that the detected emission results from shock heated gas since the S ii/H ratio exceeds the empirical SNR criterion value of 0.4–0.5. Note that the H ii region found in the low ionization images shows a S ii/H ratio of 0.2. The eastern filament lies very close to this H ii region. The morphological differences between the low and medium ionization lines provide evidence for significant inhomogeneities and density variations in the ambient medium. Hester et al. (1987) suggested that the presence of such inhomogeneities and density variations would mainly affect the recombination zone where the low ionization lines are produced and it could also explain the O iii/H ratio variations seen in the long–slit spectra.
| Ia | Ib | |
| Line (Å) | Fa,b | Fa,b |
| 4861 H | 22 (3)c | 15 (6) |
| 4959 [OIII] | 70 (9) | 4 (2) |
| 5007 [OIII] | 221 (28) | 23 (9) |
| 6548 N ii | 39 (13) | 21 (16) |
| 6563 H | 100 (30) | 100 (75) |
| 6584 N ii | 142 (44) | 75 (57) |
| 6716 S ii | 44 (15) | 41 (34) |
| 6731 S ii | 38 (13) | 30 (25) |
| Absolute H fluxd | 7.9 | 19 |
| H/H | 4.5 (3) | 6.7 (6) |
| S ii/H | 0.82 (17) | 0.71 (36) |
| F(6716)/F(6731) | 1.2 (10) | 1.4 (20) |
a Uncorrected for interstellar extinction
b Listed fluxes are a signal to noise weighted average of the individual fluxes
c Numbers in parentheses represent the signal to noise ratio of the quoted fluxes
d In units of erg s-1 cm-2 arcsec-2
All fluxes normalized to F(H)=100
An interstellar extinction c at positions Ia and Ib (see Table 2), of 0.62 ( 0.33) and 1.10 ( 0.17) or an AV of 1.27 ( 0.67) and 2.26 ( 0.35) were measured, respectively. We have also determined the electron density measuring the density sensitive line ratio of S ii. The densities we measure are below 400 cm-3. Assuming that the temperature is close to 104 K, it is possible to estimate basic SNR parameters. The remnant under investigation is one of the least studied remnants and thus, the current stage of its evolution is unknown. The possibilities that the remnant is still in the adiabatic phase or in the radiative phase of its evolution cannot be excluded and will be examined in the following. The preshock cloud density nc can be measured by using the relationship (Dopita 1979)
| (1) |
where is the electron density derived from the sulfur line ratio and Vs is the shock velocity into the clouds in units of 100 km s-1. Furthermore, the blast wave energy can be expressed in terms of the cloud parameters by using the equation given by McKee & Cowie (mck75 (1975))
| (2) |
The factor is approximately equal to 1 at the blast wave shock, is the explosion energy in units of 1051 erg and rs the radius of the remnant in pc. By using the upper limit on the electron density of 400 cm-3, which was derived from our spectra, we obtain from Eq. (1) that . Then Eq. (2) becomes , where the distance to the remnant in units of 1 kpc.
An estimated value of N cm-2 is given by Dickey & Lockman (1990) for the column density in the direction of G 17.4–2.3. Considering that (Ryter et al. 1975)
| (3) |
where A (Kaler 1976), we obtain an NH of and for the two c values calculated from our spectra, respectively. A column density of was measured towards an X–ray binary system, located 1.2° east of G 17.4–2.3 at a distance of 3.1 kpc (Ribó et al. 1999). Since, there are no other measurements of the interstellar density n0, values of 0.1 and 1.0 will be examined. Following the result of Eq. (2) and assuming the typical value of 1 for the supernova explosion energy (E51), we find that the remnant may lie at distances greater than 2.3 kpc. Then, the lower interstellar density of 0.1 cm-3 suggests that the column density is greater than , while for n it becomes greater than . Combining the previous results and assuming that the column density is found in the range of , then the lower interstellar density seems to be more probable.
Using the results of Cioffi et al. (1988) and the above range of parameters for n0 of 0.1 and 1 cm-3, the pressure driven snowplow (PDS) radii are calculated as 38 and 14 pc, respectively. The radii, when compared with the estimated SNR radius of 17 pc may suggest that the PDS phase has not begun yet. The derived velocities of the main shock front at the beginning of this stage are 300–400 km s-1. Their comparison with the estimated shock velocities into the interstellar clouds result in a density contrast of 10 between the ambient medium and the interstellar clouds”. However, since neither the distance nor the interstellar medium density are accurately known, we cannot confidently determine the current stage of evolution of G 17.4–2.3.
6 Conclusions
The faint supernova remnant G 17.4–2.3 was observed for the first time in major optical emission lines. The images show filamentary and diffuse emission structures. The bright O iii filament is very well correlated with the remnant’s radio emission at 1400 and 4850 MHz suggesting their association. The flux calibrated images and the long–slit spectra indicate that the emission arises from shock heated gas. The observed optical filamentary structure provides some evidence for significant inhomogeneities in the ambient medium, implying that the main blast wave propagates into an inhomogeneous medium.
Acknowledgements.
The authors would like to thank the referee for his comments and suggestions which helped to clarify, and enhance, the scope of this paper. Skinakas Observatory is a collaborative project of the University of Crete, the Foundation for Research and Technology-Hellas and the Max-Planck-Institut für Extraterrestrische Physik. This research has made use of data obtained through the High Energy Astrophysics Science Archive Research Center Online Service, provided by the NASA/Goddard Space Flight Center.
References
- (1) Case G. L., and Bhattacharya D. 1998, ApJ 504, 761
- (2) Cioffi D. F., McKee C. F. and Bertschinger E., 1988, ApJ, 334, 252
- (3) Condon J. J., Broderick J. J., Seielstad G. A., Douglas K. and Gregory P. C., 1994, AJ, 107, 1829
- (4) Condon J. J., Cotton W. D., Greisen E. W., Yin Q. F., Perley R. A., Taylor G. B. and Broderick J. J., 1998, AJ, 115, 1693
- (5) Cox D. P. and Raymond J. C., 1985, ApJ, 298, 651
- (6) Dickey J. M. and Lockman F. J., 1990, ARAA, 28, 215
- (7) Dopita M. A., 1979, ApJS, 40, 455
- (8) Fesen R. A., Blair W. P. and Kirshner R. P., 1985, ApJ, 292, 29
- (9) Fesen R. A. and Hurford A. P., 1995, AJ, 110, 747
- (10) Fesen R. A., Winkler P. F., Rathore Y., Downes R. A., Wallace D. and Tweedy R. W., 1997, AJ, 113, 767
- (11) Green D. A., Frail D. A., Goss W. M. and Otrupcek R., 1997, AJ, 114, 2058
- (12) Green D. A., 2001, A Catalog of Galactic Supernov a Remnants (2001 version), Mullard Radio Astronomy Observatory Cambridge
- (13) Hester J. J., 1987, ApJ, 314, 187
- (14) Hilton J., White G. J., Cronin N. J. and Rainey R., 1986, A&A, 154, 274
- (15) Hamuy M., Walker A. R., Suntzeff N. B., Gigoux P., Heathcote S. R. & Phillips M. M., 1992, PASP, 104, 533
- (16) Hamuy M., Suntzeff N. B., Heathcote S. R., Walker A. R., Gigoux P. & Phillips M. M., 1994, PASP, 106, 566
- (17) Kaler J. B., 1976, ApJS, 31, 517
- (18) Lasker B. M., Russel J. N. & Jenkner H., 1999, in the HST Guide Star Catalog, version 1.1-ACT, The Association of Universities for Research in Astronomy, Inc
- (19) Lynds B. T., 1965, ApJS, 12, 163
- (20) Mavromatakis, F., Papamastorakis, J., Paleologou, E. V. and Ventura J, 2000, A&A 353, 371
- (21) Mavromatakis, F., Papamastorakis, J., Ventura, J., Becker, W., Paleologou, E. V. and Schaudel, 2001, A&A 370, 265
- (22) Mavromatakis, F., Boumis P. and Paleologou, E. V., 2002, A&A, accepted
- (23) McKee C. F. and Cowie L. L., 1975, ApJ, 195, 715
- (24) Osterbrock D. E., 1989, Astrophysics of gaseous nebulae, eds. W. H. Freeman & Company
- (25) Raymond J. C., 1979, ApJS, 39, 1
- (26) Reich W., Fürst E., Reich P. and Junkes N., 1988, in IAU Colloq. 101, Supernova Remnants and the Interstellar Medium, eds. Roger R. S. and Landecker T. L. (Cambridge Univ. Press), 293
- (27) Reich W., Fürst E., Reich P. and Reif K., 1990, A&AS, 85, 633
- (28) Ribó M., Reig P., Martí and Paredes J. M. 1999, A&A, 347, 518
- (29) Ryter C., Cesarsky C. J. and Audouze J., 1975, ApJ, 198, 103
- (30) Seward F. D., Dame T. M., Fesen R. A. and Aschenbach B., 1995, ApJ, 449, 681
- (31) Shull J. M. and McKee C. F., 1979, ApJ, 227, 131
- (32) Smith R. C., Kirshner R. P., Blair W. P., Long K. S. and Winkler P. F., 1993, ApJ, 407, 564