11email: sgtl@astro.soton.ac.uk 22institutetext: NASA Goddard Space Flight Center, Greenbelt, MD 20771, USA
33institutetext: Universities Space Research Association
44institutetext: Department of Astronomy, University of Maryland, College Park, MD 20742
Discovery of a new Transient X-Ray Pulsar in the Small Magellanic Cloud
Systematic Rossi X-Ray Timing Explorer (RXTE) observations of the Small Magellanic Cloud (SMC) have revealed a previously unknown transient X-ray pulsar with a pulse period of 95s. The 95s pulsar, provisionally designated XTE SMC95, was detected in three Proportional Counter Array (PCA) observations during an outburst spanning 4 weeks in March/April 1999. The pulse profile is double peaked reaching a pulse fraction of 0.8. The X-ray spectrum is well represented by an absorbed power-law with a photon index of 1.4 and mean unabsorbed flux of 8.95 ergs cm-2 s-1 (3 - 25 keV). The source is proposed as a Be/neutron star system on the basis of its pulsations, transient nature and characteristically hard X-ray spectrum. The 2-10 keV X-ray luminosity implied by our observations is 21037ergs s-1 which is consistent with that of normal outbursts seen in Galactic systems. This discovery adds to the emerging picture of the SMC as containing an extremely dense population of transient high mass X-ray binaries.
Key Words.:
X-Rays – Pulsars – Binaries1 Introduction
Observations of the SMC by RXTE, ASCA & SAX have detected an increasing number of new transient X-ray pulsars over the last few years, e.g. Haberl & Sasaki (hs00 (2000)), Yokogawa et al (Yokogawa00 (2000)). With no sign of a decline in this trend, the picture emerging from this flurry of new identifications and rediscoveries of sources seen by Einstein and ROSAT is that the SMC contains a large population of X-ray binary systems, of which only a small fraction are active at any one time. The SMC provides the closest available approximation to a luminosity-limited sample of X-ray pulsars due to its low extinction and small size. The depth of the SMC is small relative to its distance from us, placing all of the pulsars at effectively the same distance. RXTE’s proportional counter array is well suited to studying this population since its field of view, sensitivity and timing resolution allow simultaneous monitoring of all sources in a significant fraction of the SMC.
Observational data from across the spectrum has provided a coherent classification of X-ray binaries, both in the Galaxy and Magellanic clouds. The principal distinction is between high and low mass stellar counterparts, forming a distinction that is also generally coincident with that between sources exhibiting coherent X-ray pulsations, and those that do not. In high mass X-ray binary (HMXB) systems the optical emission is dominated by the star, while in the latter low mass (LMXB) case, emission from an accretion disk around the compact object dominates. The HMXBs fall into only two subclasses on the basis of their optical classification, those with an OB supergiant (SG) optical counterpart and those involving a Be emission-line star, which account for the majority of HMXBs. These two subgroups broadly coincide with two distinct modes of X-ray behaviour, persistent and transient sources.
Systems containing a supergiant are persistent sources of X-rays which are usually modulated by eclipses due to the short orbital period and correspondingly small size of the system. In very short period systems the primary overfills its Roche-lobe and the overflowing matter is forced by its high angular momentum into a stable accretion disk around the neutron star. In more widely separated systems, persistent emission arises by accretion from a roughly spherically symmetric stellar wind. Pulse-timing measurements suggest that long-term stable accretion disks do not form in these systems, although short-lived torque-reversals observed in many systems (Bildsten et al Bildsten97 (1997)) imply the formation of transient accretion disks.
Transient X-ray sources account for the majority of HMXBs. The neutron star’s (NS) optical companion is generally a Be III-V star exhibiting a strong infrared flux excess. Long term monitoring of these systems has resulted in a ‘standard model’ in which the Be star, rotating close to its breakup speed, is surrounded by a dense equatorial disk of cool material. This disk is prone to successive phases of building and ejection on timescales of 1-3 years (Coe Coe00a (2000)). The neutron star, in a wide (few 10s - 100s of solar radii) eccentric orbit around the Be star, periodically intercepts the ejected material leading to the formation of an accretion disk and X-ray emission. This general model explains the regular X-ray outbursts of Be/NS systems, which are modulated at the orbital period and normally occur close to periastron passage of the neutron star. The situation is complicated by changes in the circumstellar disk which alter the density of material being encountered by the neutron star. This leads to long epochs (several orbital periods) of heightened X-ray activity often accompanied by strong torque reversals and prolonged periods of spin-up. Over the long-term, such activity leads ultimately to a dynamic equilibrium between the orbital and neutron star spin periods since the pulsar experiences negative as well as positive torques. The equilibrium is manifested observationally in the PPulse vs POrbit diagram (Corbet et al Corbet99 (1999)). See also Corbet (Corbet86 (1986)), Stella et al (Stella86 (1986)) and Bildsten et al (Bildsten97 (1997)) for detailed explanations.
With the addition of recent discoveries there are now 25 X-ray pulsars known in the SMC. Of these X-ray sources, the majority have been identified as belonging to Be systems rather than supergiant systems (Haberl & Sasaki hs00 (2000)). Comparing these figures to the population in the Galaxy in which about 70 HMXBs are known, 31 identified with Be optical companions, the SMC emerges as containing a particularly dense population of Be X-ray binaries. Furthermore of the 14 supernova remnants (SNR) identified in the SMC none is Crab-like (Yokogawa et al Yokogawa00 (2000)). Since Crab-like SNR are believed to form from the explosion of a single massive star it is likely that the evolutionary history of the SMC has resulted in a large ratio of massive binary stars to isolated massive stars. When the comparison is scaled by relative masses of the SMC and Galaxy it is clear that the population density of HMXBs in the SMC is higher even than the Galaxy’s most populous regions. Many authors e.g. Stavely-Smith et al (Stavelysmith97 (1997)) and Popov et al (Popov98 (1998)) have proposed an evolutionary scenario for the SMC in which an extremely active epoch of star formation occurred relatively recently (within 5 Myr), leading to the large proportion of young, massive stars. In support of this theory are 4 key observations: (1) Large number of supernova remnants approximately 5 Myr old; (2) The large number of HMXBs; (3) Apparent absence of low mass systems which would represent an older stellar population. (These still remain elusive despite the current generation of satellites’ ability to detect them if they are similar to galactic LMXBs); (4) The ratio of Be/B type stars in the SMC is 0.39 (Maeder et al mgm99 (1999)) compared to 0.16 in the Galaxy, implying a younger population.
2 The RXTE Observations
The RXTE Proportional Counter Array (PCA) (Jahoda et al Jahoda96 (1996)) consists of 5 collimated, Xenon filled, proportional counter units (PCU), each with a collecting area of 1300 cm2. The field of view of the PCA is approximately 2°FWZI with a triangular collimator response as a function of off-axis viewing angle. The PCA has 3 detector-anode layers, this arrangement greatly increases the signal/noise by physically separating the detection of low, medium and high energy X-rays. In certain data modes (Good Xenon and Standard 2) this separation is maintained in the telemetry, allowing data from each layer and PCU to be analysed independently. The highest timing and spectral resolution are obtained in Good Xenon mode, in which the energy and arrival time of of every detector event is registered with 1s timing accuracy and 256 channel energy resolution. Standard 2 mode provides time-binned data with 16s resolution and 129 energy channels. Both of these data modes were used in our analysis, as explained in Section 3.
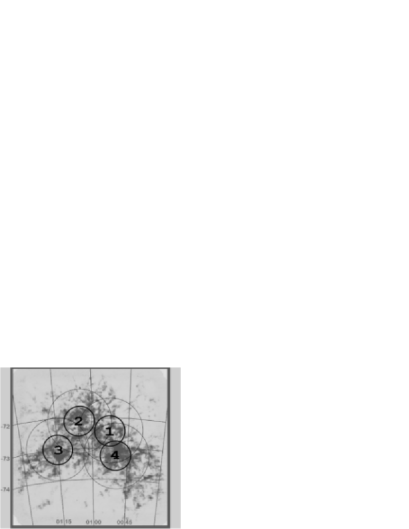
RXTE observations were obtained in the course of our regular pulsar search program of the SMC. Approximately every week, 3 ksec observations were made centred on one of 4 partially overlapping positions (See Table 1 and Figure 1) in the ‘bar’ and ‘wing’ regions of the SMC where young objects are expected to be found (Kahabka & Pietsch 1996) This program began in January 1999 and has allowed detailed monitoring of the long-term behaviour of pulsars in the vicinity of SMC X-3 (Lochner et al Lochner96 (1999)). At the time of the observations presented here, all four pointing positions were being routinely observed, with about three quarters of the time concentrated on the region around SMC X-3 (position 1). However since early 2000 our strategy has changed to allow us to observe the single position centred on SMC X-3 with much greater regularity, since most of the pulsars seen during this program and by ASCA (Haberl & Sasaki hs00 (2000)) have been visible in this position.
Two observations of position 1 taken seven days apart during March 1999 revealed the existence of a transient X-ray pulsar (XTE SMC95) whose 95s pulse period and pulse profile we were able to determine. The next position 1 observation two weeks later revealed weak pulsations, after which the source faded from view.
Although individual pointed detections of a transient source are unable to constrain its position, the only impact of this positional uncertainty on PCA data analysis is uncertainty in absolute flux determination. Given the high timing resolution and S/N typically obtainable for SMC pulsars, this limitation is unimportant in the identification of new sources and the study of pulse profiles and pulse-frequency evolution, which are the primary aims of this program.
3 Data Reduction
Good Xenon mode data from the PCA were used to construct lightcurves and spectra. 4 PCUs were active during the observations presented here. In order to maximise signal-to-noise ratio, only events from the top anode layer of each active proportional counter unit (PCU) were included and the analysis was restricted to the 3-25 keV energy range. The PCA is sensitive to X-rays between 2-60 keV, although for faint sources its spectral response seems unreliable below 3 keV. The X-ray flux from pulsars falls off rapidly above 10 keV.
Additional filtering criteria were applied to exclude data collected during periods of high background occurring shortly after SAA passage and short data segments coinciding with start and finish of pointing slews. Background subtraction was performed using the L7 PCA faint background models (gain epochs 3 and 4) provided by the RXTE Guest Observer Facility. These models use the Standard 2 mode PCA data to determine various parameters used in estimating the background count-rates and spectra in the specific PCU and anode-layer configuration being used for each observation. Background corrected lightcurves were then constructed at 100 ms timing resolution, with bin times corrected to the solar-system barycentre and the count-rates normalised to counts PCU-1s-1. A detailed description of the L7 background model is given by Edelson & Nandra (EN99 (1999)).
4 Timing Analysis
In order to search for pulsars in the datasets, we calculated power spectra covering a period range 0.1-1000 seconds at a resolution of 0.1 mHz. Coherent pulsations were initially detected in observation 3 and power spectra showing the positive detection of XTE SMC95 are shown in Figures 2 & 3. These power spectra show several harmonics of the fundamental spin frequency, whose relative strengths changed between the two observations. The fundamental and harmonic frequencies were weighted by their spectral power to obtain a best fit to the true period. The uncertainty in the period was calculated by propagating the error (FFT resolution) from each harmonic. Two harmonics were used to establish the period in observation 3, Three in observation 4 (see Figures 2 & 3).
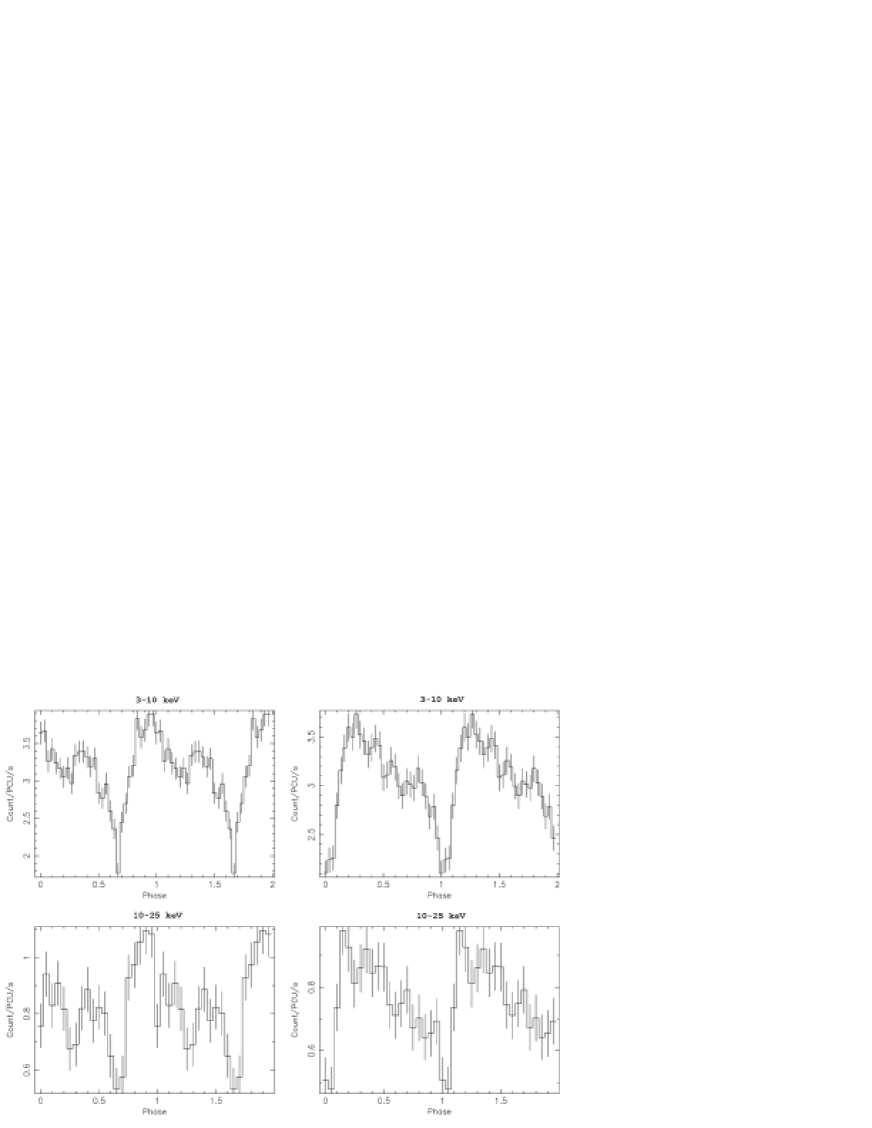
After determining the pulse period and associated observational errors, average pulse profiles were created for each of the observations. The profiles are shown in Figure 4, while key observational parameters derived from them are given in Table 2. The mean fluxes have formal uncertainties of 0.03 counts PCU-1s-1 before taking into account contribution from interfering sources and uncertainties in the background model. Using observations for our monitoring program in which no pulsations were detected, an estimate was made of the contribution from unpulsed X-ray sources in the field, such as supernova remnants. The mean background corrected 3-10 keV flux averaged over it 3 lowest values for observations of Position 1 is 0.980.05 Count PCU-1s-1 with an excess variance in the count rates of 13% over the expected Poisson level. Thus the true 3-10 keV pulse fraction in observation 3 (See Figure 4) was 0.8.
A weak 95s pulsation was detected in observation 6, however the flux was dominated by 91s pulsations from the nearby pulsar AX J0051-722. Due to the closeness of the two pulse periods, direct measurement of the pulse amplitude of SMC95 was not possible. Instead simulated data sets were created using the pulse profile obtained in observation 4 as a template and varying its pulse amplitude. These simulated data were used to estimate the pulse amplitude required to recreate the 95s peak seen in the observation 6 PDS. The resulting upper limit (See Table 2) is approximately one third the amplitude seen in obs.4 and is found to be nearly 10 times the amplitude required if the modulation were sinusoidal, a possibility supported by the lack of harmonics in the PDS. Considering the mean count-rate in the observations, it is clear that most of the flux in observation 6 was due to AXJ0051-722. Thus the brightness of SMC95 is constrained to be in the lower end of the range determined from the timing alone.
5 Spectrum analysis
PCA spectra were obtained from the first two observations containing XTE SMC95, the spectra are well represented by an absorbed power-law typical of Be/X-ray binary pulsars (e.g. White, Swank & Holt White83 (1983)). The fitted model parameters are given in Table 3 for the two observations and are in agreement to within errors. Figure 5 shows the spectrum from observation 4, along with the fitted model and residuals. Uncertainties in the fitted parameters represent the limits of the 90 % confidence interval. The unabsorbed source fluxes were obtained from the fitted spectral models. Uncertainties in the absolute flux are dominated by the unknown source position and hence collimator response. Since both observations were made with the same pointing, the uncertainty is systematic.
6 Source Location
PCA slew data were used to constrain the source position. The PCA detectors are often on and accumulating data as the spacecraft is manoeuvered on-source during the start of an observation. As the source moves through the collimator field of view, it samples different values of the collimator response function, which modulates the detected count rate. Given a trial position and intensity for the source, a model light curve can be constructed using a tabulated response function, and compared to the observed light curve. The position and intensity are then varied iteratively using least squares fitting until the best-fit parameters are obtained. Ideally, two scans completely over the source are needed, in orthogonal directions, to constrain the source position with the highest precision. When, as in this case, the scans are not complete, and not at right angles, the error box will be larger and asymmetric.
Light curves for XTE SMC95 were extracted from the 16-second Standard2 data in the 2–10 keV band (PCA top layer only) for observations 3 and 4. The light curves included approximately 200 seconds of slewing and on-source time each. The model included a term for the PCA background, which was fixed at the value determined from the PCABACKEST model for faint sources. The intrinsic variability of the pulsar can be confused with variations of source position. To compensate for this, the light curve error bars were increased proportionately by 30% (this number was also scaled according to the collimator response at each time sample). The value of 30% was determined by fitting a constant intensity during the pointed portion of the observation, and forcing , and represents the effective fractional r.m.s. variation of the pulsar on 16 second timescales.
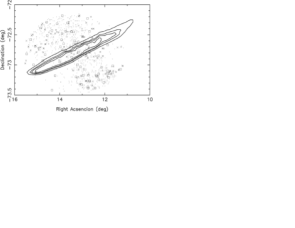
The best fitting position was , (J2000), with a reduced chi-square value of 1.02. The position uncertainty is a thin strip shown in Figure 6. Confidence contours were estimated by taking , which formally represent confidence levels of , 99%, , and 99.99% respectively, for two parameters. However, because the variability of the pulsar is non-statistical and non-trivial to model, we favor assigning the contour as the smallest reasonable error box. The semi-minor and semi-major axes of the error box are 5 arcmin and 41 arcmin respectively. Since the source was not detected in PCA observations at pointing positions number 2 and 4, which are east and south of pointing position number 1, respectively, it is more likely that the source is located to the northwest of the best-fit position.
The true intensity of the source depends on its position within the PCA collimator response function. At the best-fit position, the collimator response is %, implying that the source is brighter than implied by the counting rate observed by the PCA at pointing position number 1. Given the full error box described above, the collimator response could potentially be in the range of 10%–75%. If the source is northwest of the best-fit position, the collimator response is in a more restricted range of 60%–75%, and then it is likely that the observed rate is close to the actual source flux , within a factor of .
7 Duration of the Outburst
As Table 1 shows, XTE SMC95 was not detected in observations made before and after those presented here. The closest before and after observations were made at pointing positions 2 & 3 respectively, one week either side of the detected outburst. As Figure 1 shows, these observations provide no useful information due to their limited overlap, other than possibly constraining XTE SMC95 to lie towards the west in the position 1 field of view. The closest position 1 observations occurred within two weeks of the outburst. Analysis of power spectra obtained in these bracketing observations allow us to place upper limits on the X-ray flux during apparent quiescence. From this analysis we find that XTE SMC95 pulse amplitude was below our approximate 3 detection threshold of 0.25 counts PCU-1s-1 in observations 1 and 7, where this figure is directly comparable with the measured fluxes in observations 3 & 4.
8 Discussion
Most galactic Be/X-ray binaries increase in luminosity by a factor of 100 during normal outburst (Negueruela Negueruela98 (1998)) reaching luminosities around 1037erg s-1. Taking the distance to the SMC as 63 kpc (Groenewegen et al Groenewegen00 (2000)), the fluxes given in Table 3 imply a 2-10 keV luminosity for XTE SMC95 of at least 21037 erg s-1. Thus during this outburst the X-ray luminosity of XTE SMC95 was comparable to that of Galactic Be/NS systems. The photon indices obtained from our spectral fits are slightly steeper than those normally seen in Galactic Be/NS HMXBs, values 1.0 being typical in the 10-20 keV range (White et al White83 (1983)). Softer (steeper) spectra have been associated with less luminous sources based on studies in the Galaxy (White et al White83 (1983)). Comparing our results (Table 3) to the recent outburst of SMC X-2 which was both more luminous and had a harder spectrum: luminosity 1038ergs s-1, spectral index 0.7-1.0 (Corbet et al Corbet01 (2001)) this trend looks likely to hold in the SMC.
XTE SMC95 exhibited varying structure in its pulse profile. Pulse profiles obtained in two separate energy bands 3-10 keV and 10-20 keV shown in Figure 4 indicate the pulse-shape changed between the two observations (3 & 4), with the second pulse peak weakening relative to the first, accompanied by a decrease in pulsed flux. The significant shift in relative strength of the first and second power spectrum harmonics between the two observations (see Figures 2 & 3) confirms that the profile change is real and not an artifact of an incorrect profile-folding period.
A small decrease in the pulse period was detected between the two observations of XTE SMC95 one week apart, implying a pulse period derivative (8.6 5.5) 10-7 s s-1. This change is attributed to an unknown combination of spin up and orbital motion depending on the inclination of the system.
For Be/NS systems with Ppulse around 95s, the Corbet diagram (Corbet Corbet86 (1986)) suggests likely orbital periods in the 50-100d range. XTE SMC95 was detected for three weeks, only a small fraction of its likely orbital period. Whether this outburst was related to orbital motion or long-term changes (disk-loss events) in a circumstellar disk may be determined by continued monitoring.
A search of the ROSAT source catalogue (Haberl et al hfp00 (2000)) reveals 4 sources within the 3 confidence region (See Figure 6). Of these sources, RX J0053.8-7252 is classified as a candidate X-ray binary and RX J0052.6-7247 a background AGN the other sources are a foreground star and a Supersoft X-ray source. A similar search for known Be stars was made in the same region. Searching the AzV (Azzopardi & Vigneau azv82 (1982)) & LIN (Lindsay lin (1961)) catalogues for spectral types: O8-B2, I-V, gave 7 stars within the 3 contour. This range of spectral types was chosen to match the known distribution for optical counterparts to HMXBs (Negueruela Negueruela98 (1998)). The AzV catalogue is 80% complete to limiting magnitude B=14.3, considering the distance to the SMC the sample is strongly biased toward early-type giants. Thus main sequence Be stars (Luminosity class IV-V) are likely to be under represented in the sample. The catalogue of H emission-line objects of Meyssonnier & Azzopardi (ma93 (1993)) lists 69 stars within the 3 contour. From the argument given above, the majority of these are likely to be O/Be stars.
Acknowledgements.
We thank the referee, W. Heindl for constructive comments. This research has made use of the SIMBAD database, operated at CDS, Strasbourg, France. SL is supported by a PPARC studentship.References
- (1) Azzopardi, M., Vigneau, J., A&AS, 50, 291
- (2) Bildsten, L., Chakrabarty, D., Chiu, J., Finger, M. H., Koh, T., Nelson, R. W., Prince, T. A., Rubin, B. C., Scott, D. M., Stollberg, M., Vaughan, B. A., Wilson, C. A., Wilson, R. B. 1997, ApJS, 114, No. 2
- (3) Buckley, D. A. H., Coe, M. J., Stevens, J. B., van der Heyden, K., Angelini, L., White, N., Giommi, P., 2001 MNRAS, 320, 281
- (4) Coe M. J., 2000, ASP Conference Series, Vol. 214, 656 ed. Smith, M. A., Henrichs, H. F., Fabregat, J.,
- (5) Coe, M. J., Buckley, D. A. H., Negueruela, I., Corbet, R. H. D., Reig, P., Haigh, N. J., 2000, HEAD 32.2302C
- (6) Corbet, R. H. D., 1986, MNRAS, 220, 1047
- (7) Corbet, R. H. D., Marshall, F. E., Peele, A. G., Takeshima, T., 1999, ApJ, 517, 956
- (8) Corbet, R. H. D., Marshall, F. E., Coe, M. J., Laycock, S., Handler, G., 2001 ApJ, 548, L41
- (9) Edelson, R., Nandra, K., 1999, ApJ, 514, 682
- (10) Finger, M. H., Wilson, R. B., Harmon, B. A., 1996, ApJ, 459, 288
- (11) Groenewegen, M. A. T., 2000, A&A, 363, 901
- (12) Haberl, F., Filipovic, Pietsch, Kahabka, 2000, A&AS, 141, 41
- (13) Haberl, F., Sasaki, M., 2000, A&A, 359, 573
- (14) Jahoda, K., Swank, J. H., Stark, M. J., Strohmeyer, T., Zhang, W., Morgan, E. H., 1996, Proc.SPIE, 2808, 59
- (15) Kahabka, P., Pietsch, W., 1996, A&A, 312, 919
- (16) Lindsay, E. M., 1961 Astron. J., 66, 169
- (17) Lochner, J. C., Whitlock,, L. A., Corbet, R. H. D., Marshall, F. E., 1996, A&AS, 194, 5218
- (18) Maeder, A., Grebel, E. K., & Mermilliod, J. C., 1999, A&A, 346, 456
- (19) Meyssonnier & Azzapardi, M., 1993 A&AS, 102, 451
- (20) Negueruela, I., 1998, A&A 338, 505
- (21) Popov, S. B., Lipunov, V. M., Prokhorov, M. E., Postnov, K. A., 1998, Astronomy Reports, 42, 29
- (22) Santangelo, A., Cusumano, G., dal Fiume, D., Israel, G. L., Stella, L., Orlandini, M., Parmar, A. N, 1998, A&A, 338, L59
- (23) Stanimirovic S., Staveley-Smith, L., Dickey, J. M., Sault, R. J., Snowden, S. L., 1999, MNRAS, 302, 417
- (24) Stavely-Smith, L., Sault, R. J., Hatzidimitriou, D., Kesteven, M. J., McConnell, D., 1997, MNRAS, 289, 225
- (25) Stella, L., White, N. E., & Rosner, R., 1986, ApJ, 308, 669
- (26) White, N. E, Swank, J. H., Holt, S. S., 1983, ApJ, 263, 277
- (27) Yokogawa, J., Imanishi, K., Tsujimoto, M., Nishiuchi, M., Koyama, K., Nagase, F., Corbet R. H. D., 2000, ApJS, 128, 491
| Obs. Date | Position | Duration /ks | Source |
|---|---|---|---|
| 1 25/2/99 | 1 | 2.20 | - |
| 2 4/3/99 | 2 | 3.38 | - |
| 3 11/3/99 | 1 | 3.13 | XTE SMC95 |
| 4 18/3/99 | 1 | 3.49 | XTE SMC95 |
| 5 26/3/99 | 3 | 3.76 | - |
| 6 1/4/99 | 1 | 3.78 | XTE SMC95 |
| 7 9/4/99 | 1 | 4.49 | - |
| 8 22/4/99 | 1 | 2.98 | - |
Position 1: RA=13471; Dec=-72445, Position 2: RA=1625; Dec=-72106, Position 3: RA=1875; Dec=-73091, Position 4: RA=12686; Dec=-73268 (Equinox 2000.0)
| Obs. | Pulse period | Pulse amplitude† | Mean flux† |
|---|---|---|---|
| number | seconds | Ct PCU-1s-1 | Ct PCU-1s-1 |
| 3 | 95.490.05 | 2.720.26 | 4.34 |
| 4 | 95.030.03 | 2.270.25 | 4.08 |
| 6 | 95.00.1 | 0.2-1.0∗ | 3.79 |
†Background corrected 3-25 keV. See Section 4
| Obs. | flux† | L | |||
|---|---|---|---|---|---|
| 3 | 1.82 0.89 | 1.41 0.23 | 8.95 | 2.14 | 0.86 |
| 4 | 2.66 0.89 | 1.50 0.07 | 8.43 | 2.15 | 0.89 |
†total unabsorbed model flux 10-11erg cm-2s-1 (3-25 keV)
2-10 keV model luminosity 1037erg s-1 at 63 kpc
N.B. These are upper limits with a factor 5 uncertainty in flux & LX due to unknown collimator response. (No
corrections applied)
for 58 degrees of freedom.