On the nature of the Extremely Red Galaxies
Abstract
We present a method based on two broad-band colors to investigate the nature of the Extremely Red Objects (EROs), i.e., the galaxies selected to have very red optical-to-infrared colors. Dusty starburst and old ellipticals at redshifts between 1 and 2 appear to occupy two different regions of the J-K vs. I-K color diagram, allowing for an easy classification. This diagnostic was applied to a complete sample of 57 EROs: the two populations are found to be present in the sample in similar abundances. The cosmic star formation density in the dusty starbursts is found to be of the order of that in the Lyman-Break Galaxies (LBG).
CAISMI - CNR, Largo E. fermi 5, 50125 Firenze, Italia
1. Introduction
EROs proved to be a very difficult population to study. They are too faint both in the optical and in the near-IR to obtain large number of spectra with enough signal-to-noise ratio to allow for a secure classification. Even the most recent deep spectroscopic surveys (e.g., Cimatti et al, 2002) can only reach K19.2 and even in this case the number of unidentified objects is similar to the number of objects of each class. We have therefore searched for a diagnostics that could be applied to large sample of EROs without large amounts of telescope time. We noticed (Pozzetti & Mannucci, 2000) that the optical and near-IR Spectral Energy Distribution (SED) of a dusty object is expected to be swallower than that of an old elliptical because in the latter case the red color is given by the sharp 4000Å break (see fig. 1). As a consequence, dusty starburst with z2 are expected to have redder J-K colors than old ellipticals. The positions of the two populations in the J-K vs. I-K (or R-K) color diagram were estimated by a large number of synthetic galaxy models. The expected difference in the J-K color is about 0.3 mag, even if for some models the difference reduces to zero. The derived diagnostic correctly reproduces all the objects with known nature (see fig. 2). A good photometry is needed to obtain reliable results as no empty region is present between the two populations and the relative distance is not large.

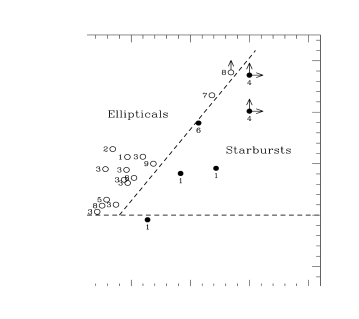
We have applied this diagnostic to a complete sample of 57 EROs selected to have K20.3 and R-K5.3 by Thompson et al (2000) in the field of a radio galaxy (see Mannucci et al., 2001, for details). The color-color diagram is shown in the left panel of fig. 3, together with the separation line. According to the models and the observations of cold dwarfs, the objects with J-K1.4 were classified as stars. Among the other objects, 21 (37% of the sample) can be classified as starburst, the same number as ellipticals, and 10 objects (17% of the sample) remain unclassified. Several objects fall near the separation line so that their classification can be affected by the uncertainties on the colours. The significance of the classification was estimated by the ratio of the distance of each point from the classification line divided by the radius of the error ellipse in the direction perpendicular to the line. These results are shown in the right panel of fig. 3. Eleven ellipticals and 2 starbursts have a distance from the line below 1 sigma, therefore their classification should be considered weak.
We have checked the effect of the uncertainties on the relative number of objects of the two populations. While the statistical errors are unlikely to affect the result very much, the systematic effect on the colors and on the position of the line can effect the ratio between ellipticals and dusty galaxies of about 35%.

Right panel: significance of the classification as elliptical or starburst. On the x axis is plotted the ratio between the distance of each point from the separation line and the radius of the error ellipse in the direction perpendicular to the line. The dotted lines show the 1 limit of the classification.
We have studied the morphology of the objects to check the
consistency of the classification. A correlation was found between the K-band
morphology and the classification: as expected, the objects identified as
ellipticals have regular morphology and small angular dimensions, while the
starburst objects appear to be more extended and often elongated.
We have derived a crude estimate of the contribution of the detected starburst galaxies to the cosmic star formation density. The cosmic variance and uncertainties on the Star Formation Rate (SFR) of each galaxies and on the cosmic volume actually sampled make the resulting value vary uncertain. Nevertheless a value of 0.03 M⊙/yr was derived for a cosmology with H0=70, and . This is of the same order of the value derived from the LBG at higher redshift. This is an indication that the ERO technique is not only a good method to detect high-redshift ellipticals, but also a promising way to select a population of starburst galaxies containing a significant fraction of star formation and having intermediate properties between the LBG and the SCUBA objects (see fig. 4). It is also interesting to note that the results on the relative number of objects and cosmic star formation history of this work are in a very good agreement with those of the following K20 spectroscopic survey (Cimatti et al., 2002) even if the techniques are radically different.

References
Cimatti, A., et al., 2002, A&A, in press (astro-ph/0111527).
Mannucci, F., et al., 2001, MNRAS, in press (astro-ph/0110648)
Pozzetti, L., & Mannucci, F., 2000, MNRAS, 317, L17