Mid-IR Observation of Mass Loss in Elliptical Galaxies
Abstract
Early-type galaxies exhibit thermal and molecular resonance emission from dust that is shed and heated through stellar mass loss as a subset of the population moves through the AGB phase of evolution. Because this emission can give direct insight into stellar evolution in addition to galactic stellar mass loss and ISM injection rates, we conducted a program to search for this signature emission with CAM on ISO. We obtained 6-15m imaging observations in six narrow bands for nine elliptical galaxies; every galaxy is detected in every band. For wavelengths shorter than 9m, the spectra are well matched by a blackbody, originating from the K and M stars that dominate the integrated light of elliptical galaxies. However, at wavelengths between 9m and 15m, the galaxies display excess emission relative to the stellar photospheric radiation. Additional data taken with the fine resolution circular variable filter on one source clearly shows broad emission from 9m to 15m, peaking around 10m. This result is consistent with the known, broad silicate feature at 9.7m, originating in the circumstellar envelopes of AGB stars. This emission is compared with studies of Galactic and LMC AGB stars to derive cumulative mass loss rates. In general, these mass loss rates agree with the expected 0.8 M value predicted by stellar evolutionary models. Both the photospheric and circumstellar envelope emission follow a de Vaucouleurs’ R1/4 law, supporting the conclusion that the mid-infrared excess emission originates in the stellar component of the galaxies and acts as a tracer of AGB mass loss and mass injection into the ISM.
1 Introduction
Elliptical galaxies are comprised of old stellar populations in which low mass stars evolve off the main sequence, eventually becoming white dwarfs. These post-main sequence stars experience an asymptotic giant branch (AGB) phase where up to 0.3 M☉ is shed into the Interstellar Medium (ISM). As this mass is ejected from the star, dust condenses out of the gas in a cool stellar wind and forms an envelope at a few to ten stellar radii. (For a review of AGB stars and circumstellar envelopes see Habing (1996)). Dust acts as an agent to this mass loss as it transfers radiation momentum from the star to the gas through collisions. The stellar radiation absorbed by the dust heats it to temperatures from 300-1000K, depending on the distance from the star. Subsequently, the dust cools thermally and has been detected and explored through the Infrared Astronomical Satellite (IRAS) and the Infrared Space Observatory (ISO) wide band filters at 12, 25, 60 and 100m. (See Jura et al. (1987) for an early study of elliptical galaxies with IRAS observations. See Cesarsky & Sauvage (1999) for a recent review of mid and far IR emission from all types of galaxies.) In addition to this thermal emission, broad line absorption or emission is observed in most AGB stars at 10-12m and for oxygen-rich AGB stars, again at 20m (See Speck et al. (2000) for a recent study of AGB mid-IR features). For older, low mass stars found in elliptical galaxies, the AGB star envelopes have a high oxygen content as opposed to the high carbon content present in high mass AGB envelopes, which occurs through inner layer carbon dredge up and expulsion. The theoretical models of dust condensation show amorphous silicates (Si-O) to be the major constituent of the dust in these oxygen-rich environments, where the stretching and bending of the Si-O bond is responsible for the 10 and 20m absorption/emission. (Hereafter AGB, refers to the low mass, oxygen-rich subclass of AGB stars.) One of the surprises revealed by ISO are that in addition to amorphous silicates, crystalline silicates are observed through many narrow band features from 15-45m (Tielens et al., 1998). These observations have sparked renewed interest in dust particle formation in AGB environments (Sogawa & Kozasa, 1999; Gail & Sedlmayr, 1999). The dust composition, size distribution and other properties (albedo, dipole strength, etc) define the interaction with the gas and ultimately control the observational consequences. Consequently, much laboratory work is being devoted to “growing” silicate dust particles and attempting to extract similar particles from interplanetary dust particles brought to Earth through comets and meteorites (Fabian et al., 2000; Martin, 1995). These theoretical and lab studies have led to a working model of AGB star dust formation and emission.
Although much work has been done on the study of individual AGB stars, population studies of these AGB dust features in early-type galaxies is relatively unexplored due to the faint nature of the emission involved. In an elliptical galaxy, it is the sum of many individual oxygen-rich AGB stars that will produce in aggregate a similar feature to individual AGB stars. This feature can be used to confirm this general stellar evolution picture and determine the mass loss rate into the entire galaxy. An effort to detect this mid-IR excess in early-type galaxies was first carried out by Knapp et al. (1992) (KGW hereafter) who used the IRAS All Sky Survey coupled with ground based 10m data to search for the dusty component of the ISM in nearby elliptical galaxies. Because this emission is quite faint, these galaxies were detected at low signal-to-noise ratio. Nevertheless, they observed excess emission at 12m relative to a derived stellar continuum, indicating emission from the circumstellar dust envelope. KGW scaled the emission from Galactic AGB stars to their signal and they determined galaxy-wide mass loss rates of 0.7M. Also, they show that the dust emission is extended on the scale of the galaxy, ruling out the hypothesis that the dust emission originates only in the nuclear regions. However, many of the galaxy detections were at the 2 level and the coarse IRAS sampling (1x5) prevented good spatial sampling of the galaxies. Also in the KGW study, the sample of Galactic stars used to calibrate the observed excess did not have well determined distances, leading to errors in the scaling relation. Subsequent to the KGW work, significant advances in understanding have been made in the study of individual AGB stars with detailed observational monitoring programs in addition to improvements in the modeling of the mass loss mechanism and the subsequent radiation (Whitelock et al. (1994), hereafter W94; Trams et al. (1999) and van Loon et al. (1999), hereafter L99). These studies are essential because it is necessary to characterize the emission from individual AGB stars in order to understand the collective AGB emission from integrated galaxy light.
There are a number of key issues that IRAS was not able to address effectively due to instrumental limitations. First, it is important to definitively detect and characterize this MIR excess. Specifically, is there a spectral excess that peaks around 9.7m and is consistent with a physical source of an AGB star plus circumstellar dust envelope? Second, it is useful to determine if the excess emission is similar from galaxy to galaxy, as would be expected for similar coeval populations. If there are significant differences, this emission could be used as a diagnostic tool for star formation or history, metallicity and age of these populations. Finally, it is important to determine if this excess follows a de Vaucouleurs law, as would be expected if the circumstellar envelopes around dying stars are the only source of the MIR excess (de Vaucouleurs, 1948). We have used the CAM instrument on ISO to address these issues because it offers: 1) excellent sensitivity in six narrow-band filters that cover the 6-18m region 2) high spectral resolution imaging using the CVF in the same spectral region and 3) spatial resolution of 6 over a field of view of 3.2. Here we report upon and analyze ISOCAM observations for nine nearby early-type galaxies.
In Section 2 we describe the observations made by ISO with the CAM narrow band filters and CVF. We report on the extensive measures we undertook to process and understand the CAM detector data in Section 3. The mid-IR emission detected in these nine galaxies is described and characterized in Section 4. In Sections 4.1 through 4.2.4 the mid-IR excess emission is compared to that of Galactic and LMC AGB stars to derive a scaling relation, revealing cumulative mass loss rates for the observed galaxies. This observed mass loss rate is reasonably matched to theoretical predictions as described in Section 4.3. Section 4.4 examines the radiation vs radius profile of these galaxies in different wavelength regions. We summarize and add final thoughts in Section 5.
2 Observations
We observed nearby elliptical galaxies with a range of optical and environmental properties in the mid-Infrared (MIR) with the Infrared Space Observatory (ISO) (Kessler et al., 1996). Nine galaxies were observed in the ISO accessable regions of the sky, resulting in a statistically incomplete, but unbiased sample selected from a complete survey of optically bright early-type galaxies observed in the X-rays (Brown & Bregman, 1998). Table 1 gives basic data about the galaxies in the sample. The CAM imaging instrument operated with a 3.2 field of view and a scale of 6 per pixel (Cesarsky et al., 1998). Observations were made in long wavelength (lw) filters 4-9, corresponding to a 6-15m wavelength coverage. Table 2 reports central wavelength and bandwidth information for these ISOCAM filters (ISOCAM Science Team, 1996). As is typical with ISO, detector flux stabilization observations were taken prior to each target observation. Galaxies and their exposure times, including stabilization exposure times, are also listed in Table 2. Each filter exposure is composed of four pointings with a 1/2 pixel (3) raster movement between them. In every band all the galaxies are detected with a S/N of at least 10.
In addition, a Circular Variable Filter (CVF) observation was obtained of NGC 1404. This mode of observation covered the wavelength range from 6.22m to 14.2m at a resolution of 40 (ISOCAM Science Team, 1996). We scanned the spectral range in 38 steps and both the upward and downward scan directions. Each of the 10 frames per step position was taken with a 3.2 FOV and an integration time of 10 seconds.
3 Data Reduction
ISO uses a Si:Ga detector which has the typical electronic detector signatures of bias level, pixel-to-pixel variation, and large scale sensitivity variation. In addition, these devices respond to any change in illumination with a transient period before reaching a stabilized electronic signal. The transient behavior of these detectors can be difficult to consistently characterize because the transient period is a function of the incident photon flux. Also, many of the astronomical observations are completed before the stabilization period has been achieved. Furthermore, the detector’s 32x32 array of “pixels” are not physically distinct. Instead, electric fields are laid across the substrate to create regions that behave like pixels. Cross-talk between the pixels can be seen in the data as some pixels steal the electric charge from neighbors. Because of these peculiarities, the data reduction process requires two non-standard corrections. To correct the transient effect, models employing solid-state physics theory are matched to the detector response. This correction process is imperfect and sometimes results in a gross over-correction of the data, usually seen as a singular spike in time. Most of the cross-talk and these singular spikes are removed manually, inspecting each frame in the data cube (x, y, time). The remaining anomalies contribute little to the corrected data as they are smoothed through time averaging. We carefully studied all the corrections applied to our data in order to most accurately reconstruct the incident radiation and to have a complete understanding of the uncertainties within that product.
3.1 ISOCAM - LW4-LW9
The ISO data were reduced using CAM Interactive Analysis (CIA) version 3.0 (October 1998) developed by the instrument team.111The ISOCAM data presented in this paper were analysed using CIA, a joint development by the ESA Astrophysics Division and the ISOCAM Consortium led by the ISOCAM PI, C. Cesarsky, Direction des Sciences de la Matiere, C.E.A., France. First, the data were grouped into individual filters. In these filter groupings, we retained the pre-observation grade pointings that occur prior to program observations for flux stabilization, suppling as much information as possible to the transient correction (below). We subtracted a dark constructed from ISO calibration data and adjusted for the dates of our observations. Outlined below are the extensive measures that were taken to minimize the transient effect in our data.
There are two important signatures that need to be removed from the data; an unwanted physical source (cosmic rays) and a detector electronic effect (variable gain or transient effect). These two signatures are not independent as every cosmic ray event decays exponentially back down to the background level. In order to completely remove the impact that cosmic rays had on the data, it was necessary to identify and mask both the cosmic ray event and its subsequent transient trail. For our automated deglitching routines, we split the data array into two regions: a central or source region centered on the galaxy with a five pixel radius and an outer background region. In the background region, an aggressive (low sigma rejection limits) software deglitching routine based on both temporal and spatial dimensions removes most of the non-stabilized signal. In the source region, a temporal deglitching method with large sigma rejection limits retains the signal when the satellite moves between raster positions. Next, additional cosmic rays or glitches overlooked by the automated routines were masked. The entire timeline for each pixel in the data cube was reconstructed, including pre-observation grade data used to start stabilizing the detector.
After removing all the cosmic rays and their transient trails from the data, we corrected for the transient effect. Of all the transient correction methods available, the Fouks-Shubert (F-S) method best corrected our transient data to the stabilized flux levels. This method is based on the Fouks-Shubert theory of Si:Ga detectors and is used to create a non-linear differential equation which describes the physics of the p-type photo-conductor in response to incident radiation. This theory models the non-linear response and decay of signal as it is received by this type of detector. The solution to the equation can be inverted and applied to the data, thereby yielding the stabilized fluxes (Coulais & Abergel, 2000). The mathematics used to solve the F-S equation are non-trivial and many solving algorithms have been developed to tackle the problem. The algorithm that worked best for our data was external to CIA3.0 and developed by Herve Wozniak. This algorithm was subsequently incorporated into CIA4.0
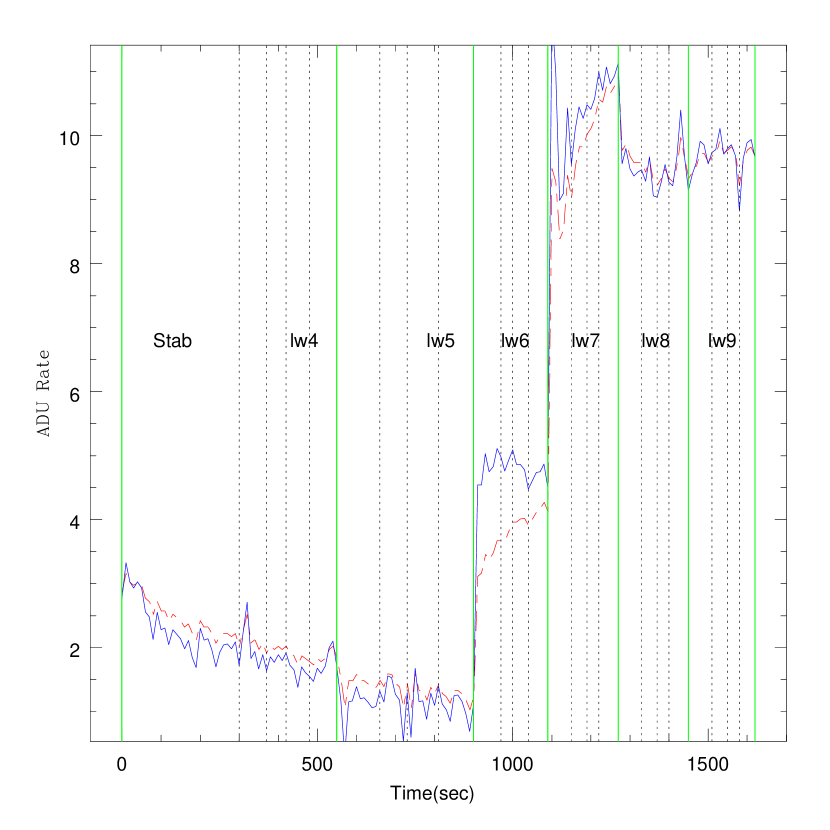
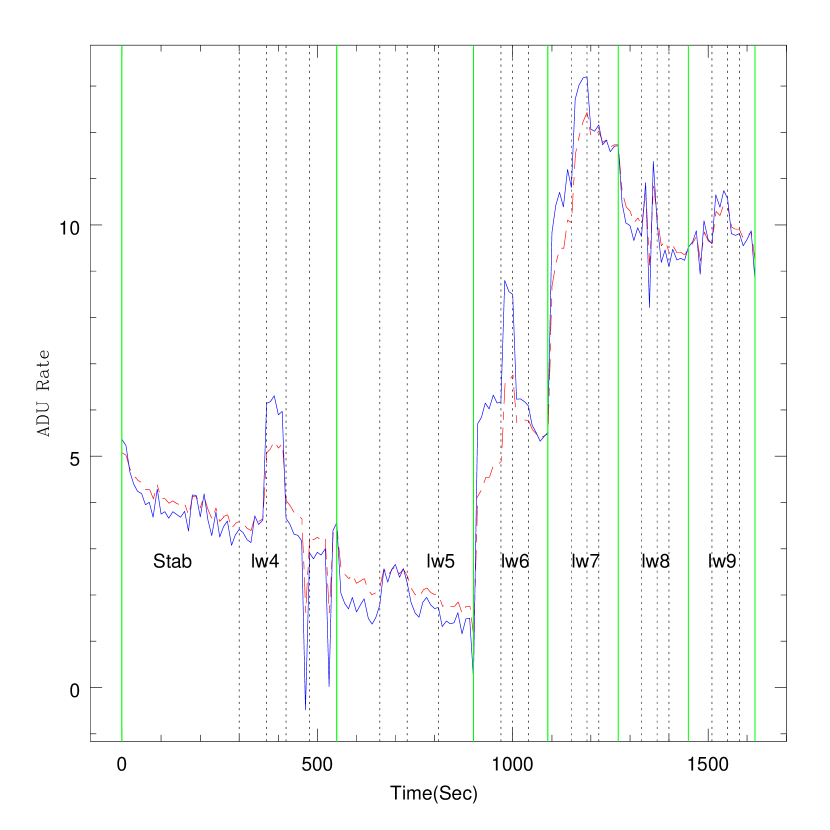
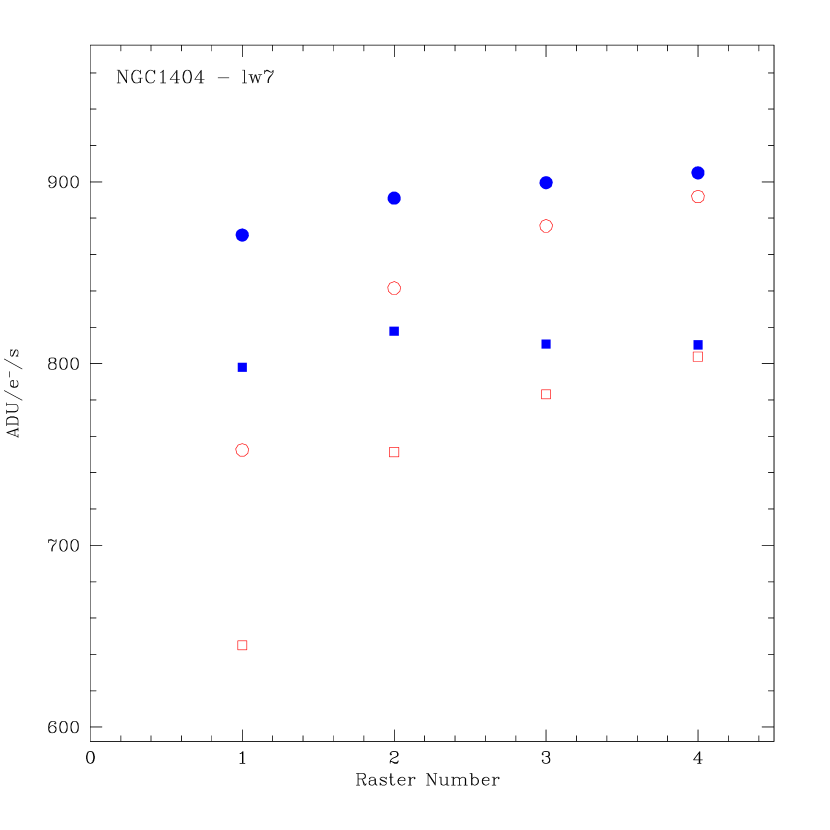
On a pixel by pixel basis, it was difficult to judge the effectiveness of any given transient correction. However, large regions, such as source pixels and sky pixels, display the trends of the data and the transient correction with clarity. The effectiveness of a transient correction method was judged by examining a pointing that had been allowed sufficient time to approach a stable value by the third and fourth rasters, but was transient in the first two. We compared the corrected values of the first two pointings to the last two stabilized levels. Finally, the transient correction is imperfect and frequently leaves spikes in the data (e.g. lw7 in Figure 1). We meticulously searched the data and manually removed these singularities in the solution.
With the data corrected for transient behavior, the data cubes were flattened and combined for individual filters. Because the small movement between rasters 1/2 pixel inhibited us from producing a flat from our own data, the library flat from the calibration files of ISO was used. The pointings were corrected for distortions and the four rasters were combined with calibration tasks in CIA. The flux units were converted to mJy with the standard conversion incorporated in CIA3.0.
The transient correction was the most uncertain step in our reductions. In order to gauge the level of this uncertainty, we split each filter observation into its individual raster observations, giving us four independent observations per filter. Aperture photometry was performed on each of these raster images in each filter and the standard deviation about the mean determined the error in the data. (See Table 3 for mean fluxes and errors.) In cases where the statistical noise in the sky was larger than deviation about the mean, these larger errors were used.
From these data, a six-band spectral energy distribution, SED, was extracted as well as surface brightness profiles. For the spectral energy distribution, the flux was summed within a 30 arcsecond radius centered on the galaxy and then subtracted off from a background determined in the outer parts of the image. The vignetting was evident on some image edges so we excluded the outer 3 pixels from all of our background measurements. The surface brightness measurements were determined in annuli centered on the galaxy out to the edge of the chip, with radial increments of one pixel. The background for some of the galaxies was within an effective radius and galaxy contamination was a concern. However, the SED of the background region matched recent ISO observations of the zodiacal light, giving us confidence in our subtracted fluxes (Reach et al., 1996). Furthermore the profile measurements will not be affected as no background is subtracted, and, in fact, little to no increase in flux over is seen in the profiles of the background region.
3.2 ISOCAM - CVF (Circular Variable Filter)
The CVF data were processed independent of the CAM because the exposure times are significantly shorter, filters much narrower and flux levels reduced from the narrow band passes. These conditions force different methods to be used to eliminate the instrument’s electronic signature. Data reduction followed the standard CVF steps: after dark current subtraction we cleaned the data cube of glitches using both the CIA multiresolution median transform algorithm and a manual deglitching method by inspecting the cube frame by frame. As with the narrow band filter data, the Fouks-Schubert model for stabilization was used and a jitter correction was applied to the data.
We devoted effort to producing an appropriate and accurate flat field and background subtraction procedure. Stray light from extended sources may affect the flat-field quality of the reduced images. The standard flat-field procedure on CVF images produces a deviation from flatness, around 10% on average, which limits the ability to image faint extended sources and to perform accurate photometry. The characteristic double-lobe CVF flat field pattern, present in the data after this flat field process, can be removed by subtracting an appropriate zodiacal light cube and by using a more appropriate detector flat field. However, since neither cube was available from the standard distribution of calibration files at time of reductions, we produced our own. We constructed a zodiacal light cube for both sectors of the lw CVF by interpolation, starting from 8 zodiacal images taken with the CVF at fixed wavelengths within the wavelength range of our measurements. We were able to remove the zodiacal light by scaling this cube to the intensity measured off-source in our observations, and subtracting the scaled cube from our measurements. Flat fields were produced in a similar manner. From the data archive we recovered all the detector flats which were taken with the 6 FOV through narrow band filters. These flats were interpolated to match the wavelengths in our data set, and each data frame was divided by the appropriate flat. The final calibrated data for NGC 1404, the only galaxy observed by CVF in our program, is reported as the background subtracted flux within within 30 radius in Table 4.
4 Results
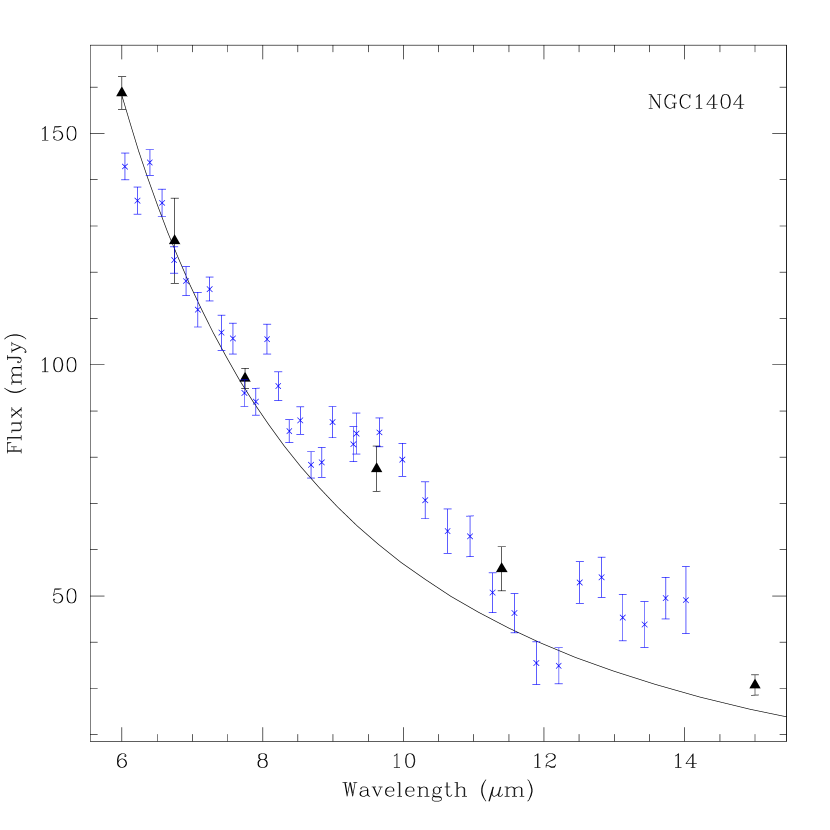
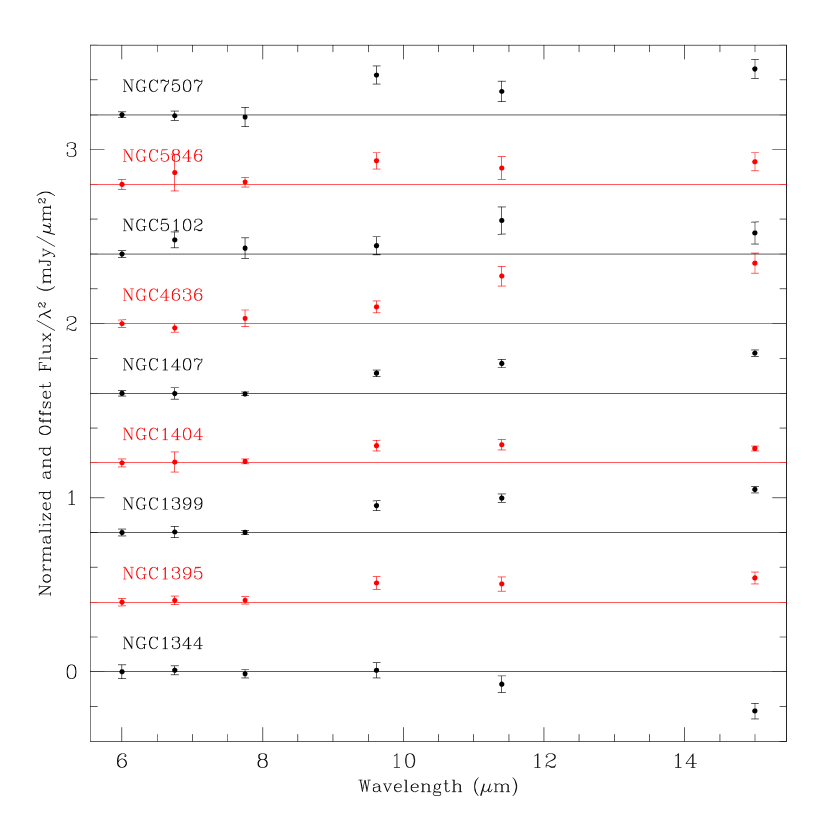
Elliptical galaxies are comprised of mostly old K and M-type stars. Because the spectral energy distribution of these stars follows the Rayleigh-Jean’s part of a blackbody distribution from 6m to 7.75m, we fit a cool (T3500K) blackbody to our first three data points (See Figure 4). These data points are also well fit by IRAS Low Resolution Spectrograph (LRS) data of late type stars, confirming that our choice of a blackbody function is appropriate for this region. When this blackbody law is extended to longer wavelengths, a clear excess over stellar emission can be seen in wavelengths 9.62m-15.0m for all of our galaxies, except NGC 1344. The same results apply when a ratio of the two different emission regions is taken and compared to the expected color from a blackbody or LRS spectra of late type non-mass-losing stars. This excess emission coincides with the 9.7m silicate dust band that originates in the circumstellar envelopes of AGB stars. It has been established that the emission from this dust band, when calibrated, can reveal the mass loss rates for AGB stars (Skinner & Whitmore, 1998; Knapp et al., 1992; Whitelock et al., 1994).
In the one galaxy for which we have CVF data, NGC 1404, the results are consistent with the narrow band SEDs (Figure 5). A stellar continuum in the shorter wavelengths, 6-9m is present, with an emission feature from 9-11m. This feature is well matched by IRAS LRS data from late-type mass losing stars, such as , and it is also coincident with laboratory spectra of silicate grains (Dorschner et al., 1995; Jger et al., 1994; Schutte & Tielens, 1989).
In the mid-infrared, it is also possible to detect poly-cyclic aromatic hydrocarbons (PAHs) as they have characteristic emission in this wavelength region. However, we see no evidence of PAH emission in the strongest band at 7.7m with a typical upper limit of five mJy.
4.1 12m Excess
In order to compare our data with the literature, it useful to define a “12m Excess,” () which is the broad-band 12m flux minus 38% of the K-band(2.2m) flux, where the 12m flux can be either the IRAS 12m band or the ISOCAM lw10 filter, whose responses are nearly identical (IRAS Science Team, 1986; ISOCAM Science Team, 1996). Because this 12m band includes all of the flux expected from the 9.7m silicate feature, when the stellar contribution is subtracted, the remaining flux should be circumstellar dust emission.
Because we did not have broad-band ISOCAM lw10 measurements, we used the ISO system response data to develop a flux conversion between the narrow band filters lw6-lw9 to lw10. The relation we determined was
| (1) |
where lw# indicates the flux measured through each filter. We also calculated a K(2.2m) flux assuming the lw4-lw6 flux was stellar in nature and extrapolated in the Rayleigh-Jeans limit. Rather than use K magnitudes reported in the literature, we found that this extrapolation to 2.2m was a better comparative measurement for our galaxies because of the different apertures and systems used in the literature. Also, the absolute calibration of ISO is not as well-determined as the internal calibration, giving us further reason to rely on internal calibrations rather than use an absolute system. In Table 5 we report the log of the ratio of the calculated lw10 filter to extrapolated K-band flux as a K-[12] color for these galaxies. A hot blackbody (T10,000K), which is equivalent to an A0 V star at these wavelengths, sets the zero point of the K-[12] color. The errors listed are propagated from the random errors in the data and quantities from the literature
4.2 Mass loss Observations
In order to determine mass loss rates for our galaxies, we scaled individual mass-losing AGB stars to match our data. These individual AGB stars have semi-empirical mass loss rates determined by matching models to observational data. The two most common observations are CO line profile data and IR photometric measurements. The IR photometry detects circumstellar shell fluxes, while optical-waveband data are typically used to track the stellar component. The photometry data are compared to spectral energy distribution models and the CO data are matched to model profiles where a combination of velocity and column density reveals the mass loss rate. From various literature searches, there is generally an uncertainty of a factor of 4-5 in these models and there are parameters, such as metallicity, gas to dust ratio, and age, that play a large, but relatively undetermined role. Groenewegen et al. (1995) compared a Galactic, an LMC, and an SMC AGB star all with similar periods and concluded that AGB mass loss rates increase with metallicity. However, too little data were available to derive an exact relationship. Theoretical studies of mass loss have also noted this effect but have been unable to quantify the exact nature (Bowen & Willson, 1991). Monnier et al. (1999) compares three decades of MIR spectra of AGB stars and finds evidence for significant changes in the silicate feature of AGB stars within this short timescale. Our approach to these uncertainties was to explore each of the mass loss scaling relations available and present the range of determinations as likely uncertainties in the current models and methods. For each of the methods we compared our integrated light colors/relative fluxes to individual mass-losing stars.
4.2.1 Previous Mass Loss Relations
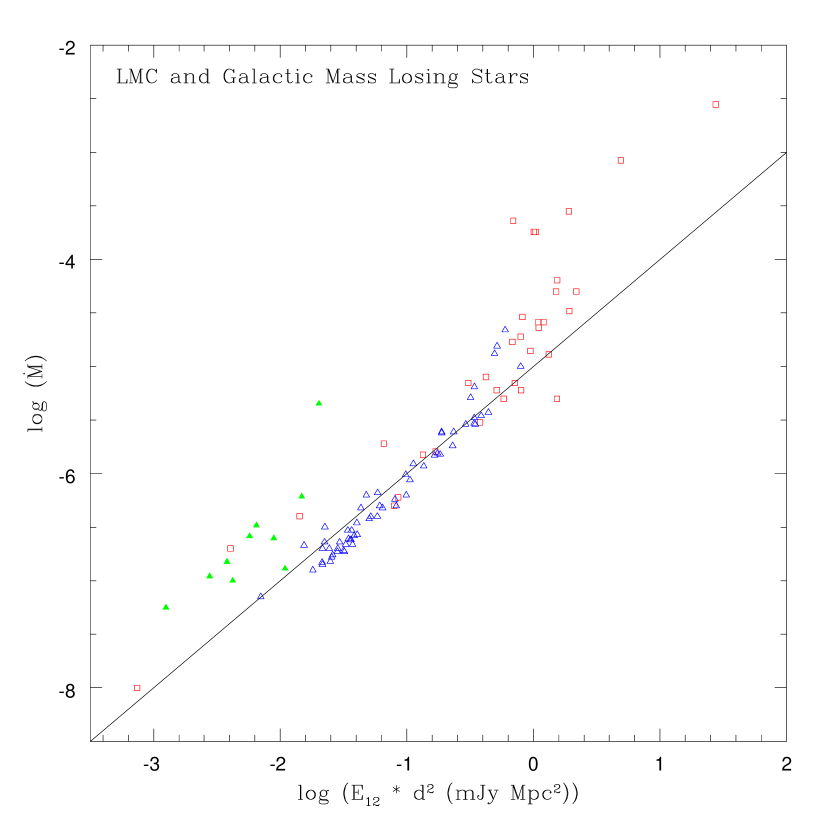
As a first attempt at calibrating our 12m excess, , to a mass loss rate, we re-examined the Galactic AGB stars KGW used to scale their emission. The main difficulty in AGB star studies is determining their distances. KGW assumed an absolute magnitude of -8 for all of these stars to obtain the distances. Subsequently, Hipparcos measured distances for some of these stars, although some are at the limit of detectability and thus have large associated errors. The KGW relation scaled to the new Hipparcos distances and corrected for the Lutz-Kelker bias (Figure 6)(Smith, 1987; Lutz & Kelker, 1973) allowed us to derive an updated mass loss rate relation of the form:
| (2) |
The Hipparcos distances lead to a correction of +0.41 in the zero point of this relation from the original. The average Hipparcos distance was 55% smaller than the assumed distances, leading to the large correction. We apply this calibration to our 12m Excess, as shown in Table 5, in the column labeled “KGW”.
4.2.2 Galactic AGB Stars
A systematic study of Galactic AGB stars has been carried out by W94, who obtained multi-epoch, ground-based K-L observations which were compared with IRAS observations. A key feature of this study was to match the ground-based data with the IRAS observations. Temporal matching of observations is a critical step in minimizing errors because these stars are Mira variables which have K-band magnitude variations of up to one magnitude. The multi-epoch data allowed for a period-luminosity relation to be determined for these Miras which was used to calculate distances to these Galactic stars. The mass loss rates were determined from modeling based on a modified Reimers’ Formula (Reimers, 1975). We used the 12m IRAS flux for each of the mass-losing AGB stars and subtracted 38% of the period-mean K-band flux, corresponding to the blackbody contribution at 12m. A clear linear relationship of this 12m excess, scaled with the square of the distance can be seen in Figure 6 which is fitted by
| (3) |
This relationship is extrapolated to our galaxies and presented in Table 5, in the column labeled “W94”.
4.2.3 LMC AGB Stars
To avoid the problem of distance uncertainties, Trams et al. (1999) observed AGB stars in the LMC with a similar ground-based monitoring program to that used by W94. The space-based IR data were matched in time with the ground-based observations to minimize pulsation phase errors during analysis. Most of the observations were taken with ISOCAM in the lw10 band, with a smaller number of observations taken with ISOPHOT. About half of the observations had ISOCAM CVF spectra to aid in the mass loss determinations by modeling the silicate 9.7m feature. Otherwise, mass loss rates were determined solely from SED modeling (van Loon et al., 1999). We used the data provided to derive the 12m excess, which is correlated with the mass loss, leading to a linear relation of the form
| (4) |
This relationship (Figure 6) provides an additional mass loss measurement for our data (Table 5, column labeled “L99”).
4.2.4 Comparison of Mass Loss Determination in the Sample Galaxies
The three different mass loss relationships yield moderately different rates, with a range of 0.6 dex in the zero point between the W94 relation to the KGW relation, with L99 falling in between. We believe that this range represents the current uncertainties in AGB mass loss models, and, most likely, the poorly determined factors such as metallicity and age are creating some of the dispersion. It is thought that younger AGB populations will evolve off the main sequence faster and lead to higher mass loss rates. On the other hand, the more metal rich an AGB star is, the more easily it will form dust grains; for a given amount of 12m excess, the derived mass loss will be higher in a metal rich AGB star. Both the KGW and W94 studies sample high galactic latitude stars (), which should be older, more metal rich stars than young and metal poor stars in the LMC (the L99). Both factors imply that the LMC AGB stars should have a higher mass loss rate for a given 12m excess, but the derived rate falls between the two studies. Clearly, there is a factor of a few uncertainty in the community about mass loss determinations. However, for similar populations such as our early-type galaxies, this problem applies only to absolute mass loss and the relative rates between our galaxies should be accurate to 30% as the sum total of the error propagation reports in Table 5.
If there is a universal mass loss rate that varies linearly with the number of stars in a population, then galaxies’ observed mass loss rates should scale with luminosity to a common value. When we propogate the observed errors from the various mass loss determinations and scale by the luminosity of the galaxies (Table 1), the range of values over the nine galaxies varies by a factor of ten. Meanwhile, the propogated errors of observational uncertainties predict a scatter of approximately one-half. We could justifiably throw out NGC 1344 and/or NGC 5102 from our sample, however these removals do not change the results. Because the range of luminosity scaled mass loss rates is much larger than the observational uncertainties, the data suggests that we are detecting physical differences between these populations and not observing the same phenomena over different sized populations. The most likely physical differences are age and metallicity.
4.3 Theoretical Mass Loss Rates
It is also possible to address the global mass loss rate from theoretical stellar evolutionary models for a stellar population. Because elliptical galaxies consist of an old coeval population and all these stars have similar end states, it is possible to construct arguments and/or models predicting the result from a collection of these stars moving through their AGB phase. The first task in such a theoretical line of reasoning is to determine the fractional number of stars in a given old stellar population that is currently in the AGB phase. One method for determining this critical input parameter is to use observations of supernovae (SNe) and planetary nebulae (PN). These stellar evolutionary phases are short lived, but over a large enough population such as a galaxy, there are enough of these seen at any given time to give an idea of the relative numbers of stars in these post-AGB phases. If the number of these observables are extrapolated to include the entire AGB phase, then an estimate can be obtained of the fraction of stars of a population that are currently losing mass. From stellar modeling and stellar remnant observations, it is known that stars with masses around lose approximately in the AGB phase. Also, from stellar modeling applied to observations of clusters of stars it is known that the approximate time spent in the AGB phase is on the order of years. Combining the fraction of a population in the AGB phase with the total mass loss for 1.0 stars and the time taken to lose this mass, it is possible to derive estimates of galaxy-wide mass loss rates.
Faber & Gallagher (1976) made such arguments based on the observations at the time and derived a scaling law of 0.015, where represents the “photographic” band of the international photographic system (Seares & Joyner, 1943). Converting to the UBV photometric system for K and M-type stars drops this constant by a factor of 2.5-3.0 (Johnson & Morgan, 1953; Johnson, 1963). With refined stellar models, it is possible to further tune this relation by examining the fraction of stars theoretically expected to be in an AGB phase at a given age. A few such studies have been carried out and have slightly increased this theoretical mass loss rate by about 30% for a 15Gyr population (Mathews, 1989; D’Ercole et al., 1989; Ciotti et al., 1991; Renzini & Buzzoni, 1986; Sarazin, 1990; Smith, 1999). These adjustments lead to a relation of the form: 0.0078, which we apply to our galaxies and report in Table 5 under the column “theory”. The theoretical rates are similar to the average of the three different methods used to derive the observed mass loss rates. We are encouraged by the fact that the two galaxies with the lowest predicted mass loss rates, NGC 1344 and NGC 5102, are the two galaxies observed to have the least amount of 12m excess emission. The small sample of galaxies precludes us from drawing conclusions about any discrepancies between the observed and theoretical rates, but it is natural to believe that differences will arise from metallicity and age changes between the galaxies as they do in individual AGB stars. Rather than viewing this as a hindrance to the study of mass loss, the relationships, once determined, can be inverted and used as observational tools to determine age and metallicity.
4.4 Light Profiles
The surface brightness profiles of our data in all wavelength bands agree with a de Vaucouleurs’ profile (See Figures 7) (de Vaucouleurs, 1948). A de Vaucouleurs’ profile fits both the stellar bands (lw4 - lw6) as well as the stellar + dust bands (lw7 -lw9). For our brightest galaxy, NGC 1399, where the errors are smallest and best constrain the solution, the data marginally match with the model, with reduced of 3 for 10 degrees of freedom. When we remove the first data point from the fit, where there are pixelization effects from tracking a steep profile with large pixels, we obtain a reduced value of 1.8, indicating a high correlation between the data and the model. The model remains consistent with the data when we fix , the effective radius, to the optically determined value (reported in Table 1) rather than have it vary as a free parameter. In the redder dust bands, the flux profile is again consistent with a profile, with reduced at or below unity. The stellar bands (lw4-lw6) are expected to fit a profile as K and M stars are the only source of radiation in this region. This provides a check on the data, confirming that the data processing removed all large scale variations over the field of view. Because the stellar + dust bands (lw7-lw9) are also consistent with a profile, we conclude that the MIR excess originates from the same population as the K and M stars. More specifically, the MIR excess originates from the dust in the circumstellar shells of the subset of the K and M stars that are currently going through their AGB phase.
5 Summary and Concluding Remarks
Nine elliptical galaxies were observed with CAM on ISO in six narrow bands between 6m and 15m. From 6m to 9m the emission is consistent with the combined stellar emission from the K and M-type stars that dominate elliptical galaxy’s integrated light. In eight of these galaxies we detected excess over stellar photospheric emission from 9m to 15m. For one galaxy, NGC 1404, ISOCAM CVF data, with its finer spectral resolution, shows the excess emission is consistent with the known 9.7m oxygen-rich AGB silicate feature. We used Galactic and LMC AGB stars to calibrate a scaling relation, revealing galactic-wide mass loss rates for these galaxies. These observed rates mostly agree with theoretical predictions. The observed rates do not scale with luminosity to a universal rate and thus suggests physical differences between these populations. We also show that emission at all wavelengths is consistent with a de Vaucouleurs’ law.
Now that it is possible to observe the signatures of mass loss, it would be valuable to revisit the predicted mass loss characteristics of cluster and galaxy sized populations. Tracking the population’s total mass loss through time in a quantitative manner would be a valuable contribution to the field. Also the calibration of the relationship between mass loss and mid IR excess needs further investigation with additional studies of individual AGB stars. In particular, the effects of different metallicites should be investigated, as it is known to play a role, but the exact nature is not yet determined. An exciting avenue of research that will surely develop once the calibrations of these AGB features is accurately known, is the Visual-MIR color-color diagnostics. This observational tool was recently explored in a theoretical study by Bressan et al. (1998), which shows that for certain populations these types of relations could potentially break the age-metallicity degeneracy that has long plagued optical color-color relations. With SOFIA, SIRTIF and other upcoming IR missions, in addition to the continuing work though high altitude ground-based windows, it should be possible to continue to investigate these issues.
References
- Bowen & Willson (1991) Bowen, G.H., Willson, L.A. 1991, ApJ, 375, L53
- Bressan et al. (1998) Bressan, A., Granato, G.L., Silva, L. 1999, A&A, 332, 135
- Brown & Bregman (1998) Brown, B. A., Bregman, J. N. 1998, ApJ, 495, 75
- Cesarsky et al. (1998) Cesarsky, C.J., Abergel, A., Agnèse, P., et al. 1998, A&A, 315, L32
- Cesarsky & Sauvage (1999) Cesarsky, C.J., Sauvage, M. 1999, Ap&SS, 269, 303
- Ciotti et al. (1991) Ciotti, L., D’Ecole, A., Pellegrini, S., Renzini, A. 1991, ApJ, 376, 380
- Coulais & Abergel (2000) Coulais, A., Abergel, A. 2000, A&AS, 141, 533
- de Vaucouleurs (1948) de Vaucouleurs, G. 1948, Ann. d’Astrophys., 11, 247
- D’Ercole et al. (1989) D’Ercole, A., Renzini, A., Ciotti, L., Pellegrini, S. 1989, ApJ, 341, L9
- Dorschner et al. (1995) Dorschner, J., Begemann, B., Henning, Th., Jger, C., Mutschke, H., 1995, A&A, 300, 503
- Fabian et al. (2000) Fabian, D., Jger, C., Henning, Th., Dorschner, J., Mutschke, H. 2000, A&A, 364, 282
- Faber & Gallagher (1976) Faber, S.M., Gallagher, J.S. 1976, ApJ, 204, 365
- Faber et al. (1989) Faber, S.M., Wegner, G., Burstein, D., Davies, R.L., Dressler, A., Lynden-Bell, D., & Terlevich, R.J. 1989 ApJS, 69, 763
- Gail & Sedlmayr (1999) Gail, H.P., Sedlmayr, E. 1999, A&A, 347, 594
- Groenewegen et al. (1995) Groenewegen, M.A.T., Smith, C.H., Wood, P.R., Omont, A., Fujiyoshi, T. 1995, ApJ, 449, L119
- Habing (1996) Habing, H.J. 1996 A&A Rev., 7, 97
- IRAS Science Team (1986) IRAS Science Team 1986, IRAS, IRAS Point Source Catalog, Version 1 (PSC)
- ISOCAM Science Team (1996) ISOCAM Science Team 1996, ISOCAM Data Handbook
- Jger et al. (1994) Jger, C., Mutschke, H., Begemann, B., Dorschner, J., Henning, Th. 1994, A&A, 292, 641
- Johnson & Morgan (1953) Johnson, H.L., Morgan, W.W. 1953, ApJ, 117, 313
- Johnson (1963) Johnson, H.L. 1963, in “Stars and Stellar Systems, Vol. 3: Basic Astronomical Data” Strand, K. (Ed.), Chicago University Press p. 204
- Jura et al. (1987) Jura, M., Kim, D.W., Knapp, G.R., Guhathakurta, P. 1987, ApJ, 312, L11
- Kessler et al. (1996) Kessler, M.F., Steinz, J.A., Anderegg, M.E., et al. 1996, A&A, 315, L27
- Knapp et al. (1992) Knapp, G.R., Gunn, J.E., Wynn-Williams, C.G. 1992, ApJ, 399, 76 (KGW)
- Lutz & Kelker (1973) Lutz T.E., Kelker D.H., 1973, PASP, 85, 573
- Mathews (1989) Mathews, W.G. 1989, AJ, 97, 42
- Martin (1995) Martin, P.G. 1995, ApJ, 445, L63
- Monnier et al. (1999) Monnier, J.D., Geballe, T.R., Danchi, W.C. 1999, ApJ, 521, 261
- Reach et al. (1996) Reach, W.T., Abergel, A., Boulanger, F., Désert, F.X., Perault, M., Bernard, J.P., Blommaert, J., Cesarsky, C., Cesarsky, D., Metcalfe, L., Puget, J.L., Sibille, F., Vigroux, L. 1996, A&A, 315, L381.
- Reimers (1975) Reimers, D. 1975, in “Problems in Stellar Astmospheres and Envelopes”, Basckek, B., Kegel, W.H., Traving G.(Eds.), Springer, Berlin p. 229
- Renzini & Buzzoni (1986) Renzini, A., Buzzoni, B. 1986, in “Spectral Evolution of Galaxies”, Chiosi, C., Renzini, A.(Eds.), Dordrecht, Reidel, p. 195
- Sarazin (1990) Sarazin, C.L. 1990, in “The Interstellar Medium in Galaxies”, Thronson, H.A., Jr., Shull, J.M. (Eds.), Dordrecht, Kluwer, p 201
- Schutte & Tielens (1989) Schutte, W.A., Tielens, A.G.G.M. 1989, ApJ, 343, 369
- Seares & Joyner (1943) Seares, F.H., Joyner, M.C. 1943, ApJ, 98, 302
- Skinner & Whitmore (1998) Skinner, C.J., Whitmore, B. 1988, MNRAS, 31, 169
- Smith (1999) Smith, G.H. 1999, PASP, 111, 980
- Smith (1987) Smith, H, Jr. 1987, A&A, 188, 233
- Sogawa & Kozasa (1999) Sogawa, H., Kozasa, T. 1999, ApJ, 516, L33
- Speck et al. (2000) Speck, A.K., Barlow, M.J., Sylvester, R.J., Hofmeister, A.M. 2000, A&AS, 146, 437
- Tielens et al. (1998) Tielens, A.G.G.M., Waters L.B.F.M., Molster, F.J., Justtanont, K. 1998, Ap&SS, 255, 415
- Trams et al. (1999) Trams, N.R., van Loon, J.Th., Waters, L.B.F.M., Zijlstra, A.A., Loup, C., Whitelock, P.A., Groenewegen, M.A.T., Blommaert, J.A.D.L., Siegenmorgen, R., Heske, A., Feast, M.W. 1999, A&A, 346, 843
- van Loon et al. (1999) van Loon, J. Th., Groenewegen M.A.T., de Koter, A., Trams, N.R., Waters, L.B.F.M., Zijstra, A.A., Whitelock, P.A., Loup, C. 1999, A&A, 351, 559 (L99)
- Whitelock et al. (1994) Whitelock, P., Menzies, J., Feast, M., Marang, F., Carter, B., Roberts, G., Catchpole, R., Chapman, J. 1994, MNRAS, 267, 711 (W94)
| Name | RAaaValues taken from NED (New Extragalactic Database). | DecaaValues taken from NED (New Extragalactic Database). | b,cb,cfootnotemark: | Db,db,dfootnotemark: | b,eb,efootnotemark: | ffLuminosity in the B-band derived from and distances. | Hubble TypebbFaber et al. (1989) |
|---|---|---|---|---|---|---|---|
| (J2000) | (mag) | (km/s) | (″) | (ergs/s) | |||
| NGC 1344 | 03 28 19.3 | -31 04 04 | 11.11 | 142288 | 38.38 | 43.350.06 | E5 |
| NGC 1395 | 03 38 29.7 | -23 01 40 | 10.94 | 1990187 | 45.07 | 43.710.06 | E2 |
| NGC 1399 | 03 38 29.3 | -35 27 01 | 10.55 | 142288 | 42.37 | 43.580.06 | E1P |
| NGC 1404 | 03 38 52.0 | -35 35 34 | 10.89 | 142288 | 26.72 | 43.440.06 | E1 |
| NGC 1407 | 03 40 11.8 | -18 34 48 | 10.57 | 1990187 | 71.96 | 43.860.12 | E0 |
| NGC 4636 | 12 42 50.0 | +02 41 17 | 10.20 | 133371 | 101.14 | 43.660.06 | E0 |
| NGC 5102 | 13 21 57.6 | -36 37 49 | 10.57 | 20225 | 23.29 | 41.640.12 | S0 |
| NGC 5846 | 15 06 29.2 | +01 36 21 | 10.67 | 2336284 | 82.61 | 43.960.12 | E0 |
| NGC 7507 | 23 12 07.5 | -28 32 22 | 11.15 | 1750371 | 31.41 | 43.520.06 | E0 |
| ISOCAM LW Filters | |||||||
|---|---|---|---|---|---|---|---|
| LW4 | LW5 | LW6 | LW7 | LW8 | LW9 | ||
| (m) | 6.00 | 6.75 | 7.75 | 9.62 | 11.4 | 15.0 | |
| (m) | 5.50-6.50 | 6.50-7.00 | 7.00-8.50 | 8.50-10.7 | 10.7-12.0 | 14.0-16.0 | |
| Galaxy Name | ISO Orbit | Exposure Time (s) | |||||
| NGC 1344 | 802 | 560 | 350 | 200 | 190 | 200 | 180 |
| NGC 1395 | 848 | 560 | 360 | 200 | 190 | 190 | 170 |
| NGC 1399 | 802 | 560 | 350 | 190 | 180 | 180 | 170 |
| NGC 1404 | 593 | 560 | 360 | 210 | 190 | 200 | 180 |
| NGC 1407 | 820 | 560 | 360 | 200 | 190 | 200 | 170 |
| NGC 4636 | 574 | 550 | 360 | 190 | 190 | 190 | 170 |
| NGC 5102 | 632 | 560 | 350 | 190 | 200 | 200 | 170 |
| NGC 5846 | 627 | 560 | 360 | 210 | 190 | 190 | 180 |
| NGC 7507 | 537 | 570 | 360 | 210 | 200 | 200 | 170 |
Note. — Exposure times for LW4 filter include pre-observation, detector stabilization time.
| Galaxy | 6m | 6.75m | 7.75m | 9.62m | 11.4m | 15.0m |
|---|---|---|---|---|---|---|
| (mJy) | ||||||
| NGC 1344 | 80.43.2 | 64.92.1 | 47.01.9 | 31.93.5 | 18.93.9 | 7.73.6 |
| NGC 1395 | 121.22.6 | 97.93.0 | 74.42.6 | 60.84.5 | 42.74.9 | 26.74.0 |
| NGC 1399 | 167.53.4 | 133.35.5 | 100.51.9 | 92.94.8 | 73.23.9 | 47.33.2 |
| NGC 1404 | 158.73.5 | 126.89.2 | 97.02.2 | 77.54.9 | 55.94.8 | 30.82.2 |
| NGC 1407 | 169.12.8 | 133.15.6 | 100.61.9 | 85.73.2 | 69.53.9 | 46.03.2 |
| NGC 4636 | 114.22.5 | 85.32.8 | 73.45.5 | 55.43.8 | 59.46.5 | 40.76.6 |
| NGC 5102 | 82.91.6 | 78.93.9 | 53.74.9 | 36.04.3 | 35.86.5 | 17.55.2 |
| NGC 5846 | 97.82.8 | 90.410.3 | 60.42.7 | 52.04.5 | 33.66.5 | 21.15.1 |
| NGC 7507 | 109.71.9 | 85.62.9 | 63.86.2 | 72.15.7 | 41.46.4 | 32.25.9 |
Note. — Fluxes are the mean of four raster aperature photometry measurements taken at 30 arcseconds radius centered on the galaxy with background subtraction from the outer regions of the image. Errors are the larger of the standard deviation of the mean of the four raster measurments or the statistical noise in the sky region of image.
| Wavelength(m) | Flux(mJy) | Wavelength(m) | Flux(mJy) |
|---|---|---|---|
| 6.044 | 84.982.90 | 8.993 | 52.093.38 |
| 6.221 | 80.572.94 | 9.291 | 49.263.77 |
| 6.396 | 85.492.78 | 9.660 | 50.644.44 |
| 6.569 | 80.292.96 | 9.986 | 50.783.10 |
| 6.741 | 72.942.85 | 10.31 | 47.273.56 |
| 6.911 | 70.243.14 | 10.63 | 42.063.96 |
| 7.080 | 66.573.74 | 10.95 | 38.084.83 |
| 7.248 | 69.212.59 | 11.27 | 37.414.39 |
| 7.414 | 63.613.80 | 11.58 | 30.164.30 |
| 7.578 | 62.843.35 | 11.89 | 27.544.24 |
| 7.741 | 55.832.88 | 12.21 | 21.114.61 |
| 7.903 | 54.722.91 | 12.51 | 20.763.88 |
| 8.063 | 62.783.25 | 12.82 | 31.474.49 |
| 8.222 | 56.733.13 | 13.12 | 32.154.32 |
| 8.379 | 50.942.45 | 13.43 | 26.965.04 |
| 8.534 | 52.312.97 | 13.73 | 26.074.97 |
| 8.689 | 46.612.84 | 14.02 | 29.464.50 |
| 8.842 | 46.933.22 |
Note. — Fluxes are the taken at 30 arcseconds radius centered on the galaxy with background subtraction from the outer regions of the image. Errors are the statistical noise in the sky region of image.
| Galaxy | K-[12]aaK-band relative flux calculated assuming 6.00-7.75m is stellar emission and employing the Rayleigh-Jeans law. 12m magnitude, [12], derived from linear combination of narrow band filters. Zero point for K-[12] relation set by hot blackbody (T10,000K). | bbFraction of flux encircled at 30 assuming effective radii listed in Table 1 and a de Vaucouleurs profile. | ccTotal extrapolated B magnitudes assuming an law. | ddDistances corrected for solar motion and Virgo infall. | KGW | W94 | L99 | |
|---|---|---|---|---|---|---|---|---|
| NGC 1344 | -0.090.01 | 0.4327 | -4.51.0 | 3.450.07 | 0.100.04 | 0.030.01 | 0.070.02 | 0.37 |
| NGC 1395 | 0.260.01 | 0.3905 | 25.22.6 | 4.370.06 | 0.860.40 | 0.210.06 | 0.570.22 | 0.86 |
| NGC 1399 | 0.450.01 | 0.4065 | 63.03.2 | 4.480.06 | 1.100.40 | 0.270.05 | 0.730.22 | 0.64 |
| NGC 1404 | 0.250.01 | 0.5322 | 22.41.7 | 4.030.06 | 0.390.15 | 0.100.02 | 0.260.08 | 0.46 |
| NGC 1407 | 0.400.01 | 0.2787 | 77.74.0 | 4.860.08 | 2.641.13 | 0.660.16 | 1.750.65 | 1.21 |
| NGC 4636 | 0.560.03 | 0.2107 | 107.310.6 | 4.650.06 | 1.640.62 | 0.410.08 | 1.090.35 | 0.76 |
| NGC 5102 | 0.260.02 | 0.5705 | 12.62.1 | 2.090.13 | 0.0040.002 | 0.0010.001 | 0.0030.001 | 0.007 |
| NGC 5846 | 0.210.01 | 0.2497 | 26.24.4 | 4.530.13 | 1.220.65 | 0.310.11 | 0.820.38 | 1.52 |
| NGC 7507 | 0.450.03 | 0.4891 | 33.34.4 | 4.380.19 | 0.880.59 | 0.220.11 | 0.580.36 | 0.55 |
e