Kilohertz QPO Frequency Anti-Correlated with mHz QPO Flux in 4U 1608-52
Abstract
We analysed Rossi X-ray Timing Explorer (RXTE) data of the low-mass X-ray binary and atoll source 4U 1608-52 obtained on March 3, 1996 in which the source simultaneously showed a strong single kilohertz quasi-periodic oscillation (QPO) around 840 Hz, and a 7.5 mHz QPO detected at energies below 5 keV. We find that the frequency of the kHz QPO is approximately anti-correlated with the 2–5 keV X-ray count rate associated with the mHz QPO. The average kHz QPO frequency varies by about 0.6 Hz (0.07%) during a mHz QPO cycle over which the average 2–5 keV count rate varies by about 60 c/s (4%). This is opposite to the frequency-count rate correlation observed in the same data on longer time scales and hence constitutes the first example of a sign reversal in the frequency-flux correlation related to the origin of the flux. Such a sign reversal is predicted by the radiative disk truncation model for the case where the flux variations originate on the neutron star but are not due to disk accretion rate fluctuations. The results support the nuclear burning interpretation of the mHz QPO, and the interpretation of the kHz QPO frequency as an indicator of the orbital frequency at the inner edge of the accretion disk. The varying radiative stresses on the inner disk exerted by the flux due to the quasi-periodic nuclear burning lead to changes in the inner disk radius and hence to the observed anti-correlation between kHz QPO frequency and X-ray count rate. There is a time lag of about ten seconds of the X-ray count rate relative to the kHz QPO frequency in terms of the anti-correlation we found between these two quantities, which could be caused by the propagation of the nuclear burning front on the neutron star away from the equatorial region.
1 Introduction
Kilohertz quasi-periodic oscillations (kHz QPOs) in X-ray flux have been observed from about 20 neutron star low mass X-ray binaries (LMXBs) (see van der Klis 2000 for a recent review). Their frequencies correspond to the dynamical time scale at radii of less than a few tens of kilometers, and are usually regarded as associated with the Keplerian orbital frequency of material at the inner disk edge. Observations indicate that when on a time scale of hours to days the accretion rate through the disk increases, the QPO frequency increases as well, indicating that the inner disk edge moves in. Evidence for this has been observed in the form of a positive correlation on these time scales of kHz QPO frequency with X-ray count rate for low luminosity LMXBs, i.e. ’atoll’ sources (see Mendez et al. 1999), and in the form of a similar correlation with curve length Sz along the track traced out in an X-ray color-color diagram for high luminosity LMXBs, i.e. ’Z’ sources, which in some cases corresponds to an anti-correlation between kHz QPO frequency and X-ray count rate (Wijnands et al. 1997; Homan et al. 2001; Yu, van der Klis & Jonker 2001).
The inner edge of the disk could be set by magnetosphere-disk interaction (Strohmayer et al. 1996, Zhang, Yu & Zhang 1998, Cui 2000, Campana 2000), and for sufficiently compact neutron stars with sufficiently weak magnetic field is certainly expected to be limited by the general relativistic marginally stable orbital radius. However, in the sonic point model for kHz QPOs (Miller, Lamb and Psaltis 1998, also Miller and Lamb 1995) radiative stresses provide the dominant disk truncation mechanism. In this description, removal of angular momentum from the flow by radiation drag, and the radial radiation force combine to set the inner disk radius and thereby the QPO frequency. For constant radiation, the disk moves in when the disk mass flow increases; for constant mass flow, the disk moves out when the radiation impinging upon the inner disk edge becomes more intense. Usually, disk mass flow and radiation change in concert; calculations show that under certain assumptions the inner disk radius will then move in and hence QPO frequency will go up when disk accretion and the resulting X-ray flux both increase, and vice versa (Miller et al. 1998). If disk accretion is not the only mechanism producing radiation more complicated relations can occur (van der Klis 2001).
A test of the role of radiative stress for disk truncation can be obtained by studying the changes in kHz QPO frequency resulting from changes in X-ray flux that are not due to disk mass flow changes. Two previous attempts at performing this test led to results that were somewhat ambiguous. (i) An anti-correlation was recently found between the kHz QPO frequency and the NBO (“normal branch oscillation”) count rate in Sco X-1 (22 Hz shift within the 1/6-s NBO cycle, Yu, van der Klis & Jonker 2000). However, Sco X-1 was in a state where such an anti-correlation is also seen for long-term flux changes that are presumably associated with disk flow changes. (ii) A 37-Hz decrease of the kHz QPO frequency was observed after an X-ray burst in Aquila X-1 (Zhang, Jahoda & Kelley et al. 1998; Yu, Li & Zhang et al. 1999). However, other similar bursts did not show this effect.
In this Letter, we show that in the atoll source 4U 1608–52 the kHz QPO frequency is clearly anti-correlated with the X-ray count rate variations associated with the 7.5 mHz QPO found by Revnivtsev, Churazov & Gilfanov et al. (2001). This QPO occurs in a narrow X-ray luminosity range and they suggested, among other possibilities, that these were due to a special mode of nuclear burning on the neutron star surface. This is the first clear-cut case of a sign reversal in the kHz QPO frequency vs. count rate correlation related to the basic process producing the radiation (disk accretion vs. nuclear burning). It provides strong evidence in favor of a role for radiative stresses in the disk truncation mechanism, as well as for the nuclear burning scenario for the mHz QPO.
2 Observations
We used data of 4U 1608–52 obtained with the Proportional Counter Array on-board the Rossi X-ray Timing Explorer on March 3, 1996. Previous analysis of this data set led to the discovery of a narrow kilohertz QPO in this source varying in frequency in the range 825–880 Hz with an rms amplitude around 6–8% (Berger et al. 1996). Further work showed that this QPO is in fact the lower-frequency one of a pair of kHz QPOs, and that on time scales of tens of minutes to hours the frequencies of both these QPOs usually have a strong positive correlation with X-ray count rate (Méndez et al. 1998, 1999). In this paper, we refer to this lower kHz QPO exclusively. Recently, Revnivtsev et al. (2001) discovered a 7.5 mHz QPO in this observation with a peak width of 2.6 Hz and an rms fractional amplitude around 1.85%. This mHz QPO is mostly evident in the energy range below 5 keV when the total source luminosity is between 0.07 and 0.1 times the Eddington luminosity. The total X-ray count rate during the observation was 3200 and 1600 c/s in the 2–60 and 2–5 keV bands, respectively; we use the former band for the kHz QPO measurements and the latter for monitoring the mHz QPO. The data consist of three separate contiguous segments covering 3400 s, 3500 s, and 1800 s. For the current analysis we use the Event mode data providing 1/8192 s time resolution and 64 spectral channels covering the entire 2–60 keV band.
3 Analysis and Results
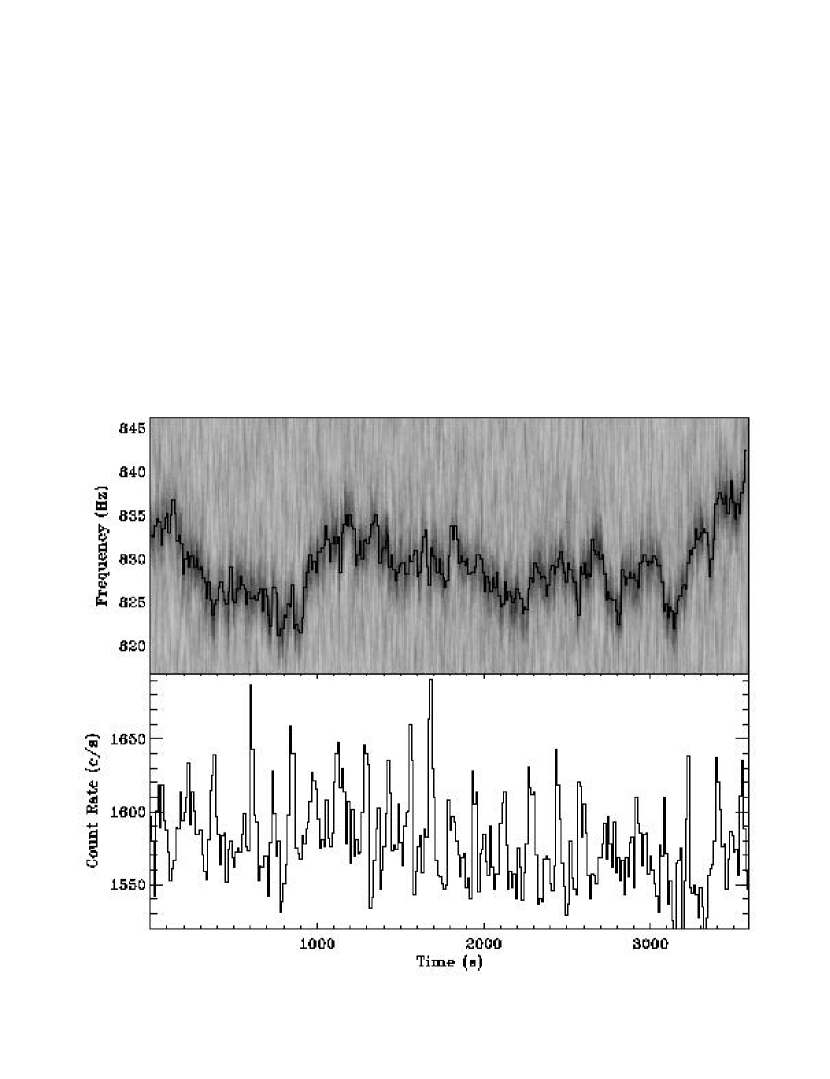
First, we calculated a series of Fourier power spectra using the 2–60 keV data re-binned to 1/4096 s. We used transform lengths of 4 s, which resulted in 0.25 Hz resolution power spectra with a Nyquist frequency of 2048 Hz. These were averaged in groups of three, to obtain one average spectrum per 12 s. The kHz QPO frequency in each average spectrum was taken to be that of the central bin of that 4.25-Hz wide frequency interval which contained the highest integrated Fourier power. The kHz QPO frequency can not be determined in this way for the second half of the first segment, where the kHz QPO is weak (see figure 2a in Berger et al. 1996). For this reason we only used the first 1000 s of this segment. As an example, the kHz QPO evolution and the corresponding 2–5 keV light curve of the second segment, both at 12 s time resolution, are shown in Fig. 1. The frequency of the mHz QPO (7.52.6 mHz) corresponds to time scales between 100 and 200 s. On time scales longer than that, we find in accordance with previous work (§2), that there is a strong positive correlation between kHz QPO frequency and X-ray count rate. Before further analysis, in order to remove the effect of the variations on these longer time scales, we detrended both time series by subtracting a 300-s running average.
The auto-correlation of the 2–5 keV light curves has a full width of 20–30 s, which represents the average duration of the individual mHz QPO “pulses”. With this in mind, we identified the peaks of the individual mHz QPO pulses in the detrended 12-s resolution 2–5 keV light curve by finding the highest bins in a 108-s window which was stepped through the data with 12-s steps. We found 41 different maxima in this way; two of these were closer than 108 s to the nearest peak and were eliminated from further analysis, leaving a total of 39 identified well-separated mHz QPO pulses.
We aligned these pulses in time using their peaks as fiducial points. Then, we determined the average evolution of count rate and kHz QPO frequency in the 108-s window around these peaks by averaging the corresponding segments of the detrended count rate and kHz QPO frequency time series. The result is shown in Fig. 2. The average kHz QPO frequency varies by about 0.6 Hz during the mHz QPO cycle, in rough anti-correlation to the 55 c/s average 2–5 keV count rate variation. On closer inspection, it turns out that the maximum average X-ray count rate and the minimum average kHz QPO frequency are not exactly aligned. Based on the overall appearance of the average kHz QPO frequency variation, its minimum seems to occur about ten seconds before the maximum in average count rate. In Fig. 3 we plotted the average kHz QPO frequency vs. the average X-ray count rate around the mHz QPO cycle. While the count rate is rising (filled circles) the frequency decreases along a systematically lower path than the one along which it increases again when the count rate is falling (open squares). We did not detect a significant change in kHz QPO amplitude around the mHz QPO cycle, with a rough 1 sigma upper limit on the change in fractional rms amplitude of 0.4% (the total kHz QPO rms is 7.5%).
4 Discussion and Conclusion
We have studied the evolution of the lower kHz QPO as a function of the phase of the 7.5 mHz QPO displayed by 4U 1608–52 when its luminosity is about 0.1 . The average kHz QPO frequency depends on the mHz QPO phase. It varies by about 0.6 Hz, or 0.07% of the average frequency, around the mHz QPO cycle, in rough anti-correlation to the average 2–5 keV count rate, which varies by about 60 c/s, or 4% of the average 2–5 keV count rate (or approximately 2% of the entire PCA 2–60 keV count rate). We have also found that in this anti-correlated variation the kHz QPO frequency leads the count rate by about ten seconds. On longer time scales (hours), the kHz QPO frequency in these same observations was already known to be positively correlated with the X-ray count rate and X-ray luminosity (Mendez et al. 1999), and our analysis confirms this. The fact that we find an anti-correlation on the 7.5 mHz QPO time scale, while simultaneous count rate changes not related to the mHz QPO produce the usual correlated variations in kHz QPO frequency demonstrates conclusively that another mechanism than that responsible for the usual count rate variations underlies the mHz QPO.
The mHz QPO (Revnivtsev et al. 2001) occurs only within a narrow range of source luminosity and disappears after X-ray bursts. Its spectrum is rather soft and consistent with a blackbody. For these reasons, Revnivtsev et al. (2001) suggested that the mHz QPO could be due to a special mode of nuclear burning on the neutron star surface, although an origin due to processes in the accretion disk could not be ruled out. We suggest that the simplest explanation for the anti-correlation between kHz QPO frequency and mHz QPO count rate we report here is, that the mHz QPO is generated inside the inner disk edge by the mechanism proposed by Revnivtsev et al. (2001), and that the kHz QPO frequency is related to the Keplerian frequency at the inner edge of the disk, whose radius in turn is set by the radiative disk truncation mechanism proposed by Miller et al. (1998; see §1). If instead the mHz QPO were produced by a modulation of the disk accretion rate, a positive correlation between kHz QPO frequency and mHz QPO X-ray flux would be predicted, contrary to what we observe. Indeed, such a positive correlation is seen for the longer-timescale flux variations.
If the mHz QPO indeed originates near the neutron star surface, i.e. inside the inner disk radius, an anti-correlation between the orbital frequency of disk material and the mHz QPO flux is a prediction of the radiative disk truncation mechanism, as the inner disk edge will move out when the X-ray flux impinging upon it increases, due to both an increased radiation drag and an increased radial radiation force (Miller et al. 1998). Following their equation (39) for the effect of the radial radiation force, taking the luminosity of the neutron star as 0.1 , a 2% change in the neutron star luminosity will introduce a change in orbital frequency of about 0.1%, i.e. 0.8 Hz for an orbital frequency of 830 Hz, or 1.1 Hz for an orbital frequency of 1060 Hz for the case when the twin peak frequency separation is taken at a constant 230 Hz (see Méndez et al. 1998). Radiation-drag effects will enhance the change in the kHz QPO frequency; also the change in neutron star luminosity will be larger than the 2% we adopted if not all the source flux originates from the neutron star surface (in most models, the hard flux originates elsewhere). So, quantitatively the theoretical expectation is somewhat larger than the 0.6 Hz we observe. As suggested below, a more detailed analysis of the emission pattern caused by the nuclear burning may explain this.
The estimate of the frequency amplitude we made above was based on the assumption that the relative change in mHz QPO flux we observe on Earth is the same as that in the flux towards the inner disk edge. This can not be true if the mHz QPO is caused by local thermonuclear fires propagating on the neutron star. If the fires originate mostly in the equatorial region, where most of the accreted matter piles up, and then expand and propagate away, then the flux amplitude experienced by the disk would be less than that observed, and the radiative stresses exerted on the inner disk edge would reach their maximum before the observed X-ray flux does. This could explain both the lower than expected frequency amplitude and the time lag between the X-ray count rate and the kHz QPO frequency which we observed.
In this paper we have demonstrated that study of the correlation between low-frequency variability and high frequency QPOs can provide strong constraints on the origin of both variability modes. Further similar studies of the relations between low-frequency variability and, e.g., kHz QPOs in neutron star X-ray binaries and high frequency QPOs in black hole X-ray binaries, could potentially provide considerable additional insight into the nature of both QPOs and broad-band variability in these objects.
References
- Berger (1996) Berger, M., van der Klis, M., van Paradijs, J. & Lewin, W. H. G. et al. 1996, ApJ, 469, L13
- Cui (2000) Cui, W. ApJ, 534, 31
- Campana (2000) Campana, S. ApJ, 534, 79
- Homan et al. (2001) Homan, J., van der Klis, M., Jonker, P.G., Wijnands, R., Kuulkers, E., Méndez, M., Lewin, W.H.G., 2001, ApJ submitted; astro-ph/0104323
- Méndez (1998) Méndez, M., van der Klis, M., Wijnands, R., Ford, E. C., van Paradijs, J. & Vaughan, B.A. 1998, ApJ, 505, L23
- Méndez (1999) Méndez, M., van der Klis, M., Ford, E. C., Wijnands, R., van Paradijs, J. 1999, ApJ, 511, L49
- Miller & Lamb (1993) Miller, C. M.& Lamb, F. K. 1993, ApJ, 413, L43
- Miller, Lamb & Psaltis (1998) Miller, C. M., Lamb, F. K. & Psaltis, D. 1998, ApJ, 508, 791
- Revnivtsev et al. (2001) Revnivtsev, M., Churazov, E. , Gilfanov, M. & Sunyaev, R. 2001, A&A, 372, 138
- Strohmayer et al. (1996) Strohmayer, T. E., Zhang, W., Swank, J. H., Smale, A., Titarchuk, L., Day, C. & Lee 1996, ApJ, 469,, L9
- van der Klis (2000) van der Klis, M. 2000, ARA&A, 38, 717
- van der Klis (2001) van der Klis, M. 2001, ApJ, 561, 943
- Wijnands et al. (1997) Wijnands, R., Homan, J., van der Klis, M., Méndez, M., Kuulkers, E., et al., 1997, ApJ, 490, L157
- Yu, Li, Zhang & Zhang (1999) Yu, W., Li, T., Zhang, W. & Zhang, S. N. 1999, ApJ, 512, L35
- Yu, van der Klis & Jonker (2001) Yu, W. & van der Klis, M., Jonker, P. 2001, ApJ, 559, L29
- Zhang, Jahoda, Kelly, et al. (1998) Zhang, W., Jahoda, K., Kelly, R. L., Strohmayer, T. E., Swank, J. H. & Zhang, S. N. 1998, ApJ, 495, L9
- Zhang, Yu & Zhang (1998) Zhang, S. N., Yu, W. & Zhang, W. 1998, ApJ, 494, L71