Mass/Light Variations with Environment 11institutetext: University of Hawaii, Honolulu HI 96822 USA
Mass/Light Variations with Environment
Abstract
In the local part of the universe, a majority of the total mass is in only a small number of groups with short dynamical times. The Virgo Cluster dominates far out of proportion to its contribution in light. Ninety percent of the total mass is in groups with .
1 Introduction
It would hardly be surprising if the relationship between mass and light varies with environment, even if structures form from an invariant baryon to dark matter fractionation. Dark matter could be more dispersed than the baryons that are manifested in stars or detectable gas. This possible differentiation would create a ‘bias’ between what is seen and what exists [1]. Recent modelling [2,3] suggests there could be a complex relationship betwen mass and light, that dark matter may be underrepresented by light at both extremes of low density and high density. Mass-to-light may grow with scale around galaxies to an asymptotic limit [4]. This paper presents observational evidence from the motions of galaxies that there are mass-to-light differences with environment.
2 Galaxy Groups
Dark halos extend beyond the observed baryonic components of galaxies so there cannot be a sufficient understanding of the distribution of dark matter from studies of the internal kinematics of galaxies. The motions of galaxies relative to each other provide a probe of the distribution of matter on the scales of the separations between objects.
This discussion will begin with a new look at old data. Masses can be estimated for groups of galaxies using the virial theorem. To be strictly applicable, the group should be relaxed. However, within a possible systematic of a factor of two, the virial theorem gives an estimate of group masses as long as the basic assumption is met that the group is bound.
Candidate groups can be found among the structures defined by a dendogram analysis [5]. Within a sample of galaxies, the pair is selected with the extreme of an appropriate property, say, the largest product luminosity / separation2. This pair is then considered as a single unit and the procedure is repeated. After steps, all galaxies in the sample are merged. At each merger step, a luminosity density can be characterized by the sum of the light of the components divided by the cube of the separation at this step. Now the timescale for separation of an overdensity from the cosmic expansion and its collapse depends on the inverse square root of the mass overdensity. If there is a constant relationship between mass and light, then luminosity is a standin for mass. Then, in a plot of the merger dendogram as a function of luminosity density there would be a discrete cut that would distinguish entities that could have collapsed within the age of the universe.
A constant relationship between mass and light remains to be demonstrated and it would not be appropriate to specify such a relationship since this is to be a product of the study. However an independent observable monitors the probability that a candidate group is bound: the crossing time - a characteristic dimension for the group divided by the velocity dispersion. Assume a cut on the luminosity density dendogram. If that cut is at a low density, there would be a lot of entities above the cut with crossing times longer than the age of the universe. If the cut is at a very high density, the entities that survive the cut would all have crossing times much shorter than the age of the universe. Like Goldilocks, we try to find a cut that is just right, characterized by crossing times that scatter up to, but not above, the age of the universe. The details of the choice of cut and consequent properties of a sample of groups within the Local Supercluster have been discussed [5]. The Nearby Galaxies Catalog [6] includes these group affiliations. This catalog also records entities as ‘associations’ if they satisfy a luminosity density threshold an order of magnitude lower than the cut that specifies groups. This more lax prescription saves a more extended list of group candidates, a matter of interest later in the discussion.
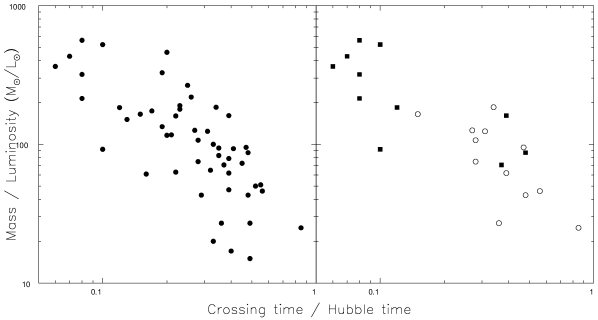
A fresh look at this old material reveals that there are strong correlations between mass-to-blue-light ratio () and either crossing time or morphology. These correlations are seen in Figure 1 where is plotted against crossing time for a sample of 49 groups with at least 5 members that lie within Mpc. In the panel at the right, only groups with at least 6 known members with are considered (here, H km s-1 Mpc-1 and ).
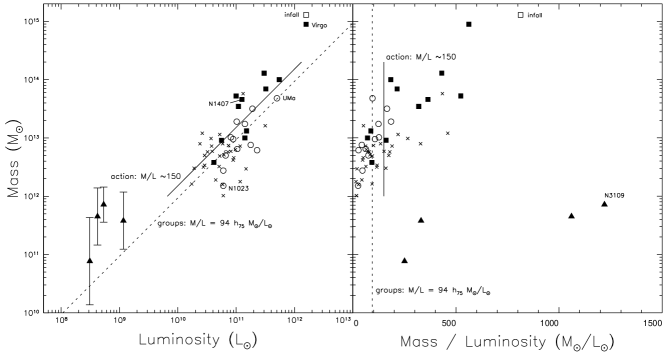
Fig. 1 reveals that groups predominantly composed of early type galaxies tend strongly to have short crossing times and high . Groups of predominantly late type galaxies inevitably have longer crossing times and lower . The range in values extends over more than a decade. The trend in Fig. 1 has too big an amplitude be explained by correlated errors in velocity dispersion in the calculation of and crossing time. The correlation between group morphology and crossing time rests on independent information. The same information is seen in Figure 2. The symbols again denote group morphology. There is a trend with group mass, with a larger fraction of early type groups toward higher masses. The consequence is a roll off toward a shallow slope between mass and light at high mass. It is seen, though, that at intermediate masses around there is a substantial range in values. The variance is strongly correlated with both crossing time and group morphology.
3 Numerical Action Modelling
The distribution of dark matter on scales larger than groups is recorded in the slosh of galaxies about Hubble flow on scales of megaparsecs to tens of megaparsecs. The general properties of the gravitational field can be recovered through the construction of plausible galaxy orbits with mixed boundary condition constraints [7,8]. It is to be appreciated that, while to date the specifics of individual orbits are poorly constrained by this modelling, mean mass densities are tightly constrained. In the general field, is found from this modelling [9] a result indicated by the solid lines in Fig. 2. This value is 50% larger than the mean value derived from the group analysis which may be reasonable given the reference to scales larger than the domain of bound groups.
The action modelling of the Local Supercluster region raised an important issue regarding variations with environment. There is specific information about the infall of galaxies toward the Virgo Cluster. Galaxies are entering the cluster with 1-D velocities in excess of 1500 km s-1 and the current zero-velocity shell with respect to the cluster is at about radius from the cluster center. It is impossible to provide an adequate description of this infall with a mass assigned to the Virgo Cluster in accordance with the low value found overall. The infall pattern requires a mass of and [9]. These values are large but the mass relates to the cluster on a scale in excess of 2 Mpc radius. This datum is recorded by the open square in Fig. 2. The key constraints are (a) a high mass is required in the cluster to explain the high infall velocities in the immediate vicinity of the cluster, but (b) if there were a significant amount of additional mass betwen us and the cluster then we would have a higher retardation from Hubble flow.
4 Groups of Dwarfs
It was mentioned that the group analysis [5] also identified entities called associations that pass a luminosity density cut an order of magnitude fainter than the group cut. There are a small fraction of entities identified this way that deserve special attention. There are a few associations comprised of only dwarf galaxies which would easily have been called groups if only separations were considered (ie, luminosity not a factor). Velocity dispersions for these associations are extremely low, of order 20 km s-1, so if these entities are bound then masses are modest, of order . However there is little light so values range from to .
These proposed groups have been discussed [10] in the context of a plausible galaxy formation scenario. The details of the formation mechanism will not be pursued here but the generic possibility is raised that there could be many low mass dark halos with little or no accompanying stars or gas. It would follow from this hypothesis that there could be environments with some star formation, enough to provide probes of the potential, but still so little that is large.
The four candidate dwarf groups that are represented at the low mass end of Fig 2 are identified and details on their properties are given in reference [10]. The critical issue is whether the proposed groups are bound because, if so, then values are surely high. It is to be noted that these 4 candidate groups are all within 5 Mpc and within this distance beyond the Local Group (restricting to high latitudes) there are only 4 ‘normal’ groups with luminous galaxies. There is the prospect that bound groups of dwarfs are numerically common, though they may contribute only a small fraction of the total mass of the universe. One could suspect that dark matter structures devoid of stars would also exist, which would be in line with the original ‘biasing’ idea. However the action analysis suggests that such structures would not contribute too much to the overall mass inventory.
5 Conclusions
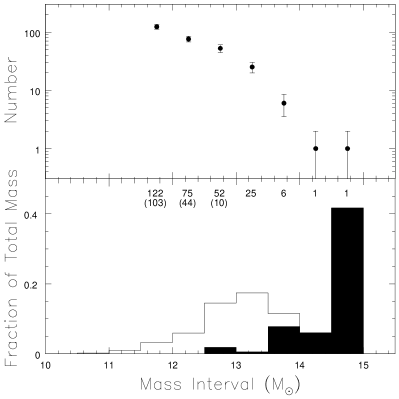
Figure 3 shows the inventory of the clustered mass in the local region. Mass contributions are summed over all groups and individual galaxies within a distance of Mpc and with (distances based on a numerical action kinematic model). In the case of groups, masses come from application of the virial theorem. In the instances of pairs or triples where the observed dispersion in velocities is dominated by measurement uncertainties, or in the case of single galaxies, masses are inferred assuming , a round off of the mean result for groups represented by the dotted lines in Fig 2. The volume contains a total luminosity of in cataloged galaxies and a total mass of (only 10% of this mass total is inferred from the assumption). Within this nearby volume, there should be reasonable completion down to . The overall is consistent with [9]. The mean density in this local region is gm/cm3, indicating this region has twice the cosmic mean density if . Hence our census accounts for all the mass anticipated by the numerical action dynamical modelling. There are two striking points to note with Fig 3. One point is that 90% of the mass is in bound entities with . The other point is that the Virgo Cluster, with 15% of the light in this volume, has over 40% of the mass! Of course, the statistics above are inadequate with this local sample (Fornax Cluster is the second massive entity).
The information provided by groups about the distribution of dark matter on scales of hundreds of kiloparsecs and the information provided by galaxy flows about dark matter on scales up to tens of megaparsecs give rise to a consistent picture. values in dynamically evolved regions can be an order of magnitude higher than in the great majority of places that are dynamically young. The evidence from both galaxy motions and an inventory of groups suggests overall, consistent with . Similar results are found from wide field weak lensing studies [11]. Within the high latitude, inner 25 Mpc region of the group sample, roughly 60% of the mass is in 14 low crossing time groups dominated by early galaxy types that contribute a quarter of the light. We seem to live in a curious universe where a majority of the clumped matter is in the modest percentage of locations with crossing times Gyr.
Groups containing familiar luminous galaxies all have masses above . Candidate groups of only dwarf galaxies are identified with masses near this limit. These associations are probably bound, whence they would contain mostly dark matter. It is reasonable to speculate that there are low mass halos without any stars or gas. However most of the mass of the universe seems to be in collapsed regions with .
References
- (1) Kaiser, N. ApJ, 284, L9 (1984)
- (2) Blanton, M., Cen, R., Ostriker, J.P., & Strauss, M.A. ApJ, 522, 590 (1999)
- (3) Somerville, R.S. et al. MNRAS, 320, 289 (2001)
- (4) Bahcall, N.A., Lubin, L.M., & Dorman, V. ApJ, 447, L81 (1995)
- (5) Tully, R.B. ApJ, 321, 280 (1987)
- (6) Tully, R.B. Nearby Galaxies Catalog, Cambridge University Press (1988)
- (7) Peebles, P.J.E. ApJ, 344, L53 (1989)
- (8) Shaya, E.J., Peebles, P.J.E., & Tully, R.B. ApJ, 454, 15 (1995)
- (9) Tully, R.B., & Shaya, R.B. Evolution of Large-Scale Structure, astro-ph/9810298
- (10) Tully, R.B., Somerville, R., Trentham, N., & Verheijen, M. astro-ph/0107538
- (11) Wilson, G., Kaiser, N., & Luppino, G.A. (2001), astro-ph/0102396