The Masses of Lyman Break Galaxies
The Masses of Lyman Break Galaxies
Abstract
Data on galaxies at high redshift, identified by the Lyman-break photometric technique, can teach us about how galaxies form and evolve. The stellar masses and other properties of such Lyman break galaxies (LBGs) depend sensitively on the details of star formation. In this paper we consider three different star formation prescriptions, and use semi-analytic methods applied to the now-standard CDM theory of hierarchical structure formation to show how these assumptions about star formation affect the predicted masses of the stars in these galaxies and the masses of the dark matter halos that host them. We find that, within the rather large uncertainties, recent estimates of the stellar masses of LBGs from multi-color photometry are consistent with the predictions of all three models. However, the estimated stellar masses are more consistent with the predictions of two of the models in which star formation is accelerated at high redshifts , and of these models the one in which many of the LBGs are merger-driven starbursts is also more consistent with indications that many high redshift galaxies are gas rich. The clustering properties of LBGs have put some constraints on the masses of their host halos, but due to similarities in the halo occupation of the three models we consider and degeneracies between model parameters, current constraints are not yet sufficient to distinguish between realistic models.
1 Introduction
A great deal of effort devoted to determining the cosmological parameters has recently paid off. But, although there is good evidence that the cosmological parameters are roughly , , and , and that CDM with these parameters is a good fit to the observed universe isss1 , this theory does not make unique predictions regarding the masses and other properties of galaxies at high redshift. Galaxy properties in cosmological theories also depend on assumptions about uncertain aspects of star formation, supernova feedback, and dust obscuration. Here we will focus on star formation.
We consider three different models of star formation, differing in the way that the star formation rate depends on galaxy properties, and discuss the implications for masses, clustering, and other properties of Lyman break galaxies (LBGs) in semi-analytic models. These models spf all assume exactly the same underlying CDM model with the parameters above, so the properties of the dark matter halos at any given redshift and the halo merging histories are the same. We also make the same assumptions in each model regarding the initial mass function (IMF), which we assume to be Salpeter between 0.1 and 100 . We use the GISSEL00 stellar population synthesis models of Bruzual & Charlot bc with solar metallicity, and a simple model for dust obscuration, in which the optical depth is a power-law function of the unobscured ultraviolet luminosity:
| (1) |
with an adjustable parameter and wangheckman .
The modern approach to semi-analytic modeling was pioneered by White & Frenk wf91 , and further developed by them and their collaborators in kwg93 and cole94 . In sp , we reviewed and extended this work, and applied it to high-redshift galaxies spf using three simplified models of star formation. The three star formation models we consider span the range of models proposed for high redshift galaxy formation.
The simplest model, termed Constant Efficiency Quiescent, assumes that the quiescent star formation rate per unit mass of cold gas is constant:
| (2) |
We showed in spf that the resulting predictions of this model are similar to those of cole94 and to more detailed treatment baugh98 ; governato98 from the same group that included starbursts from major mergers. An alternative Accelerated Quiescent model assumes that
| (3) |
The predictions of our AQ model are like those of kwg93 even though those authors included starbursts from major mergers, because the above star formation prescription (based on data on star formation in nearby galaxies kennicutt ) converts gas to stars so efficiently at high redshifts (since typically ). Finally, we consider a Collisional StarBurst model in which the quiescent star formation efficiency is constant, but where there is also a burst mode of star formation triggered by galaxy interactions:
| (4) |
where is due to bursts in merging galaxies. The efficiency of star formation in these bursts is scaled according to a model based on hydrodynamical simulations mihoshernquist , in which the efficiency scales as a power-law function of the mass ratio of the merger (see spf for details). We find in our CSB semi-analytic model that most of the star formation at redshifts above unity occurs in starbursts driven by minor mergers, in which the merging satellite has mass less than that of the central galaxy. As noted, our CEQ model is similar to the Durham group model of several years ago baugh98 . At this conference, Baugh presented preliminary results from an alternative model that is similar to our CSB model.
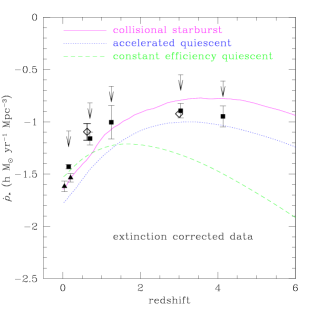
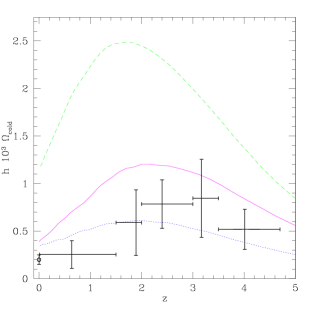
Figure 1a shows the star formation rate density as a function of redshift for these three models. The CEQ model does not produce as many stars at high redshifts as the extinction-corrected observations indicate (see spf for references), while both AQ and CSB models are acceptable in this regard, indicating that star formation at high redshift must be more efficient than locally. This argument is reinforced by the failure of the CEQ model to produce as many stars at as are indicated by the fossil evidence (see Fig. 12 of spf ).
However, the AQ model converts gas to stars so efficiently that it may not have as much neutral hydrogen at as is indicated by the data on damped Lyman-alpha systems — see Fig. 1b. The AQ model may also not have enough gas to fuel quasars at high redshifts kaufhaehnelt , while the CSB model seems acceptable.
Further evidence that favors the CSB over the AQ model comes from the predicted LBG luminosity function. The CSB model predicts as many bright LBGs as are observed, although it slightly overpredicts the number of fainter ones, possibly because the dust obscuration prescription Eq. (1) is unrealistic in predicting very little extinction for lower-luminosity galaxies. But the AQ luminosity function predicts fewer bright LBGs than observed at , and far fewer than observed at (see Figs. 4-7 of spf ). Bright LBGs only occur in massive halos in the CEQ and AQ models, and there are fewer such halos at higher redshifts.
2 LBG Masses
At this conference we have seen that analysis of the Hubble Deep Field data on LBGs papovich indicates that their stellar masses lie in the range , with a geometric mean of (assuming a Salpeter IMF and solar metallicity, as we have done). Ground-based data on somewhat brighter LBGs indicate stellar masses in the same range, with a slightly higher median (see especially Fig. 10b of shapley ). The predicted ranges of stellar masses and halo masses for all three of our models are shown in Fig. 2. (The results for the CSB model are similar to those represented by the histogram in the top right panel of Fig. 16 of spf , except that here they for while there they were for .) It is interesting that the distributions in the three models have similar medians, but very different widths. Perhaps counter-intuitively, the CSB model actually has more galaxies with large stellar masses than the other models! This is because there is more star formation activity at in this model. However, in interpreting Fig. 2 it is important to keep in mind that the LBGs are predicted to be systematically fainter at a given stellar mass in the CEQ model.


It may therefore be more illuminating to look at the predicted relationship between stellar mass and rest-frame UV luminosity in all three models, shown in Fig. 3. The stellar masses deduced from the HDF-N data (see the lower right panel of Fig. 17 of papovich ) agree well in zero point and slope with the predictions of the CSB and AQ models, but the stellar masses in the CEQ model are higher by about a factor of 2.5. However, the ground based data shapley do not show as clear a correlation of stellar mass with UV luminosity. Also, the deduced stellar masses are sensitive to the IMF and dust extinction, so there are large uncertainties making it impossible to rule out any of the models on this basis.
3 LBG Clustering
In principle, another way of estimating the masses of LBGs is via their clustering, since dark matter halos of higher mass are expected to be more correlated (e.g. mowhite ). However, collisions between lower-mass halos are also more correlated than the halos themselves, since the collisions occur preferentially in denser regions kolatt — thus knowledge of the LBG host halo masses from their clustering properties does not uniquely specify whether the LBGs are associated with galaxies in massive subhalos or with galaxy collisions. When we used N-body simulations combined with semi-analytic models to compute clustering properties of LBGs, we risa found that the CEQ, AQ, and CSB models all predicted similar LBG clustering on both short and long scales, in general agreement with the available data — though CEQ produces the most clustered galaxies and is only marginally consistent. The similarity of LBG clustering properties in the three models reflects the larger similarity than might be expected in the dark matter halos that they occupy; we explored the physical reasons for this in risa . However, the detailed clustering properties are affected by model ingredients that are still quite uncertain — for example, the efficiency of converting gas into stars in a galaxy collision — so further theoretical constraints on these parameters combined with recently improved observational constraints on LBG clustering may improve the potential to distinguish between modes of star formation.
A simple analytic model that constrains the dark matter halo masses hosting LBGs using data on their number density and clustering has shown that, if the typical number of galaxies in a halo of mass is for , current observational constraints on this model indicate that LBGs occupy halos greater than about , with a power-law occupation of , so that typical LBGs reside in halos of a few bullockws . Such a model can also be used to compare the host halo masses of different populations of objects, and has been used moustakass to show that highly-clustered EROs inhabit halos that are an order of magnitude or two more massive than LBGs. The only possibly discrepant data on LBG clustering is the suggestion that the correlation length is a strong function of LBG brightness giavalisco , in disagreement with each of our models risa . However, this interpretation is controversial (cf. risa ; arnouts ).
4 Conclusions
While the masses of LBGs would seem to provide key information about their nature, due to the considerable uncertainties in our modeling and in deriving stellar or halo masses from the data, it is not currently possible to rule out any of the three very different recipes for star formation considered here on this basis. All three models are also roughly consistent with recent observational estimates of LBG clustering. However, the CEQ model predicts systematically higher stellar masses and also far too few bright LBGs especially at higher redshifts, and the AQ model may use up gas too efficiently to be consistent with other data. One way to check whether it is really true that many of the high-redshift bright galaxies are collision-driven starbursts is to see whether the morphologies of these objects resemble those produced in hydrodynamical simulations of interacting gas-rich galaxies, which are presently underway (see racheldisks for preliminary results).
References
- (1) J.R. Primack, ‘The Nature of Dark Matter’. In: Proc. International School of Space Science 2001, ed. A. Morselli (Frascati Physics Series, 2002), astro-ph/0112255
- (2) R.S. Somerville, J.R. Primack, S.M. Faber: MNRAS 320, 504 (2001)
- (3) G. Bruzual, S. Charlot: ApJ 405, 538 (1993)
- (4) B. Wang, T. Heckman: ApJ 457, 645 (1996)
- (5) S.D.M. White, C. Frenk: ApJ 379, 52 (1991)
- (6) G. Kauffmann, S.D.M. White, B. Guiderdoni: MNRAS 264, 201 (1993)
- (7) S. Cole et al.: MNRAS 271, 781 (1994)
- (8) R.S. Somerville, J.R. Primack: MNRAS 310, 1087 (1999)
- (9) C.M. Baugh, S. Cole, C.S. Frenk, C.G. Lacey: ApJ 498, 504 (1998)
- (10) F. Governato et al.: Nature 392, 359 (1998)
- (11) R. Kennicutt: ApJ 498, 181 (1998)
- (12) J.C. Mihos, L. Hernquist: ApJ 425, L13 (1994); 448, 41 (1995); 464, 641 (1996)
- (13) G. Kauffmann, M. Haehnelt: MNRAS 311, 576 (2000)
- (14) C. Papovich, M. Dickinson, H.C. Ferguson: ApJ 559, 620 (2001)
- (15) A.E. Shapley et al.: astro-ph/0107324 (2001)
- (16) H.-J. Mo, S.D.M. White: MNRAS 282, 347 (1996)
- (17) T.S. Kolatt et al.: ApJ 523, L109 (1999)
- (18) R.H. Wechsler, R.S. Somerville, J.S. Bullock, T.S. Kolatt, J.R. Primack, G.R. Blumenthal, A. Dekel: ApJ, 554, 85 (2001)
- (19) J.S. Bullock, R.H. Wechsler, R.S. Somerville: MNRAS, 329, 246 (2002)
- (20) L.A. Moustakas, R.S. Somerville: ApJ accepted, astro-ph/0110584
- (21) M. Giavalisco, M. Dickinson: ApJ 550, 177 (2001)
- (22) S. Arnouts et al.: MNRAS 310, 540 (1999)
- (23) R.S. Somerville: ‘Disks at high redshift: interactions, mergers, and starbursts’. In: Galaxy Disks and Disk Galaxies, (ASP Conference Series, Vol. 230) eds. J.G. Funes, S.J., and E.M. Corsini, p. 477 (2001)