Studies of Structure Formation and Cosmology with Galaxy Cluster Surveys
Abstract
Surveys of galaxy clusters provide a promising method of testing models of structure formation in the universe. Within the context of our standard structure formation scenario, surveys provide measurements of the geometry of the universe and the nature of the dark energy and dark matter. Cluster catalogues will be constructed using some combination of X–ray, optical/near–IR, and mm or cm-wave observations. These catalogues will be used to study the cluster redshift and mass distributions along with the correlations of the cluster spatial distribution. These measurements probe the volume–redshift relation, the power spectrum of density fluctuations and the evolution of galaxy cluster abundance. All are sensitive to the amount of dark matter , the amount of dark energy , the equation of state of the dark energy and any other parameter, which affects the expansion history of the universe.
Departments of Astronomy and Physics; University of Illinois, 1002 W. Green St.; Urbana, IL 61801 USA
1. Introduction
Over the last few years, cosmological constraints from Type Ia SNe (Schmidt et al. 1998; Perlmutter et al. 1999), cluster baryon fractions (White et al. 1993a; David et al. 1995; White & Fabian 1995; Burles & Tytler 1998; Mohr et al. 1999; Arnaud & Evrard 1999), the cosmic microwave background (CMB) anisotropy (Hanany et al. 2000; Jaffe et al 2000; Lange et al. 2001) and other complementary measures (Bahcall et al. 1999, and references therein) have pointed toward a dark energy dominated universe (), with a significant dark matter component () and a trace of baryonic matter. The recent detections of the 2nd and 3rd acoustic peaks in the CMB anisotropy (Halverson et al. 2001; Netterfield et al. 2001; Pryke et al. 2001) lend additional support to these conclusions and bring several important questions into sharp focus. At the dawn of this new era of precision cosmology, the important questions concern the very nature of the dark matter (collisionless or self-interacting) and the characteristics of the dark energy (which we can parametrize by the equation of state parameter , where the pressure ).
Recent theoretical and experimental developments make future cosmological studies that utilize galaxy clusters extremely promising. One particularly promising approach is the use of galaxy cluster surveys, which enable one to measure the cluster redshift distribution and the correlations in the cluster spatial distribution. Surveys are now being carried out using cluster X–ray emission, the near-IR/optical light from cluster galaxies, the distorted morphologies and alignment of background galaxies, and the effect that hot electrons within clusters have on the cosmic microwave background (the so-called Sunyaev-Zel’dovich effect or SZE; Sunyaev & Zel’dovich 1972). To use these surveys to full effect in cosmology studies, we must first test the standard model of structure formation. In addition, we must sharpen our understanding of the nature and evolution of galaxy cluster internal structure and the relationships between cluster observables (i.e. SZE decrement, X-ray emission, galaxy light) and the cluster halo mass.
In these proceedings we describe a fundamental test of the hierarchical structure formation model, and then we examine in some detail the cosmological dependences of the cluster redshift distribution. We end by highlighting some of the challenges that currently exist in using cluster surveys to precisely constrain cosmological quantities like the equation of state of the dark energy.
2. Structure Formation Constraints from High- Cluster Surveys
Because of the nature of the power spectrum of density fluctuations, we expect that structure formation proceeded hierarchically from small to ever larger scales (i.e. Peebles 1993 and references therein). Low mass galaxy clusters () are expected to first emerge at redshifts of to within the currently favored model. Higher mass clusters () appear later at lower redshifts. An appealingly powerful test of structure formation would be to probe the cluster population with sufficient sensitivity to detect the first emerging low mass systems. High sensitivity SZE surveys are particularly well suited for studies of the high redshift galaxy cluster population, because of the redshift independence of the decrement :
| (1) |
where is the cosmic microwave background (CMB) temperature, is the Thomson cross section, is the electron rest mass, is the speed of light, is the Boltzmann constant and and are the electron number density and temperature. In other words, if one has a galaxy cluster described by a particular distribution of and , the magnitude of the SZE distortion of the CMB along a line of sight passing through the cluster would be independent of the cluster redshift. This together with our expectation for how cluster structure evolves with redshift, makes SZE instruments capable of detecting clusters of a particular mass no matter what that cluster’s redshift (Holder et al. 2000). This is a particularly power approach for determining the redshifts when galaxy clusters first emerged.
In contrast to this SZE behavior, cluster X-ray emission (along with any emission) suffers from cosmological dimming. The X–ray surface brightness is
| (2) |
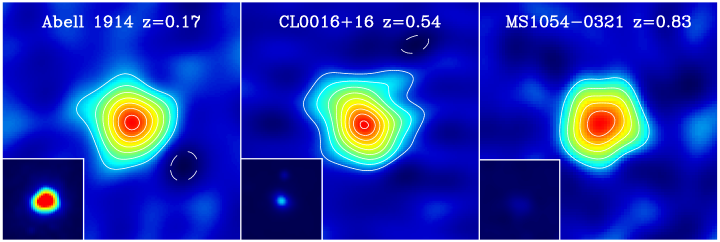
where , is the proton rest mass, is the intracluster medium mass density, and is the temperature dependent X–ray emission coefficient describing bremsstrahlung and line emission. This strikingly different behavior of X–ray emission and the SZE is qualitatively illustrated in Figure 1 by the panel of interferometric SZE observations (with X–ray image insets) of three clusters of comparable mass at redshifts , 0.5 and 0.8. The SZE contours and X-ray color scales are the same for all three clusters. Although the cluster SZE signal is similar at all redshifts, the X–ray emission dims rapidly, as expected.
High sensitivity interferometric SZE surveys carried out with a new generation of SZE optimized interferometers will soon carry out the fundamental test of hierarchical structure formation described above. Three such instruments, the SZ-Array, AMiBA and AMI (all described elsewhere in this volume), are all funded and currently in various stages of construction.
3. Cosmological Constraints from the Cluster Redshift Distribution
Within the context of the standard structure formation scenario, it is possible to use cluster surveys to measure cosmological parameters. The abundance of galaxy clusters and its redshift evolution have been recognized as sensitive probes of the normalization of the power spectrum and the mean matter density in the nearby universe (White et al. 1993b; Viana & Liddle 1999). The parameter degeneracy between , the rms amplitude of mass fluctuations in the universe filtered on an 8 Mpc scale, and the matter density parameter can be broken by extending cluster surveys to higher redshift (Bahcall et al. 1997). This particular probe is highly complementary to the CMB anisotropy, because it probes the era of structure formation– when dark energy becomes dominant– as opposed to the era of recombination.
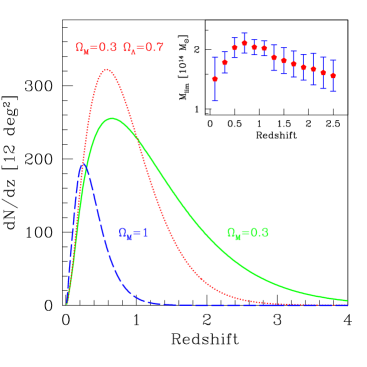
The observed cluster redshift distribution in a survey (see Figure 2) is the comoving volume per unit redshift and solid angle times the comoving density of clusters with masses above the survey detection limit : written as
| (3) |
where is the cluster mass function, is the Hubble parameter as a function of redshift and is the angular diameter distance. The cosmological sensitivity comes from the three basic elements:
-
Volume: the volume per unit solid angle and redshift depends sensitively on cosmological parameters (i.e. higher or lower increases the volume per solid angle). Figure 3 (left) is a plot of the comoving volume element () versus redshift for three cosmological models. Note the rapid increase in the volume element at modest redshift, which is responsible for the rapid rise in the cluster redshift distribution in Figure 2. At higher redshift the comoving volume element flattens out and eventually turns over.
The cosmological sensitivity of the distance-redshift and volume-redshift relation derives essentially from the expansion history of the universe , where , where is the Hubble parameter and the parameter describes its evolution. Within our cosmological framework, the expansion history of the universe simply depends on the nature and amount of the constituents that make up the universe. That is, .
-
Abundance: the number density of clusters at a given redshift depends sensitively on the growth rate of density perturbations. This growth rate is highly sensitive to cosmology (i.e. higher speeds the growth of density perturbations so that clusters “disappear” more quickly as we probe to higher redshift). Figure 3 (right) is a plot of the comoving abundance of clusters above a fixed mass, where the abundance is normalized to reproduce the observed local abundance of massive clusters. Note that abundance differences increase dramatically with redshift and are responsible for the high redshift () behavior of the cluster redshift distribution (Figure 2).
As stated above, the cosmological sensitivity of the abundance evolution appears to derive from the growth rate of density perturbations. Within the linear regime, the differential equation that describes growth depends, again, on the expansion history of the universe . The rapid evolution of the abundance is due to an exponential dependence of abundance upon the amplitude of density fluctuations on the galaxy cluster scale (Press & Schechter 1974; Jenkins et al 2001).
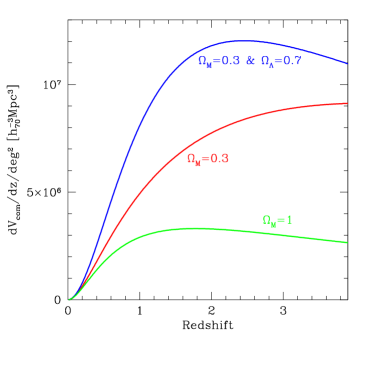
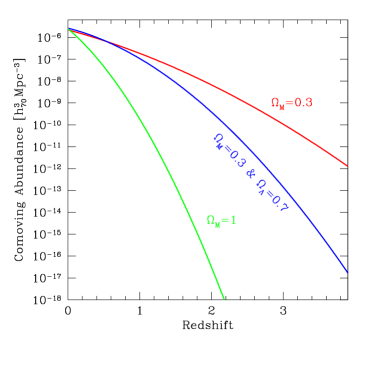
Figure 3.: The comoving volume element (left) and cluster abundance above a fixed mass (right) in three different cosmological models. The abundances are normalized to produce the observed local abundance of massive clusters. Differences in the cluster redshift distribution are dominated by volume at low redshift and by abundance at high redshift. -
Mass limit: the mass of a cluster, which is just luminous enough to appear above the detection threshold, typically depends on the luminosity or angular diameter distance as well as the evolution of cluster structure– both are sensitive to cosmological parameters. The survey yield and redshift distributions are both sensitive to the limiting mass, as indicated in Figure 4. Figure 4 shows the cluster redshift distribution in a fiducial cosmology for a limiting mass of , and for limiting masses 10% above and below this value.
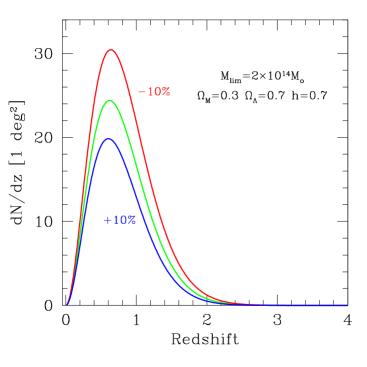
Figure 4.: The cluster redshift distribution within a fiducial cosmological model for a mass limit of and for mass limits 10% above and below this value. The mass sensitivity of the survey yields and redshift distributions means that accurate cosmological constraints require unbiased estimators of cluster halo mass.
The challenging aspects of using galaxy clusters to constrain cosmology, aside from building the instruments to carry out the surveys, include an understanding of how cluster abundance evolves within a variety of cosmologies and how to relate cluster observables like X-ray emission, SZE distortion, galaxy light and weak lensing shear to halo mass. These relations are required for all redshifts. Theoretical studies of structure formation suggest that the mass function is well behaved, and may be described by a “universal” form when suitably parametrized (Jenkins et al 2001; White 2001). Further study is clearly required. Observational studies of galaxy cluster scaling relations suggest regularity in the cluster population similar to the regularity in the elliptical galaxy population (Mohr & Evrard 1997; Mohr, Mathiesen & Evrard 1999; Horner, Mushotzky & Scharf 1999). Hydrodynamical simulations of cluster formation suggest that scaling relations between cluster observables and halo mass evolve in a simple way (Evrard et al. 1996; Bryan & Norman 1998), even in the presence of some early preheating (Bialek, Evrard & Mohr 2001). Much more study using higher resolution simulations that incorporate additional physics is clearly required here to enable more accurate, unbiased estimators of cluster mass.
A recent study by Diego et al (2001) suggests that a joint analysis of the cluster redshift distribution and the observed scaling relations (all available from the same survey data) can allow one to solve for the evolving scaling relation and cosmological parameters simultaneously (see also Verde, Haiman & Spergel 2001). More complete studies of the degeneracies between the evolution of cluster scaling relations and cosmological parameters in the analysis of cluster surveys is ongoing.
4. Precision Cosmology with Galaxy Cluster Surveys?
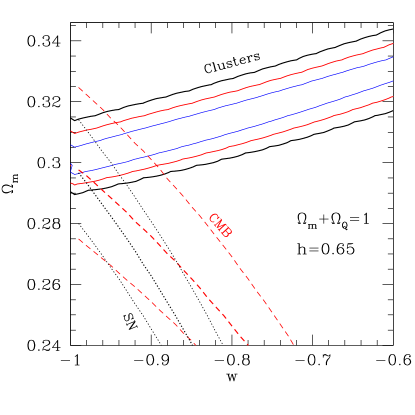
Recently, Haiman, Mohr & Holder (2001) emphasized that large cluster surveys extending to high redshift can in principle provide precision measurements of any cosmological parameter, which affects the expansion history of the universe (i.e. , , and ). This is emphasized in Figure 5, which shows the 1, 2 and 3 joint constraints on and the equation of state parameter of the dark energy for an X–ray cluster survey which yields clusters with measured emission weighted mean temperatures (and therefore virial mass estimates). Only flat models () are considered and the fiducial model , , constant and is adopted. Note the degeneracy. Also shown (dashed line) is the degeneracy for CMB anisotropy and SNe Ia distance measurements. The CMB degeneracy assumes that the angular scale of the first peak (at fixed ) is known to an accuracy of 1%, whereas the SNe Ia degeneracy assumes that the luminosity distance to is known to 1%. This figure indicates that an X–ray survey yielding clusters has comparable constraining power to 1% CMB or SNe Ia measurements. In addition, the roughly orthogonal degeneracy between the cluster constraints and those from the CMB and SNe emphasizes the complementarity of these independent constraints on cosmological parameters.
The requirements for such precision are (1) a large cluster sample extending to intermediate or high redshift and (2) cluster mass estimators that are unbiased at the 5% level. Assuming these two requirements can be satisfied, cluster surveys have as much potential to reveal the nature and amount of the dark energy in our universe as either high redshift type Ia supernovae observations or observations of the anisotropy of the cosmic microwave background.
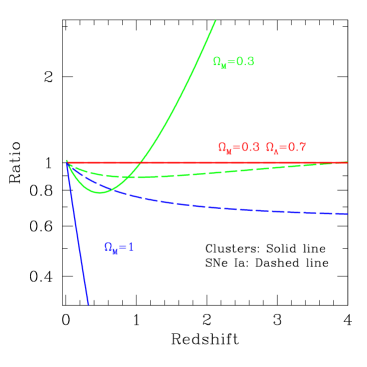
In fact, with accurate mass estimators, the cluster redshift distribution is far more cosmologically informative than simple distance measurements. Figure 6 contains a plot, which compares the cosmological sensitivity of SNe Ia distance estimates to cluster survey constraints, assuming distances and cluster masses are both accurately estimated from the data. The figure plots the ratio of the cluster redshift distribution (solid lines) and the luminosity distance (dashed lines) as a function of redshift for a few cosmological models. The denominator in each ratio is the quantity from the fiducial model, taken to be and in this example. The degree to which the ratio deviates from 1.0 provides an indication of the sensitivity to differences in the two models. Except for a narrow window around , cluster redshift distribution contains more cosmological information than do luminosity distances. Given the discussion in Section 3 above, this is easy to understand. Surveys probe the volume–redshift relation, which scales as the square of the distance. Abundance evolution depends exponentially on the growth rate of density perturbations. In addition, limiting masses depend on luminosity or angular diameter distances. Naturally, these different dependencies can interfere constructively or destructively.
Of course, cluster surveys will only achieve high precision if cluster masses can be accurately estimated, on the average, from observables. That is, precision requires that systematic biases in mass estimators be small. This is similar to the case with type Ia supernovae, in that SN Ia distances are only accurate to the extent that the SNe themselves are standard candles. The high potential of both approaches has led people to invest significant effort in better understanding possible sources of systematics. Currently, our theoretical understanding of the formation and evolution of clusters is less developed than our understanding of the dynamics of density perturbations (well within the linear regime) at and before the epoch of recombination; however, it seems to me that our understanding of structure formation has progressed well beyond our understanding of why SNe Ia’s form a one parameter family of standard candles that have not evolved since before the universe was one quarter its present age. This theoretical heritage in structure formation is an important resource as we move toward interpreting ongoing and planned surveys.
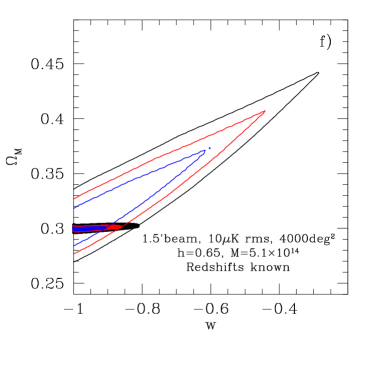
Precision cosmology with clusters requires large cluster ensembles extending over large (- deg2) solid angles. X–ray and SZE surveys of this sort will not necessarily have the optical/near-IR data available on every system to estimate a sufficiently accurate redshift. Nevertheless, X–ray and SZE surveys are attractive, because high signal to noise detections are possible, projection effects are minimized, and observations indicate that tight scaling relations involving X–ray observables exist. The price of not having redshifts can be severe, as shown in Figure 7. This figure shows the confidence regions in and corresponding to a 4000 deg2 SZE observations indicate that tight scaling relations involving X–ray observables exist. survey carried out from the South Pole. Confidence regions include marginalization over , and only flat models are considered. The contours correspond to constraints using only the total number of detected clusters, whereas the solid region denotes the constraints in the case that cluster redshifts are available. As was made clear in Section 3, the cluster redshift distribution is cosmologically rich.
Possibilities for redshift followup include large solid angle, multiband optical or near-IR photometric surveys and direct spectroscopic followup of member galaxies. It may even be possible to obtain rough redshift estimates directly from the SZE or X–ray data, but further work is required to explore the feasibility of this approach (Diego et al, in preparation). Photometric redshift estimates of multiple galaxies within each cluster should be sufficiently accurate to allow precision cosmology. The required redshift precision is set less by the scale of change in the theoretical cluster redshift distributions (which are smoothly varying- see Figure 2) than by the fact that accurately inferring cluster masses from measured fluxes requires redshifts.
The Sloan Digital Sky Survey is one such multiband, photometric dataset, and it will be extremely useful in estimating redshifts for clusters at (i.e. relatively low redshift samples like the high mass Planck Surveyor cluster sample). However, for reasonably deep X–ray surveys and high sensitivity SZE surveys, only a small fraction of the sample will lie at these low redshifts, and so deeper, multiband followup will be required. The bad news is that the effort required to carry out deep, multiband surveys in the optical and near-IR is comparable to the effort required to execute the initial SZE or X-ray survey. The good news is that there are several projects being designed independently of planned and proposed SZE and X-ray surveys that will provide the required data. These survey projects include PRIME— a NASA Small Explorer Class proposal in Phase A study that will survey one quarter of the sky in the 1-3m range, VISTA— a 4 m class telescope with a wide field near-IR and (eventually) optical camera that will carry out surveys in the southern hemisphere, the VST— an SDSS-like survey telescope with a large optical camera operating in the southern hemisphere, and the Large Synoptic Survey Telescope— a 6–8 m class telescope with wide field of view to carry out frequent, repeated imaging of large portions of the sky. In addition, there are extremely useful large field of view CCD cameras available at KPNO/CTIO and on the CFHT. With these projects and others together with the exciting science possible with cluster surveys, it is only a question of time until very large cluster catalogs can be derived from large solid angle, multifrequency surveys.
5. Discussion
This contribution contains a description of two ways of using cluster surveys to learn about structure formation and cosmology: (1) the context free test of hierarchichal structure formation using SZE cluster surveys, which are sufficiently sensitive to detect low mass clusters no matter what their redshift, and (2) the use of cluster redshift distributions within the context of our standard model for structure formation to determine the quantity and nature of dark matter and dark energy in the universe. It’s important to emphasize that there is additional information that comes with a cluster survey. This information allows one to study the cluster mass function as a function of redshift, likely improving the constraints derived from integrals over the mass function (i.e. equation 3). In addition, surveys (perhaps with some targeted followup) enable one to study cluster scaling relations such as the X-ray, optical or SZE luminosity–temperature or luminosity–mass relations; a combined study of scaling relations and the redshift distribution may well allow one to solve for the scaling relation evolution and cosmological parameters simultaneously (Diego et al 2001).
One can also study the spatial correlations among clusters to infer properties of the underlying power spectrum of dark matter density fluctuations. With good halo mass estimates like those required to use the cluster redshift distribution to full effect, it should be possible to use the cluster power spectrum constraints to improve limits on the neutrino mass density. Even in the absence of accurate halo mass estimates, it should be possible to use large surveys (in volume and number) to measure the scale of the break in the transfer function for the evolution of density perturbations. Recently, Cooray et al (2001) have emphasized that the physical scale of the break in the transfer function, which is the horizon scale at matter–radiation equality, depends on the matter density and CMB temperature. The matter density is measured to high precision with CMB anisotropy observations such as those with MAP and Planck. Therefore, the break in the transfer function is a standard rod, whose scale is independent of redshift and is calibrated to high accuracy with CMB data. Thus, measurements of the cluster correlation function within redshift shells returns the angular diameter distance as a function of redshift, much like the SNe Ia but with a strong physical basis for the lack of evolution in the standard rod. This approach is very complementary to the cluster redshift distribution approach, and it hinges less on extracting unbiased estimates of cluster masses from cluster observables like the X-ray or SZE luminosity.
Acknowledgments.
I would like to acknowledge Zoltan Haiman for the many cluster survey discussions and calculations we have shared. It is also a pleasure to acknowledge many cluster related conversations with John Carlstrom and Gil Holder.
References
Arnaud, M. & Evrard, A.E. 1999, MNRAS, 305, 631
Bahcall, N.A., Fan, X. & Cen, R. 1997, ApJ, 485, L53
Bialek, J.J., Evrard, A.E. & Mohr, J.J. 2001, ApJ, 555, 597
Bryan, G.L. & Norman, M.L. 1998, ApJ, 495, 80
Burles, S. & Tytler, D. 1998, ApJ, 507, 732
Cooray, A., Hu, W., Huterer, D. & Joffre, M. 2001, ApJ, 557, L7
Diego, J.M., Martinez-Gonzalez, E., Sanz, J.L., Cayon, L. & Silk, J. 2001, MNRAS, 325, 1533
Evrard, A.E., Metzler, C.A. & Navarro, J.F. 1996, ApJ, 469, 494
Haiman, Z., Mohr, J.J. & Holder, G.P. 2001, ApJ, 553, 545
Halverson, N.W. et al 2001, ApJ, submitted (astro-ph/0104489)
Hanany, S. et al. 2000, ApJ, 545, L5
Holder, G.P., Mohr, J.J., Carlstrom, J.E., Evrard, A.E. & Leitch, E.M. 2000, ApJ, 544, 629
Horner, D.J., Mushotzky, R.F. & Scharf, C.A. 1999, ApJ, 520, 78
Jaffe, A. et al. 2001, Phys.Rev.Lett, 86, 3475
Jenkins, A., Frenk, C.S., White, S.D.M., Colberg, J.M., Cole, S., Evrard, A.E., Couchman, H.M.P. & Yoshida, N. 2001, MNRAS, 321, 372
Lange, A. et al. 2001, Phys.Rev.D, 63, 2001
Mohr, J.J. & Evrard, A.E. 1997, ApJ, 491, 38
Mohr, J.J., Mathiesen, B. & Evrard, A.E. 1999, ApJ, 517, 627
Netterfield, C.B. et al. 2001, ApJ, submitted (astro-ph/0104460)
Peebles, P.J.E. 1993, Principles of Physical Cosmology, Princeton University Press; Princeton
Perlmutter, S. et al. 1999, ApJ, 517, 565
Press, W.H. & Schechter, P. 1974, ApJ, 187, 425
Pryke, C. et al. 2001, ApJ, submitted (astro-ph/0104490)
Schmidt, B.P. et al. 1998, ApJ, 507, 46
Sunyaev, R.A. & Zel’dovich, Y.B. 1972, Comments Astrophys. Space Phys., 4, 173
Verde, L., Haiman, Z., Spergel, D.N. 2001, ApJ, submitted (astro-ph/0106315)
Viana, P.T.P. & Liddle, A.R. 1999, MNRAS, 303, 535
White, D.A. & Fabian, A.C. 1995, MNRAS, 273, 72
White, M., 2001, A&A, 367, 27
White, S.D.M., Navarro, J.F., Evrard, A.E. & Frenk, C.S. 1993a, Nature, 366, 429
White, S.D.M., Efstathiou, G. & Frenk, C.S. 1993b, MNRAS, 262, 1023