Thermal Instability–Induced Interstellar Turbulence
Abstract
We study the dynamics of phase transitions in the interstellar medium by means of three-dimensional hydrodynamic numerical simulations. We use a realistic cooling function and generic nonequilibrium initial conditions to follow the formation history of a multiphase medium in detail in the absence of gravity. We outline a number of qualitatively distinct stages of this process, including a linear isobaric evolution, transition to an isochoric regime, formation of filaments and voids (also known as “thermal” pancakes), the development and decay of supersonic turbulence, an approach to pressure equilibrium, and final relaxation of the multiphase medium. We find that 1%-2% of the initial thermal energy is converted into gas motions in one cooling time. The velocity field then randomizes into turbulence that decays on a dynamical timescale , . While not all initial conditions yield a stable two-phase medium, we examine such a case in detail. We find that the two phases are well mixed with the cold clouds possessing a fine-grained structure near our numerical resolution limit. The amount of gas in the intermediate unstable phase roughly tracks the rms turbulent Mach number, peaking at 25% when , decreasing to 11% when .
The Astrophysical Journal, 569:L00-L00, 2002 April 20
Received 2001 December 18; accepted 2002 March 20; published 2002 March 00
1 Introduction
Thermal instability (TI) has many implications in astrophysics (e.g., a clumpy interstellar medium [ISM], stellar atmospheres, star formation, globular cluster and galaxy formation, etc.; see Meerson 1996 for a recent review). The instability may be driven by radiative cooling of optically thin gas (radiation-driven TI) or by exothermic nuclear reactions (Schwarzschild & Härm, 1965).
Linear stability theory for a medium with volumetric sources and sinks of energy in thermal equilibrium was developed by Field (1965), who identified three unstable modes: the isobaric mode (the pressure-driven formation of condensations not involving gravitation) and the two isentropic modes (the overstability of acoustic waves propagating in opposite directions). Hunter (1970, 1971) extended these results to an arbitrary nonstationary background flow, showing that cooling-dominated media are potentially more unstable than those in equilibrium, while heating provides stabilization. The most common applications of thermal instability to the ISM and star formation deal with the isobaric mode that was employed to explain the observed multiphase structure of the ISM (Pikel’ner, 1968; Field, Goldsmith, & Habing, 1969; McKee & Ostriker, 1977; McKee, 1990; Wolfire et al., 1995).
Analysis of infinitesimal perturbations gives two characteristic length scales for the isobaric condensation mode: (1) a cooling scale (where is the adiabatic sound speed and is the growth rate) and (2) a critical scale (where is the characteristic thermal diffusion time). These two length scales define short-, intermediate-, and long-wavelength limits (Meerson, 1996; Kovalenko & Shchekinov, 1999). In the short-wavelength limit, small isobaric perturbations are inhibited by heat conduction, so that for . In the long-wavelength limit, the perturbations cannot grow isobarically because of the finite sound speed effects, and thus for . This is only true if the gas is isochorically stable (Parker, 1953; Field, 1965; Shchekinov, 1978), otherwise the growth rate remains finite: for , but only large-scale temperature perturbations are growing, thus resulting in pressure variations and the formation of shock waves. The growth rates and characteristic scales depend on the heating and cooling properties of a given medium. Under the ISM conditions, if one assumes thermal equilibrium (i.e., an exact balance between cooling and heating), isochoric instability manifests itself only at relatively high temperatures, K. However, in cooling-dominated regimes, it can develop at temperatures as low as K.
A specific feature of TI in the ISM is a large ( dex) gap in gas densities between the two stable phases. The density range of interest in a galaxy formation context is even larger. This implies the importance of nonlinear effects in the dynamics of phase transitions. Nonlinearity brings into play nonequilibrium effects. Already weakly nonlinear development of condensations in an initially homogeneous gas in thermal equilibrium drives the system away from equilibrium. The mean pressure drops since and cooling overcomes heating globally (Kritsuk, 1985). Later, on a timescale of , as condensations get denser and cooler, the isobaric condition becomes violated locally within them, so the system departs from pressure equilibrium. These effects are essential for the isobaric mode of TI in the ISM and star formation contexts. Therefore, analytical nonlinear solutions to “isobarically” reduced TI equations are insufficient to describe the radiative stage of the phase transition ().
During this strongly nonlinear stage large-scale condensations form in such a way that gas moves almost inertially and its kinetic energy dominates thermal energy (). Accordingly, the gas velocities in these condensations are of the order of the sound speed in the unperturbed state. The situation here is directly analogous to the long-wave gravitational instability, so that results concerning the origin of cellular structure and Zel’dovich (1970) “pancakes” can be entirely carried over to the case of long-wave TI (Meerson & Sasorov, 1987). Sasorov (1988) gave an elegant proof that qualitatively the same result applies to small-scale TIs; i.e., the onset of TI produces voids and highly flattened condensations along certain two-dimensional surfaces. These are also called “thermal” pancakes (Meerson, 1996). The formation of filaments was simultaneously noticed in two-dimensional numerical simulations of TI in the solar transition region (Dahlburg et al., 1987; Karpen, Picone & Dahlburg, 1988). Ever since, thermal pancakes are being rediscovered both analytically and in numerical simulations (e.g., Lynden-Bell & Tout 2001).
Thermal pancakes are transient. However, what happens next, before the evolution turns to a conductive relaxation stage (Meerson, 1996), until recently has remained the “terra incognito” of TI theory. The problem of “postradiative” mechanical relaxation toward a static multiphase medium requires a solution for the full set of hydrodynamic equations that can only be obtained numerically. One-dimensional simulations pioneered by Goldsmith (1970) demonstrated that TI develops large motions in the ISM (see also Hennebelle & Pérault 1999 for an example of how large motions can trigger TI). For some time, progress in this direction was precluded by numerical difficulties in modeling convergent cooling flows with high Mach numbers and high-density contrasts (e.g., Vázquez-Semadeni, Gazol, & Scalo 2000). Recent multidimensional numerical simulations of the ISM evolution in disklike galaxies include effects of gravity, differential rotation, star formation and supernova feedback (de Avillez 2000; Vázquez-Semadeni et al. 2000; Wada & Norman 2001; Wada 2001). However, it is hard to determine the role of TI in shaping the ISM structures found in these models, partly because the simulations still do not resolve length scales important for TI and partly because of the additional physical effects.
The purpose of this Letter is to report on results of three-dimensional numerical simulations of classical TI that fill the gap in theory, exploring in detail the late radiative stage and postradiative relaxation toward a multiphase medium. Our major result is that formation of thermal pancakes induces turbulence in the ISM that serves as a nonlinear saturation mechanism for TI. As a consequence of a turbulent cascade, (1) information about initial perturbations is lost, including the imprints of heat conduction in the density power spectrum during the linear stage, and (2) turbulent diffusion becomes the dominant transport mechanism during the postradiative relaxation stage.
2 Simulations
We solve the equations of ideal gasdynamics (eqs. [6]-[9] in Field 1965) in a cubic domain with periodic boundary conditions, assuming zero conductivity and no gravity. The generalized cooling function contains cooling and heating terms, . The temperature dependence of radiative cooling for K is provided by M. Spaans (2000, private communication; see also Wada & Norman 2001). The gas metallicity is assumed to be solar in most of the models, but we also considered a case with a subsolar value of . For simplicity we assume that the heating rate , and we define it in units of the cooling rate in an initial unperturbed state: , where . The initial unperturbed state is uniform with gas density g cm-3 and gas temperature K. The box size pc was chosen such that at least the cooling scale for initial state is well resolved on a discrete grid of or cells. In most cases, we initially impose isobaric density perturbations with a three-dimensional power spectrum index of , an rms deviation of , and a high-wavenumber cutoff ,111These are normalized values; for a grid implies that the cutoff scale spans eight grid zones. This is slightly below the dissipation limit of our numerical scheme. assuming zero initial velocities. A few cases were started up with random velocity perturbations, varying the amplitude and assuming uniform initial density.
The simulations were performed using two hydrosolvers implemented in the Enzo code developed by Bryan & Norman (2000): one is a direct Eulerian version of the PPM scheme (Colella & Woodward, 1984), and the other is the finite difference Eulerian method originally implemented in ZEUS (Stone & Norman, 1992).
3 Results
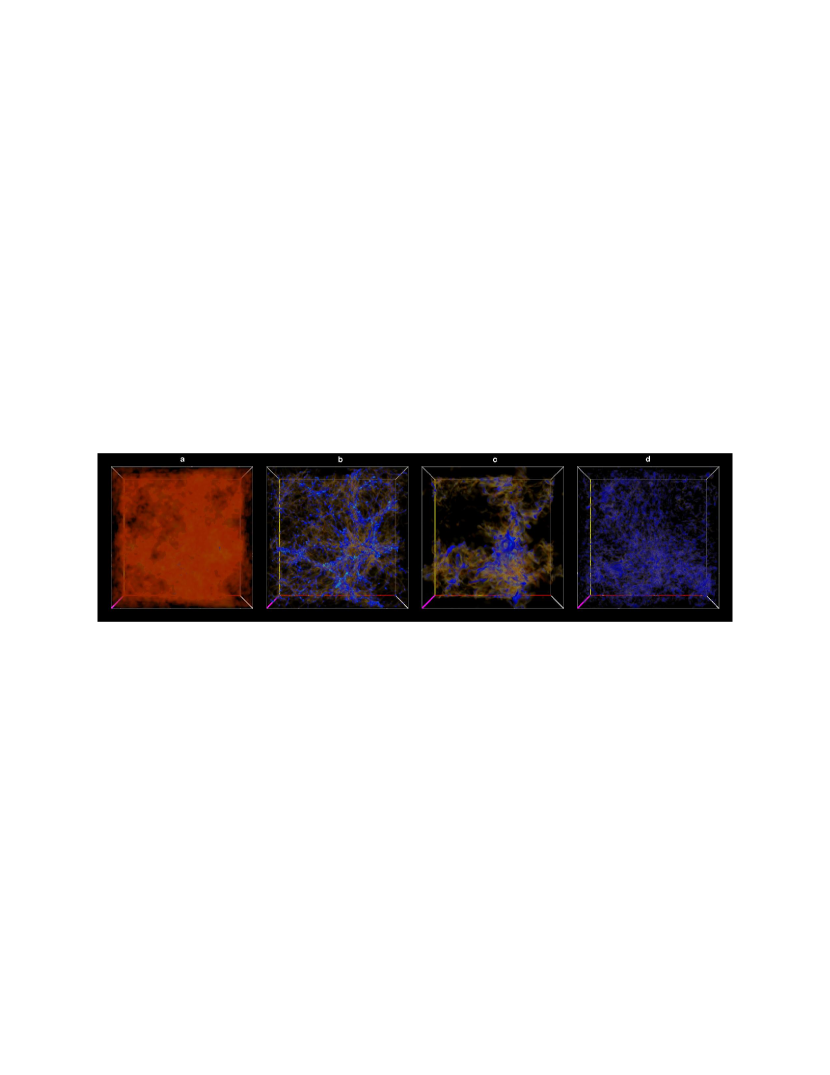
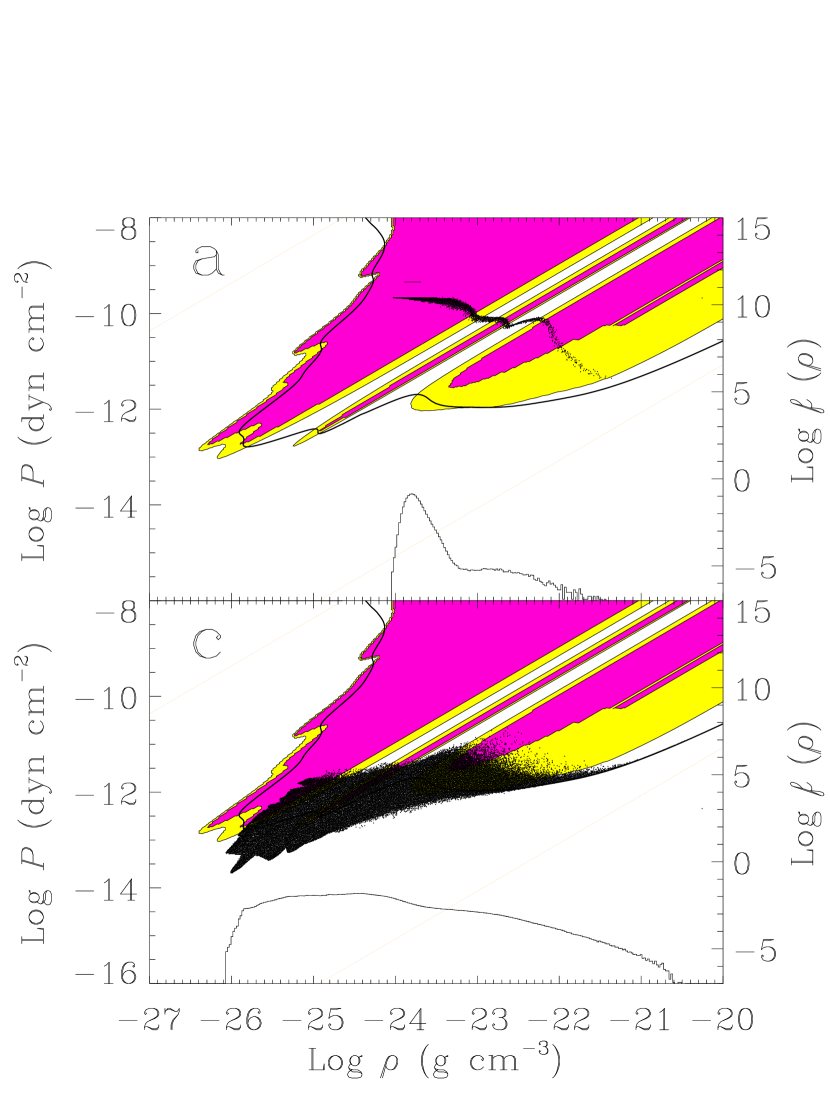
Here we present results for our fiducial model computed on a “moderate”-resolution grid of cells assuming pc, g cm-3, K, , solar metallicity, and isobaric perturbations with , (Fig. 1). With these initial conditions, the linear isobaric mode develops on a timescale Myr, the cooling length pc, and the critical length for heat conduction pc. Thus, our initial perturbations formally drop into a short-wavelength limit.222Since initial perturbations are not infinitesimal, , TI reaches the strongly nonlinear regime by 0.07 Myr. For such perturbations, both and are effectively lower than their linear estimates. Assumed cooling and heating rates and the value of the initial gas density imply the existence of attracting bistable thermal equilibrium, with physical conditions close to those in the ISM (Fig. 2), although the pressure range for bistability is somewhat narrower than in the “standard” model of Wolfire et al. (1995).
With our setup, heating does not compensate cooling in the initial state; thus, TI sets in on a time-dependent background state. As the gas cools, the instability channels a part of its thermal energy into kinetic energy of converging flows that create condensations and evacuate gas from underdense voids (Fig.3). Growing density variance accelerates cooling efficiency, so the gas as a whole cools much faster than a homogeneous medium with the same initial setup. Since initial perturbations span a range of linear scales, the epoch of the thermal pancakes’ formation lasts from Myr, when the first cold blob forms, to Myr, when the mean kinetic energy and then pressure variance reach their maximal values (see Figs. 1a, 1b, 2a, and 3).
The pancakes themselves exhibit a rather complex inner structure. As the isobaric compression gives way to isochoric cooling (Kritsuk, 1990; Burkert & Lin, 2000), accretion shocks develop within the cooling condensations at temperatures corresponding to two strips of stability in the phase plane (Fig. 2a). Dense gas in the cores of condensations cools further as it contracts in a regime similar to the explosive condensation described in Meerson & Sasorov (1987); see Figure 2a.
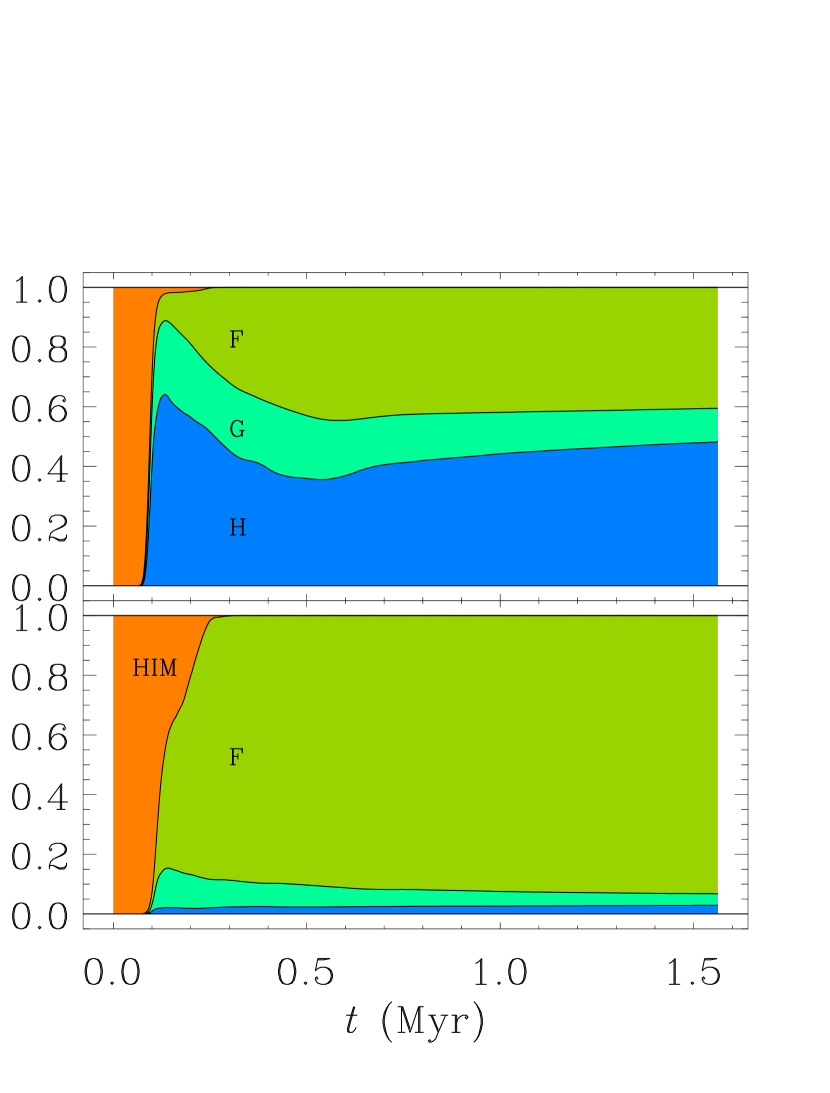
Due to asymmetries in the initial conditions, the dense cores gain nonzero momentum that drives a bottom-up collapse of the hierarchical cellular structure composed of thermal pancakes. As a result, a single large void forms in the periodic box, and attains its global minimum by Myr (Figs. 1c and 3). At this point, the gas density variance approaches its maximum, and the density spans a range of 5.5 dex. The highest density gas quickly relaxes to thermal equilibrium. However, the dense cold blobs reexpand slightly until they reestablish pressure balance with the less dense environment, so the mass fraction of the gas in cold stable phase “H” decreases333We follow the notation of Field et al. (1969). (see Fig. 3).
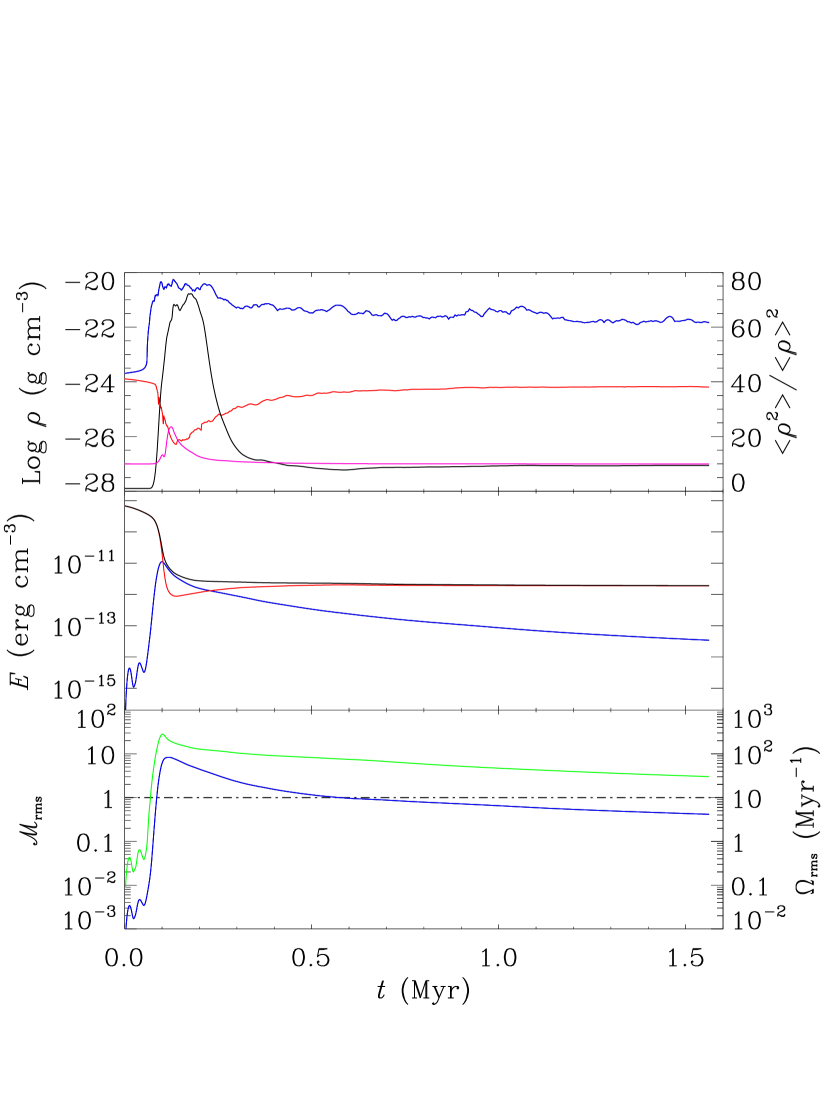
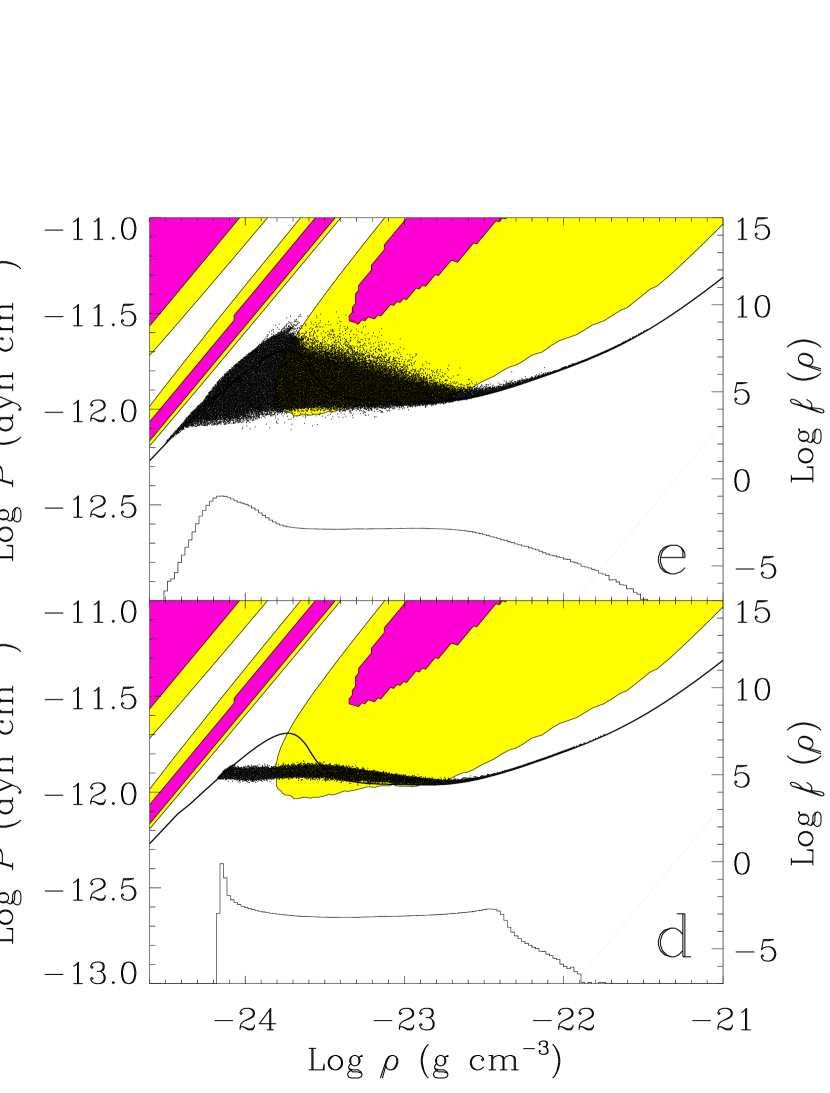
By Myr, the information about the details of the initial perturbations is lost, and highly compressible supersonic turbulence with an rms Mach number of about 10 is fully developed in the computational domain (Fig. 3). The velocity power spectrum fills in at small scales as the turbulent cascade settles and then only slightly evolves on a time scale of Myr as turbulence decays [ ergs cm-3 for Myr, cf. Mac Low, Klessen, & Burkert 1998]. The density probability distribution function (PDF) exhibits a power-law excess at high densities, where the “effective” equation of state is soft444For and , the equilibrium pressure , and since at low temperatures, the effective adiabatic index .. Low-density gas is nearly adiabatic (); therefore, the PDF also has a power-law regime at low (Figs. 2c and 2e). The power-law regimes appear in response to deviations from a special isothermal case in which lognormal PDFs are produced due to the fact that the local Mach number is independent of the density (Passot & Vázquez-Semadeni, 1998).
Relaxation timescales toward thermal and dynamical equilibria depend on local physical conditions. Cold dense gas quickly settles to a thermal equilibrium, but its dynamical relaxation proceeds quite slowly (by Myr, its kinetic energy dominates the thermal energy by up to a factor of 3 in the most dense blobs). Warm tenuous gas, instead, undergoes a fast transition to a subsonic regime with a quite uniform density distribution (see PDFs in Figs. 2e and 2d), but it takes longer to establish thermal equilibrium. As soon as the system relaxes to a bistable state with pressure close to the allowed minimum,555The pressure hovers near because of the shape of the thermal equilibrium curve, which is in turn controlled by our assumed heating and cooling functions. the density PDF shows a bimodal distribution, phase fractions by mass saturate at for the warm phase, and for the cold phase, and of the mass falls in the unstable temperature regime. The substantial amount of gas in the unstable regime can be explained as being due to turbulent diffusion. Vorticity is generated by baroclinic instabilities and in shocks, which develop during the radiative stage at the interface of growing condensations (Dahlburg et al. 1987; Karpen et al. 1988). The values we found for the unstable gas fraction are somewhat lower than those obtained in two-dimensional models by Gazol et al. (2001). To see whether turbulence was at least partially driven by mass exchange between phases, we zeroed the velocity field at Myr. Residual pressure variations regenerated the turbulence, but at a much lower level. The gas mass fraction in the unstable regime “G” shrunk from 14% to only 2%; the remainder is incorporated into the cold stable phase H. We conclude that TI-induced turbulence is purely decaying in our simulations.
Since at least some part of the gas does not stay in thermal equilibrium (Fig. 2d), the exact fraction of thermally unstable gas should be determined by Hunter’s (1970) TI criterion. A rough estimate, however, could be obtained using density and temperature limits for the stability of thermal equilibrium, which are used in Figs 1 and 3, respectively. Note that such estimates are robust for only a medium in a quasi-isobaric state. One has to be cautious obtaining temperature estimates for the unstable gas based on the assumption of thermal equilibrium (cf. Heiles 2001a).
Only because we were able to resolve the length scales that were smaller than the cooling scale in the vicinity of the bistable regime did the gas in the box relax to an isobaric state.666 It was the necessity to resolve isobaric mode in the vicinity of bistable thermal equilibrium that forced us to choose the box size pc. Seed perturbations in the corresponding range of linear scales are always available to feed the instability, provided the turbulent cascade exists. The resulting two-phase medium is dynamic. Turbulent velocities do not correlate with density, and dense clouds appear to be shapeless random aggregations of cold Lagrangian gas parcels, forming a “fractal” substrate (Fig. 1d).
4 Discussion
Our fiducial case was constructed to produce a stable two-phase medium because of its relevance to the Galactic ISM. We are interested in TI over a wide range of conditions as might be found in the ISM of high-redshift protogalaxies. We have simulated other cases with different parameter choices that do not produce stable two-phase media. However, we find they all develop turbulence in the nonlinear radiative stage of TI. Here we briefly discuss how the turbulence and asymptotic phase structure depend on initial conditions, deferring a more complete discussion to a future paper (A. Kritsuk & M. Norman 2002, in preparation).
The level of induced turbulence is determined by the efficiency of conversion of the initial thermal gas energy into kinetic energy of turbulent flow by nonlinear development of TI: (see Fig. 3). The conversion factor is a complex function of its variables. It varies from about 2% to % in our models. In general, higher and/or values provide higher conversion; a lower heating level () supports TI and therefore works in the same direction. Larger boxes, as a rule, also produce more turbulence. The turbulence is induced on the initial cooling time and decays on a dynamical timescale, which is typically much longer. The turbulent Mach number at depends on the mean temperature at this time. For nonequilibrium initial conditions ( or ), this is much lower than the initial temperature. In our fiducial case, peaks at 8, dropping to 0.4 after 20 initial cooling times. For equilibrium initial conditions (), turbulent velocities remain subsonic (). But we would expect higher Mach numbers if the bistable range of pressure were wider than provided by our adopted cooling function.
The initial gas density determines the number and mass fractions of thermal phases in the relaxed state depending on its position relative to the valleys and hills on the thermal equilibrium curve. This is consequence of our choice of constant volume boundary conditions, which means that the mean density in the box remains constant. After the rapid cooling stage, our models with low initial densities - g cm-3, high temperature K, and generate turbulence, evolve through a transient three-phase stage, and then relax to a single-phase low-pressure warm ISM. While turbulence is a generic feature of nonlinear saturation of TI, our simulations show that detailed turbulent properties and the nature of emerging multiphase medium do depend sensitively on the Mach number and effective equation of state controlled by heating and cooling; this will be discussed elsewhere. Two identical simulations, except that cutoffs in initial power spectra were different ( and 32 on a grid, pc, ), demonstrated considerable structural differences in density distributions at the thermal pancake stage, , and surprisingly similar “chaotic” density structures and identical velocity power spectra at , when turbulent mixing covered the whole computational domain. This implies that the imprints of heat conduction in the density power spectrum during the linear stage could be erased later by the developing turbulent cascade.
TI is certainly not the only potential source of turbulence in the ISM, but it cannot be ignored at least in those scenarios that actively employ TI to explain the origin and properties of observed objects. We suggest a paradigm shift concerning the role of thermal instability in the ISM and the nature of multiphase ISM. The idea of “static” two-phase ISM introduced in late 1960s (pressure-confined thermally stable dense clouds embedded in rarefied intercloud gas forming as a result of TI and subject to phase exchange due to cloud evaporation/condensation) must give way to the notion of a dynamic multiphase ISM, in which TI induces slowly decaying turbulence and in which turbulent diffusion regulates phase exchange processes. In this new emerging picture, the dense clouds are shapeless random aggregations of cold Lagrangian gas parcels; the clouds do not preserve their identity in real space on their sound crossing timescale until self-gravity tightens the fragments up into a self-gravitating cloud to form stars. Our results may suggests modifications to the scenario of a three-phase ISM (McKee & Ostriker, 1977; McKee, 1990; Heiles, 2001b) that are yet to be understood.
References
- Bryan & Norman (2000) Bryan, G. L., & Norman, M. L. 2000, in IMA Vol. 117, Structured Adaptive Mesh Refinement (SAMR) Grid Methods, ed. S. B. Baden, N. P. Chrisochoides, D. Gannon, & M. L. Norman (New York: Springer), 165
- Burkert & Lin (2000) Burkert, A., & Lin, D. N. C. 2000, ApJ, 537, 270
- Colella & Woodward (1984) Colella, P., & Woodward, P. R. 1984, J. Comp. Phys., 54, 174
- Dahlburg et al. (1987) Dahlburg, R. B., Devore, C. R., Picone, J. M., Mariska, J. T., & Karpen, J. T. 1987, ApJ, 315, 385
- de Avillez (2000) de Avillez, M. A. 2000, MNRAS, 315, 479
- Field (1965) Field, G. B. 1965, ApJ, 142, 531
- Field, Goldsmith, & Habing (1969) Field, G. B., Goldsmith, D. W., & Habing, H. J. 1969, ApJ, 155, L149
- Gazol et al. (2001) Gazol, A., Vázquez-Semadeni, E., Sánchez-Salcedo, F. J., & Scalo, J. 2001, ApJ, 557, L121
- Goldsmith (1970) Goldsmith, D. W. 1970, ApJ, 161, 41
- Heiles (2001a) Heiles, C. 2001a, ApJ, 551, L105
- Heiles (2001b) Heiles, C. 2001b, in ASP Conf. Ser. 231, Tetons 4: Galactic Structure, Stars and the Interstellar Medium, ed. C.E. Woodward, M. D. Bicay, & J. M. Shull (San Francisco: ASP), 294
- Hennebelle & Pérault (1999) Hennebelle, P., & Pérault, M. 1999, A&A, 351, 309
- Hunter (1970) Hunter, J. H., Jr. 1970, ApJ, 161, 451
- Hunter (1971) Hunter, J. H. 1971, ApJ, 166, 453
- Karpen, Picone & Dahlburg (1988) Karpen, J. T., Picone, M., & Dahlburg, R. B. 1988, ApJ, 324, 590
- Kovalenko & Shchekinov (1999) Kovalenko, I. G., & Shchekinov, Yu. A. 1999, Phys. Plasmas, 6, 335
- Kritsuk (1985) Kritsuk, A. G. 1985, Soviet Astron., 29, 39
- Kritsuk (1990) Kritsuk, A. G. 1990, Soviet Astron., 34, 21
- Lynden-Bell & Tout (2001) Lynden-Bell, D., & Tout, C. A. 2001, ApJ, 558, 1
- Mac Low, Klessen, & Burkert (1998) Mac Low, M.-M. Klessen, R. S., & Burkert, A. 1998, Phys. Rev. Lett., 80, 2754
- McKee (1990) McKee, C. F. 1990, in ASP Conf. Ser. 12, The Evolution of the Interstellar Medium, ed. L. Blitz (San Francisco: ASP), 3
- McKee & Ostriker (1977) McKee, C. F., & Ostriker, J. P. 1977, ApJ, 218, 148
- Meerson & Sasorov (1987) Meerson, V. I., & Sasorov, P.V. 1987, Soviet Phys.— JETP Lett., 65, 300
- Meerson (1996) Meerson, V. I. 1996, Rev. Mod. Phys., 68, 215
- Parker (1953) Parker, E. N. 1953, ApJ, 117, 431
- Passot & Vázquez-Semadeni (1998) Passot, T., & Vázquez-Semadeni, E. 1998, Phys. Rev. E, 58, 4501
- Pikel’ner (1968) Pikel’ner, S. B. 1968, Soviet Astron., 11, 737
- Sasorov (1988) Sasorov, P. V. 1988, Soviet Astron. Lett., 14, 129
- Schwarzschild & Härm (1965) Schwarzschild, M., & Härm, R. 1965, ApJ, 142, 855
- Shchekinov (1978) Shchekinov, Yu. A. 1978, AZh, 55, 311
- Stone & Norman (1992) Stone, J. M., & Norman, M. L. 1992, ApJS, 80, 753
- Vázquez-Semadeni, Gazol, & Scalo (2000) Vázquez-Semadeni, E., Gazol, A., & Scalo, J. 2000, ApJ, 540, 271
- Wada (2001) Wada, K. 2001, ApJ,559, L41
- Wada & Norman (2001) Wada, K., & Norman, C. A. 2001, ApJ, 547, 172
- Wolfire et al. (1995) Wolfire, M. G., Hollenbach, D., McKee, C. F., Tielens, A. G. G. M., & Bakes, E. L. O. 1995, ApJ, 443, 152
- Zel’dovich (1970) Zel’dovich, Ya. B. 1970, Astrofizika, 6, 319