Can a Dusty Warm Absorber Model Reproduce the Soft X-ray Spectra of MCG6-30-15 and Mrk 766?
Abstract
XMM-Newton RGS spectra of MCG6-30-15 and Mrk 766 exhibit complex discrete structure, which was interpreted in a paper by Branduardi-Raymont et al. (2001) as evidence for the existence of relativistically broadened Lyman alpha emission from carbon, nitrogen, and oxygen, produced in the inner-most regions of an accretion disk around a Kerr black hole. This suggestion was subsequently criticized in a paper by Lee et al. (2001), who argued that for MCG6-30-15, the Chandra HETG spectrum, which is partially overlapping the RGS in spectral coverage, is adequately fit by a dusty warm absorber model, with no relativistic line emission. We present a reanalysis of the original RGS data sets in terms of the Lee et al. (2001) model. Specifically, we show that: (1) The explicit model given by Lee et al. (2001) differs markedly from the RGS data, especially at longer wavelengths, beyond the region sampled by the HETG; (2) Generalizations of the Lee et al. (2001) model, with all parameters left free, do provide qualitatively better fits to the RGS data, but are still incompatible with the detailed spectral structure; (3) The ionized oxygen absorption line equivalent widths are well-measured with the RGS for both sources, and place very tight constraints on both the column densities and turbulent velocity widths of O VII and O VIII. The derived column densities are well below those posited by Lee et al. (2001), and are insufficient to play any role in explaining the observed edge-like feature near Å; (4) The lack of a significant neutral oxygen edge near Å places very strong limits on any possible contribution of absorption to the observed structure by dust embedded in a warm medium; (5) The original relativistic line model with warm absorption proposed by Branduardi-Raymont et al. (2001) provides a superior fit to the RGS data, both in the overall shape of the spectrum and in the discrete absorption lines. We also discuss a possible theoretical interpretation for the putative relativistic Lyman alpha line emission in terms of the photoionized surface layers of the inner regions of an accretion disk. While there are still a number of outstanding theoretical questions about the viability of such a model, it is interesting to note that simple estimates of key parameters are roughly compatible with those derived from the observed spectra.
1 Introduction
High-resolution soft X-ray spectra of Seyfert 1 galaxies acquired with the grating spectrometers onboard the Chandra and XMM-Newton observatories have allowed us, for the first time, to investigate both the dynamics of the extended absorbing media in these systems, and the structure of the intrinsic spectra that originate in the vicinity of the central massive black holes. To date, narrow X-ray absorption lines have been detected in many objects, including NGC 5548 (Kaastra et al., 2000), NGC 3783 (Kaspi et al., 2000, 2001), MCG6-30-15 and Mrk 766 (Branduardi-Raymont et al., 2001; Lee et al., 2001), IRAS 13349+2438 (Sako et al., 2001), NGC 4051 (Collinge et al., 2001), and Mrk 509 (Pounds et al., 2001). On the other hand, the spectra of several sources show no evidence for absorption, but, instead, exhibit complex spectral features and temporal behavior that cannot be explained by simple continuum emission models, and are more likely to be related to the activity of the central engine (e.g., Ton S180, Turner et al. 2000; NGC 4593, Steenbrugge et al. 2001).
In an earlier paper presenting high-resolution spectra of MCG6-30-15 and Mrk 766 obtained with the Reflection Grating Spectrometer (RGS) onboard XMM-Newton (Branduardi-Raymont et al., 2001), we suggested that the soft X-ray emission of these two objects in the Å () band includes significant contributions from discrete emission features produced through X-ray illumination of an accretion disk around the central black hole. The observed spectral structure matches well with what is expected for relativistically broadened recombination lines of hydrogen-like carbon, nitrogen, and oxygen originating from the inner regions of the disk in a Kerr metric. That interpretation significantly challenges conventional models of the global soft X-ray spectra of AGN, where it is usually assumed that all discrete structure in the soft X-ray band is due to absorption features produced in an extended medium far away from the central black hole.
In a subsequent paper, Lee et al. (2001) questioned our interpretation based on their analysis of a non-simultaneous Chandra HETG observation of MCG6-30-15. They claimed that the Å () region can be well-reproduced solely by a dusty warm absorber model superimposed on a smooth continuum, and does not require the presence of any relativistic disk emission lines. They interpret the excess soft X-ray emission above the high energy power law continuum as either a blackbody component, or a steepening of the power law in the soft X-ray band.
The purpose of this paper is to provide a reanalysis of the XMM-Newton data presented by Branduardi-Raymont et al. (2001), with more detailed attention to the properties of the discrete absorption components in both sources. For MCG6-30-15, we explicitly test the spectral model proposed by Lee et al. (2001), and demonstrate that, contrary to their claim, it cannot account for all of the features observed in the RGS spectrum. In particular, the absorption model fails to self-consistently fit the details of both the oxygen line absorption and the apparent edge-like structure present in the data. Further, the Lee et al. (2001) hypothesis that much of the inferred absorption can be ascribed to warm dust, is clearly ruled out by the RGS spectra. We reconfirm our earlier conclusion that the global spectrum strongly favors the intrinsic nuclear radiation to be dominated by discrete emission line features that are expected to be formed in an X-ray photoionized accretion disk. The observed line profiles indicate that they are distorted through relativistic beaming and smeared by strong gravitational effects in the vicinity of the black hole.
This paper is organized as follows. In §2, we summarize the observations and describe the procedures adopted for data reduction. While we focus primarily on the spectra obtained by the RGS, we adopt continuum parameters derived from the EPIC data in the region, which is mostly outside the RGS bandpass. The procedures and results are summarized in §3. In §4, we discuss the model proposed by Lee et al. (2001) and compare it directly to the RGS data. We also describe in detail our measurements of the ionized absorber parameters, as well as the possible existence of absorption by dust and the limits on the column densities. Having characterized the contributions of the extended absorbing medium, we demonstrate that the intrinsic spectra of both MCG6-30-15 and Mrk 766 are not smooth, but instead consist of discrete jumps. We interpret these jumps as blue emission edges of carbon, nitrogen, and oxygen Ly recombination lines produced in the inner regions of a relativistic accretion disk, which are described in §5. We briefly summarize our results in §6.
2 Observations and Data Reduction
Mrk 766 was observed with XMM-Newton (Jansen et al., 2001) during the Performance Verification phase on May 20, 2000. MCG6-30-15 was observed during the Guaranteed Time Observations phase on July , 2000. The instrument modes for the Reflection Grating Spectrometer (RGS; Den Herder et al. 2001), the European Photon Imaging Cameras (EPIC) MOS (Turner et al. 2001) and PN (Strüder et al. 2001), and the Optical Monitor (OM; Mason et al. 2001), as well as the associated exposure times for both observations, are summarized in Table 1.
The data were processed through the XMM-Newton Science Analysis Software (SAS v5.3.3) using the calibration database released with the software. For the RGS, we extract events from a region in dispersion/cross-dispersion coordinates, which contains 90% of the source counts. The data are then screened through a dispersion/pulse-height filter to extract the first order dispersed photons. This region contains 90% of the CCD pulse-height redistribution function. Dispersion coordinates are then converted to photon wavelength using the most up-to-date calibration data. The resulting wavelengths are accurate to within mÅ (Den Herder et al., 2001), which corresponds to a velocity uncertainty of at 20 Å. The background spectrum was generated using the entire region of the CCD array excluded by a 95% source extraction region. The effective areas were calculated for the extraction regions described above. The data used here are identical to those presented in Branduardi-Raymont et al. (2001). The effective areas, however, are slightly updated to correctly account the shape and depth of the instrumental oxygen edge particlularly near threshold. In addition, chip-to-chip variations in the CCD quantum efficiencies (%) have been calibrated using deep exposures of several bright continuum sources. Both of these features have been incorporated into the calibration database released with SAS v5.3.3.
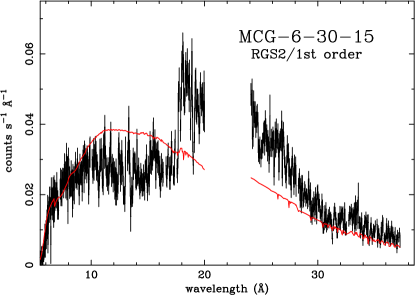
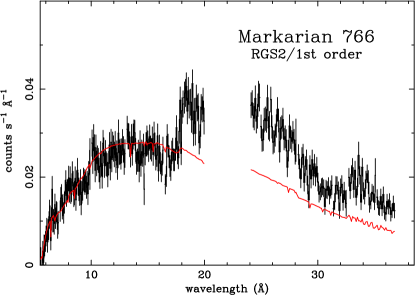
We use the time-integrated spectrum for all of our spectral analyses. In all cases, RGS1 and RGS2 data are simutaneously fit, although in most cases, we show only the RGS1 for clarity. For both MCG6-30-15 and Mrk 766, the spectrum in the wavelength range Å is not covered by RGS2 due to a malfunctioning of CCD4. The observations were, however, performed prior to the malfunctioning of CCD7 on RGS1, which cover the range Å. The RGS spectrum of MCG6-30-15 is of high statistical quality with per mÅ bin at the peak of the spectrum near Å, which is times higher than that of the Chandra HETG data presented in Lee et al. (2001) in the same spectral region. Near the O VII He complex (Å), which is not covered by RGS2, the RGS1 spectrum contains only per mÅ bin. This is still more than in the Chandra spectrum, since the HETG efficiency drops by a factor of from 19 Å to 22 Å, while the RGS effective area decreases by only %. The resolving power of the RGS however, is a factor of lower, so the figure of merit for detecting isolated lines, which is proportional to where is the effective area and is the resolving power, is times higher with the RGS for Å. The spectrum of Mrk 766 is substantially noisier, with per mÅ bin in the same region.
The spectra of MCG6-30-15 used for fitting are binned using a constant dispersion width of , which corresponds to approximately Å at Å and Å at Å. Throughout most of the bandpass (Å), each spectral bin contains at least 20 counts. The bin sizes adopted for the Mrk 766 spectra are larger by a factor of 2 owing to the fewer number of counts detected. Unless otherwise stated, the data are also plotted using these binning schemes.
The EPIC MOS and PN spectra were generated from a circular extraction region centered on the source with radii of and for MCG6-30-15 and Mrk 766, respectively. The effective area curves were calculated based on this extraction region. Background spectra were generated using events that lie on off-axis regions on the same chip. For the purposes of our analyses, we use the EPIC data only for the determination of the high energy power law continuum, but as shown in Page et al. (2001) in the case of Mrk 766, the general characteristics of the spectra from all three instruments (RGS, EPIC PN and MOS ) agree well to within the instruments’ calibration uncertainties. The same is true for MCG6-30-15.
Throughout the analysis, we adopt cosmologial redshifts of for Mrk 766 (Smith et al., 1987) and for MCG6-30-15 (Fisher et al., 1995), and Galactic absorption column densities of for MCG6-30-15 (Elvis, Lockman, & Wilkes, 1989) and for Mrk 766 (Murphy et al., 1996). The uncertainties in the redshifts () are much smaller than the resolving power capabilities of the instrument. All errors quoted throughout the paper correspond to 90% uncertainties for a single parameter unless otherwise stated.
3 High Energy Spectrum
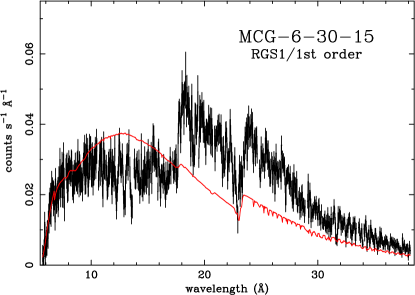
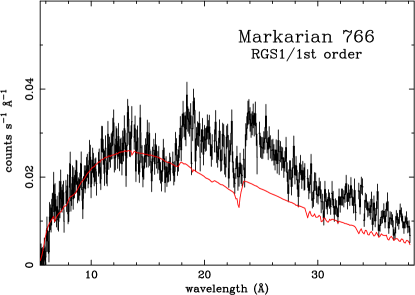
We first characterize the underlying power law continuum radiation using the EPIC MOS and PN data in the region, excluding the region containing the broad iron K line (). Both sources exhibited significant flux variability during the observations, as shown in Figure 1. For the time-averaged spectrum of MCG6-30-15, the best fit power-law slope is with a normalization of at 1 ke V. The integrated flux between is , which corresponds to an anomalously low state compared to those studied with the Ginga, ASCA, BeppoSAX, and XTE observations of MCG6-30-15 (Matsuoka et al. 1990; Nandra, Pounds, & Stewart 1990; Fabian et al. 1994; Orr et al. 1997; Guainazzi et al. 1999; Lee et al. 2000), but similar to the “deep minimum” state presented by Iwasawa et al. (1996). For comparison, we note that the observed spectral index is nearly identical to that during the HETG observation of MCG6-30-15 (; Lee et al. 2001). The flux level, however, is % lower during the XMM-Newton observation. The time-averaged PN spectrum of Mrk 766 shows with a normalization of at 1 ke V, which differs slightly from the parameters published by Page et al. (2001) owing to several updates in the instrument calibration data. The EPIC PN and MOS were shut off during a large background flare for the first of the observation. Inspection of the background-subtracted RGS data during this epoch shows that the source count rate is slightly higher than during the remainder of the observation. The average RGS count rate including this epoch is % higher than that excluding it. We, therefore, rescale the normalization of the power-law to at 1 ke V. Shown in Figure 2 are the derived high energy power-law continua superimposed on the RGS data.
In both sources, the spectra from all three instruments (RGS, PN, and MOS) show large excess flux in the soft X-ray band above the extrapolation of the high energy power-law continuum. Shortward of Å (), the spectrum of MCG6-30-15 shows a model excess, which is mostly due to the forest of absorption lines by Fe L ions, as discussed in detail below. The spectrum of Mrk 766 in the same region shows evidence only for very weak absorption.
The observed excess emission in the soft X-ray band is not an artifact due to, for example, spectral softening with increasing flux, as generally suggested from previous observations of MCG6-30-15 (Pounds, Turner, & Warwick 1986; Matsuoka et al. 1990; Fiore et al. 1992; Lee et al. 2000) The data consistently show comparable excess emission throughout the entire XMM-Newton observation. Absolute and cross-calibration uncertainties are much smaller than the observed excesses.
MCG6-30-15 is well-known for its broad iron K line, which has been interpreted as fluorescent emission from a cold medium, distorted by Doppler and gravitational effects in the vicinity of a massive black hole (Tanaka et al., 1995; Fabian et al., 1995). Recently, however, Wilms et al. (2001) have shown using EPIC PN data collected simultaneously with the RGS data presented here, that the high-energy spectrum of MCG6-30-15 during this epoch is consistent with reflection from a highly-ionized relativistic accretion disk. The best-fit model consists of an extremely broad line with a rest-frame energy that is consistent with that of H-like iron. The equivalent width of the line is found to be with an extremely steep radial emissivity profile (, where the line emissivity ).
We note that the precise determination of the power-law slope is difficult for MCG6-30-15, since there is essentially no region in the spectrum with a true power law. The soft X-ray region contains various absorption and emission features, while the hard X-ray spectrum exhibits a broad iron line. Wilms et al. (2001) have used approximately half of the total exposure time, and have shown that for the various models that provide adequate fits to the EPIC PN spectrum. Normalizing the flux at , where the effects of soft X-ray emission/absorption and the contributions from the broad iron line are minimal, the variance in the power-law slope produces a flux difference of at most % at . The observed excess emission is much larger than this value and, therefore, our conclusions are not affected qualitatively.
Mrk 766 is known to exhibit rapid, complex spectral and temporal variability (Molendi, Maccacaro, & Schaeidt, 1993; Molendi & Maccacaro, 1994; Leighly et al., 1996; Page et al., 1999; Matt et al., 2000; Boller et al., 2001; Page et al., 2001). Using several observations with ASCA and ROSAT, Leighly et al. (1996) and Page et al. (1999) have demonstrated that variability is observed mostly in the ( Å) region, where the spectrum is dominated by the power-law component. The much softer component observed in the ROSAT data, on the other hand, is relatively steady, and it has been suggested that it originates from the accretion disk. Page et al. (2001) have also identified a broad emission line from highly ionized iron near in the EPIC data of Mrk 766. In contrast to that of MCG6-30-15, we believe that the power-law slope derived from the EPIC data of Mrk 766 is relatively robust, since the observed absorption features are much weaker in this source.
Throughout this paper, we assume that the power-law continuum parameters derived from the , excluding the broad iron line region () represent the true high energy continuum shape in these sources. This may not necessarily be an adequate assumption, since we do not know a priori whether, for example, the opacity in the warm absorber is negligible near or whether the broad spectral feature in the iron K region is really an emission feature. Due to the relatively complex nature of this problem, we do not explore other possible continuum shapes in this paper. We are, however, investigating these possibilities, to be discussed in a future article (Kinkhabwala et al., 2003).
4 Explicit Test of the Lee et al. (2001) Model
The spectral model for MCG6-30-15 proposed by Lee et al. (2001) to fit the Chandra HETG data consists of a power-law () continuum, plus a soft component represented by either a faint blackbody with or an additional steep power-law with . The model also includes absorption by neutral atoms in dust grains and by highly ionized atoms in a warm external medium. In this section, we investigate whether this dusty warm absorber model can also provide an adequate representation of the higher statistical quality RGS data, which cover also the long wavelength region (Å) outside the HETG bandpass.
The ionized absorption components are characterized as follows. For each discrete transition, we calculate absorption line profiles using oscillator strengths and radiative decay rates from Verner, Verner, & Ferland (1996) for the K-shell ions. The photoelectric opacity is calculated self-consistently as well, using cross sections from Verner et al. (1996). For the oscillator strengths, radiative and autoionization rates, and photoelectric cross sections of L-shell ions of oxygen and iron, we use our own atomic data, calculated with the Hebrew University/Lawerence Livermore Atomic Code (HULLAC; Bar-Shalom, Klapisch, & Oreg 2001). Decay rates and oscillator strengths calculated with HULLAC may be inaccurate by as much as %, and the wavelengths are accurate to within mÅ. For the strong Fe L resonance lines, we use laboratory transition wavelength measurements of Brown et al. (2000). We also use values published by Pradhan (2000) for the strong O VI inner-shell absorption line properties. Each ion is treated as a single component in the spectral fit, and is characterized by three parameters: (1) the ion column density , (2) the turbulent velocity width or -parameter defined as , where is the Gaussian width, and (3) the Doppler velocity shift. We note that the lines in the data appear unresolved with both the RGS and the HETG and, therefore, the -parameter cannot be measured directly. The equivalent width ratios for lines from a given ion are, however, sensitive to the intrinsic line width, so we fit all lines from a given ion simultaneously, even in cases where some of the lines are saturated.
This method, in most cases, allows for rather tight constraints to be derived individually on both and the -parameter. At column densities of , the lines are at most mildly saturated and so the equivalent widths increase linearly with column density and do not depend on the -parameter. In this limit, the column density can be determined with a relative uncertainty that is smaller than the uncertainties in the measured , but the -parameter is unknown. For , the change in the is due to absorption in both the Doppler and damping wings111Note that since the transition probabilities of X-ray lines are much larger than those of typical optical and UV lines by orders of magnitude, absorption in the damping wings become important at a relatively lower column density. As a consequence, strong X-ray resonance lines have only a very narrow range in column density where the curve of growth is logarithmic. and, therefore, the ratio depend sensitively on both the column density and the -parameter.
This spectral fitting method is purely empirical, and unlike global models that are typically characterized by an ionization parameter, equivalent hydrogen column density, velocity field, etc., we make no assumptions regarding the ionization and thermal balance of the absorbing gas. Hence, the number of parameters is large (each ion column density is a free parameter). On the other hand, since the assumptions are minimal, the fitting procedure is computationally efficient and convergence is achieved typically on the order of minutes. In addition, for components that are unresolved in velocity space, each ion is characterized by a single column densitiy, which may or may not be an adequate description of the true physical situation as there may be numerous spatially distinct regions in the absorber with the same outflowing velocity but different turbulent velocities. The data, however, are not sensitive to the various possible physical scenarios.
With the exception of the O VII He-like triplet region, we ignore the effect of re-filling of absorption lines from resonance line photons that scatter into our line of sight. This is an excellent approximation for most transitions with upper levels that lie above the lowest excited state (e.g., He, He, etc.). For the lowest transitions (i.e., He), however, this approximation may not be entirely valid, as discussed in the following section. We check for self-consistencies whenever possible. We finally note that possible line emission from collisionally ionized plasma is likely to be completely negligible in filling in the observed absorption lines, as it requires an unusually large emission measure of . This is orders magnitude more than observed in even the most intense starburst galaxies (e.g., NGC 253, Pietsch et al. 2001; M82, Read & Stevens 2002) .
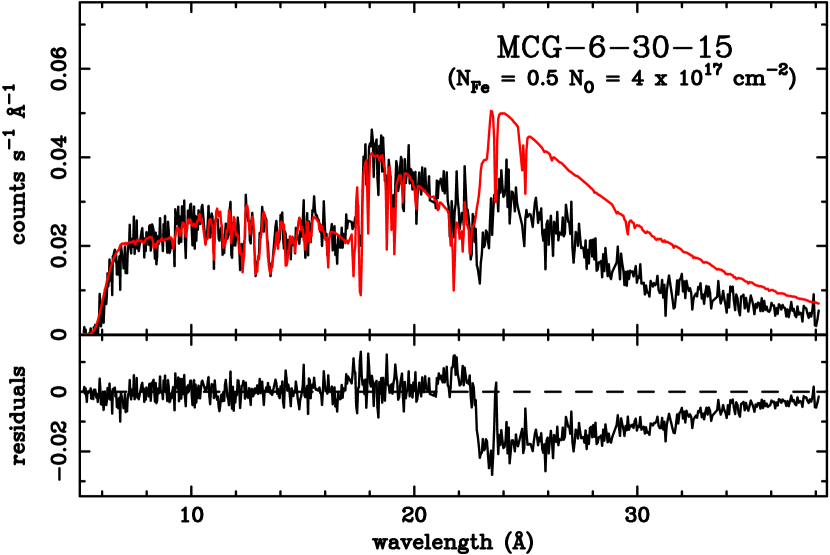
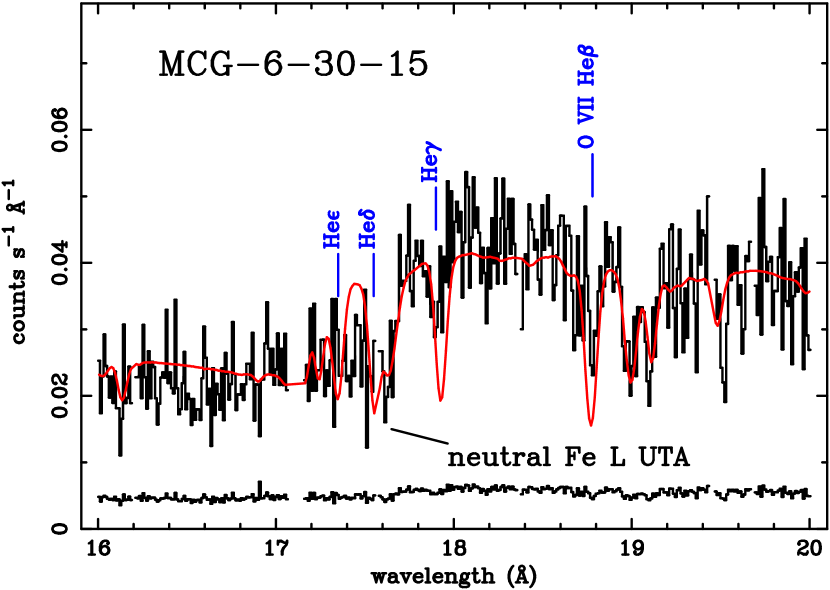
We first test a model in which the power-law index and normalization are fixed to those derived from the EPIC data, and the blackbody temperature to (Lee et al., 2001). Since the normalization of the blackbody component is not quoted in Lee et al. (2001), we scale the flux to the measured spectrum near Å. The flux in the blackbody component corresponds to a circular surface area with a radius of . Ionic column densities and the parameter values are allowed to vary in the fit. The resulting fit is shown in Figure 3. As is evident from the figure, the model fits the overall shape of the spectrum fairly well below Å, i.e., in the region of overlap between the RGS and Chandra HETG bandpasses. This model, however, grossly overestimates the flux above Å, as well as the equivalent widths of the oxygen absorption lines. The mismatch between the model and the data is largest just above the neutral oxygen edge and gradually improves towards longer wavelengths (see Figure 3). The energy dependence of the residuals cannot be modeled as some form of additional absorption, since photoelectric cross sections decrease towards shorter wavelengths. A steeper power-law in place of the blackbody component provides an even worse representation of the data, as it produces more flux towards longer wavelengths than a blackbody.
Lee et al. (2001) interpret the sharp drop near Å as a combination of O VII ( Å) and neutral iron L-shell ( Å) absorption. Although the general characteristics of their predicted feature are indeed close to what we observe, this interpretation cannot explain the detailed shape of the spectrum. The corresponding O VII absorption line equivalent widths are overpredicted, as discussed in detail in §4.1.1. If we assume that the underlying continuum is smooth across this feature as in Lee et al. (2001), the model flux between the O VII He ( Å) and He ( Å) lines lies above the data, owing to the lack of O VII and neutral iron opacity in this narrow wavelength region. Additional velocity broadening improves the fit somewhat, however, at the expense of overpredicting the He, , and absorption . We find that absorption by neutral iron is required by the data, but with a much lower column density than posited by Lee et al. (2001) (see §4.2). The data, however, are much better fit if the flux of the underlying continuum emission increases gradually from Å to Å.
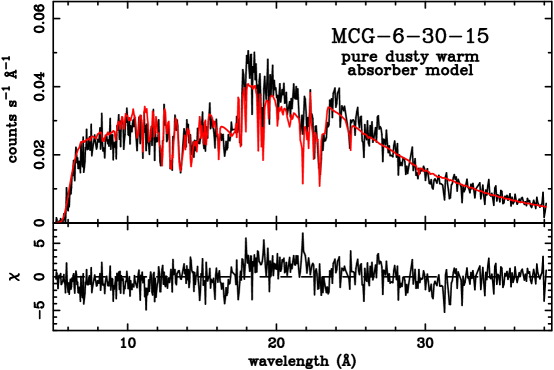
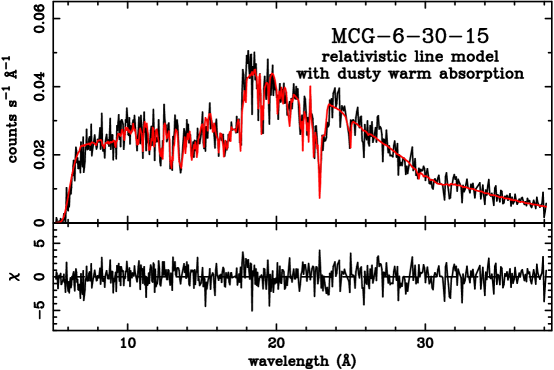
When we allow the blackbody temperature and normalization to be free, the fit improves dramatically. The details of the spectrum, however, cannot be well-reproduced, and the model still leaves broad features in the residuals that are significantly above the noise level of our data, as shown in Figure 4. In addition, the absorption line equivalent widths, particularly of O VII, are overpredicted by the model. Therefore, a pure dusty warm absorber model with a power law plus blackbody emission as the intrinsic continuum cannot explain the overall spectrum, even if we allow for arbitrarily high ion column densities that produce observable photoelectric edges and, in addition, overestimate the absorption line equivalent widths. Again, a broken powerlaw that steepens in the softer band ( Å) instead of a blackbody component provides a worse representation of the data.
4.1 Detailed Measurements of the Ionized Absorption Parameters
We now turn to describe our own parametrization of the ionized absorber in MCG6-30-15 and Mrk 766, following the procedures described in §4.
4.1.1 MCG6-30-15
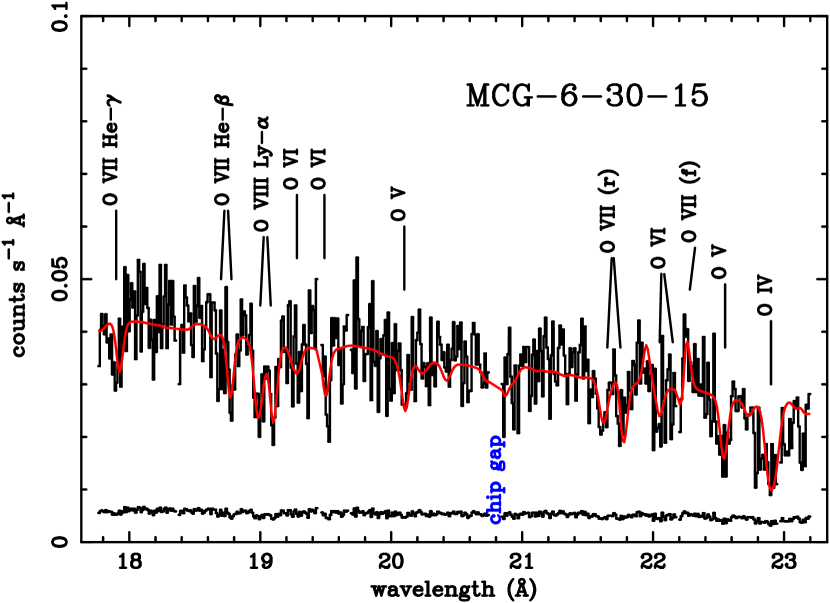
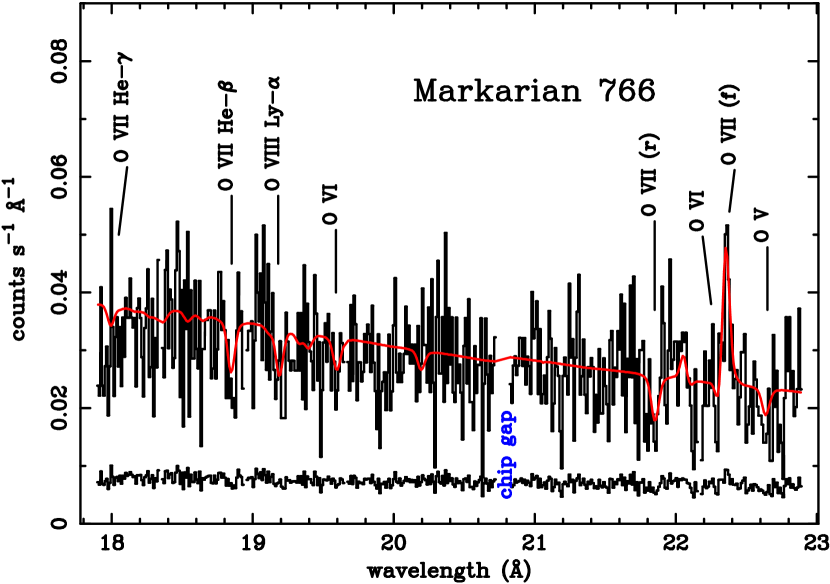
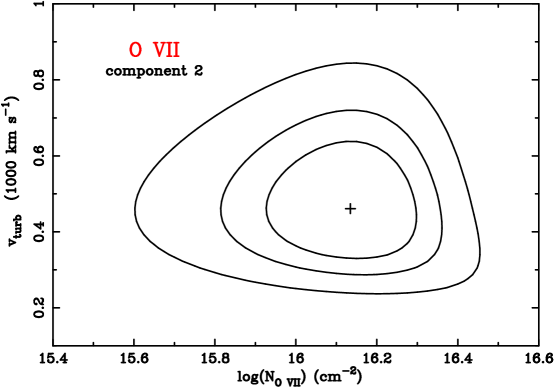
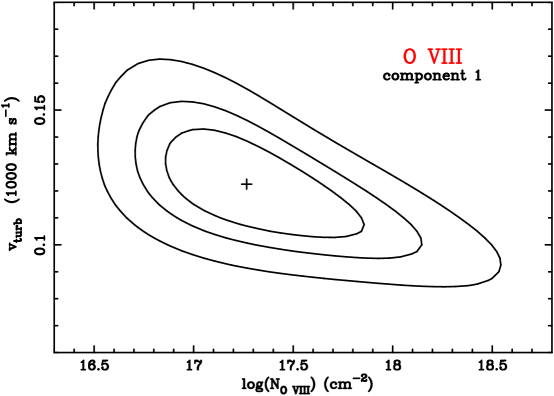
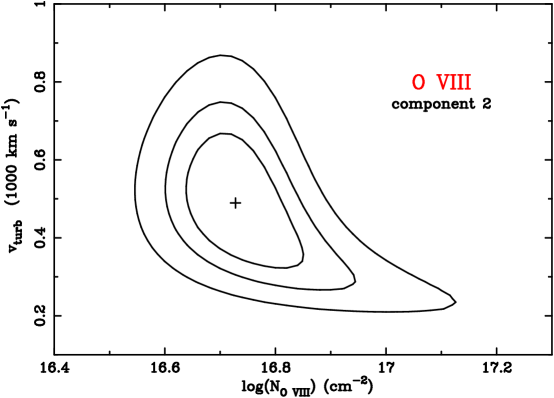
The O VIII Ly ( Å) and O VII He ( Å) absorption line profiles show at least two distinct kinematic components, both of which are blueshifted with outflowing velocities of and (hereafter, components 1 and 2, respectively), where the errors consist of statistical as well as systematic uncertainties in the wavelength calibration. Multiple velocity components have been observed in the X-ray band also in IRAS 13349+2438 (Sako et al., 2001) and in NGC 4051 (Collinge et al., 2001). We first derive the column densities and turbulent velocities from the ionized oxygen lines in the Å band. This region of the spectrum contains the resonance transitions of O VIII Ly, He, , and lines of O VII, as well as all of the inner-shell resonances of O VI - O IV. For the present purpose, we do not use the region of the spectrum shortward of Å, since the modeling of the underlying continuum across this wavelength range is not a straightforward task, and the only detectable absorption feature, in any case, is the O VIII Ly line. Absorption lines from all of the ions listed above are present in the data as shown in Figure 5, and they collectively provide constraints on the turbulent velocity width and the individual ion column densites. The bulk velocity shifts and turbulent velocity widths of each oxygen ion, with the exception of O IV, are tied, and are allowed to vary in the fit. The O IV absorption line complex cannot be fit by the velocity shift and width derived from the O VIII - O V lines, which we believe is mainly due to the inaccuracy of the present wavelength calculations of the order mÅ. The spectrum also shows a weak, but statistically significant, forbidden emission line of O VII at Å. We use this line to normalize the amount of O VII recombination emission, which can partially fill the resonance absorption line, as well as the higher series absorption lines. We empirically model the underlying continuum locally as a single power law with Galactic absorption. The best-fit value for the slope is with a normalization of at 1 ke V, which is slightly flatter and much brighter than that of the high energy region determined from the EPIC data. This implies the presence of an additional spectral component, which is flatter than the primary power-law. We emphasize that the continuum parameters derived above are purely empirical, and are used only for the sake of measuring the absorption parameters.
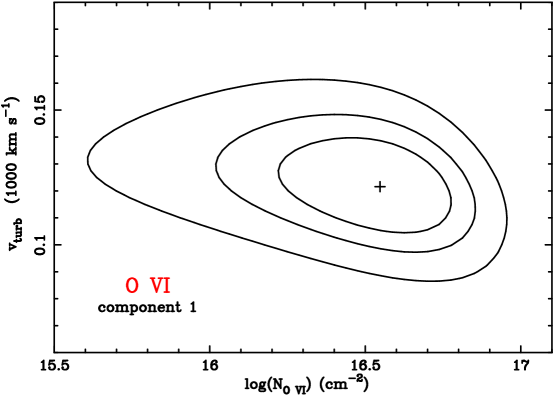
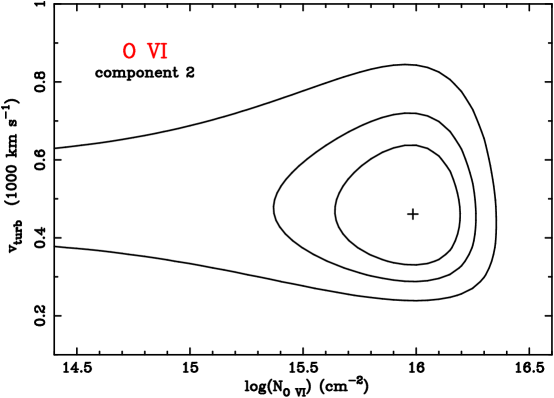
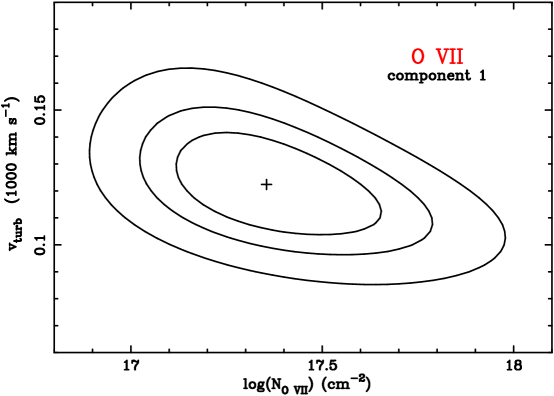
The measured oxygen ion column densities for the two kinematic components are listed in Table 2. The best-fit turbulent velocity widths are found to be and . Also shown in Figures 7, 8, and 9 are the 68, 90, and 99% two-parameter confidence regions for the -parameter and the ion column densities of O VI – O VIII. The O VII column densities are particularly important for comparison to the Lee et al. (2001) model. For the two components, we obtain (O VII) and (O VII) , both of which are lower by at least an order of magnitude than what is required to produce a photoelectric absorption edge with at threshold; a value claimed by Lee et al. (2001) to explain the spectral jump near Å. The 99% upper limit of component 1 is still a factor of lower. The data, therefore, invalidate any model that abscribes the turnover of the spectrum at Å to O VII photoelectric opacity.
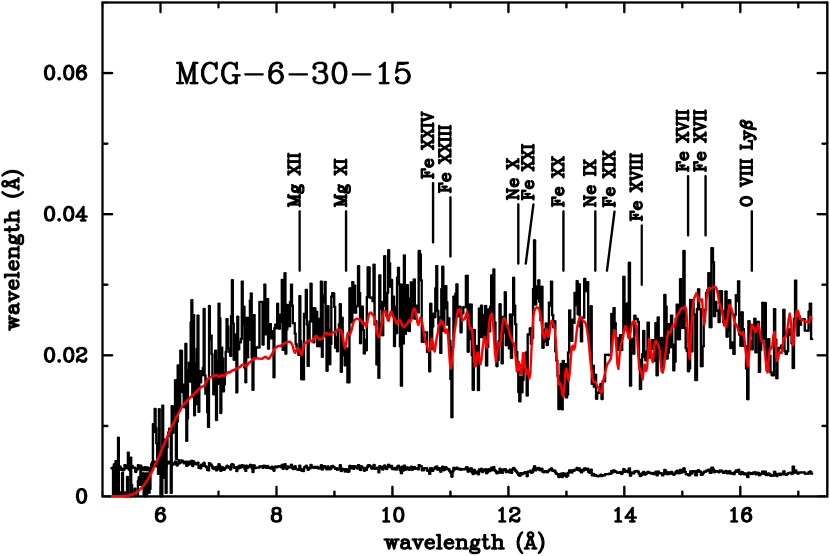
Using the velocity shifts and widths derived from the oxygen absorption lines as described above, we measure the column densities of ions with discrete transitions in the Å region. Absorption lines from Ne IX, Ne X, Mg XI, Mg XII, and Fe XVII – Fe XXIV are clearly detected in the spectrum. The resulting fit is shown in Figure 10, and the measured column densities for these ions are also listed in Table 2. A typical one-parameter 90% confidence range for the column density is dex. There is a broad absorption trough in the Å region. This is probably due to the presence of a weak () unresolved transition array (UTA) of iron (Chenais-Popovics et al., 2000; Sako et al., 2001; Behar, Sako, & Kahn, 2001), which is also included in the model. Note that many of the absorption lines are blended, but the procedure of self-consistently fitting the entire ion absorption spectrum for each charge state allows for a robust determination of the individual ion column densities.
We note that the velocity width of component 2, which was derived from the observed equivalent width ratios of the oxygen absorption lines, may possibly be due to the presence of additional discrete kinematic components that are unresolved with the RGS. This is possible, since the derived ion column densities of O VIII – O VI in component 2 are such that the strongest resonance lines are still in the optically thin limit, and, therefore, the absorption equivalent widths for all of the lines increase linearly with line optical depth. On the other hand, component 1 most likely consists of a single velocity component, because the strongest lines are saturated, and the measured equivalent width ratios provide unique column densities for each of the ions.
From the relative distributions of the ion column densities listed in Table 2, the range in ionization parameter (, where is X-ray luminosity, is the proton number density, and is the distance from the continuum source) of component 1 is , based on calculations with the photoionization code XSTAR (Kallman & Krolik, 1995). Although the derived range is only approximate, it is clear that a single-zone model cannot explain, for example, the observed distribution of the oxygen and iron column densities. As mentioned briefly above, both velocity components could, in principle, consist of more than one spatially distinct region, which cannot be resolved with the present data. Assuming that the iron abundance in MCG6-30-15 is roughly twice solar (Lee et al., 1999), the estimated equivalent hydrogen column density of component 1 is . Similarly, for component 2, the approximate range in ionization parameter is with a column density of . Again, a single-zone model cannot explain the observed column density distribution.
The presence of a broad range in ionization parameter has also been inferred from X-ray observations of the Seyfert 2 galaxy NGC 1068 (see, e.g., Kinkhabwala et al. 2002). In addition, spatially-resolved spectroscopy with the Chandra grating spectrometers of the same source shows that the ionization structure of the extended photoionized medium is not radially stratified, but, instead, consists of a broad range in ionization parameter at various radii from the central continuum source, suggesting that the medium is highly clumped with density inhomogeneities that span at least a few orders of magnitude (Brinkman et al., 2002; Ogle et al., 2003). Unfortunately in Seyfert 1 galaxies, the warm absorber is spatially unresolved and, hence, its location relative to the central black hole is entirely unknown. It is highly likely, however, that the density and ionization structures are similar to those seen in Seyfert 2 galaxies.
There are important similarities, as well as differences, in the details of the absorption measurements between those quoted in Lee et al. (2001) using the Chandra HETG and our measurements using the RGS data. The measured equivalent width, , of the O VII He resonance absorption line in the Chandra data is mÅ, and is completely compatible with the RGS data, which shows mÅ. The measured O VII He forbidden line in the RGS data accounting for partial absorption by O VI, however, is mÅ, which is a factor of lower than that seen in the HETG spectrum, but probably within their statistical uncertainty. This is, again, due to the low signal-to-noise ratio of the HETG spectrum, which contains only a few counts per resolution element ( mÅ) in the oxygen region.
There is a limit to the amount of resonance absorption line that can be filled in, given the measured of the forbidden emission line. The forbidden line in a photoionized He-like ion is produced solely through recombination and subsequent cascades and, therefore, its line intensity provides a measure of the He-like ion photoionization rate that occur in the plasma. The resonance line, on the other hand, is affected by discrete photoexcitation by the continuum radiation field as well, and the measured line flux has contributions from both cascades following recombination and radiative decay following photoexcitation. Resonance line cross sections, however, are several orders of magnitude larger than photoionization cross sections. Since the resonance lines saturate at much lower column densities, the forbidden to resonance line ratio, therefore, provides a sensitive measure of the total ion column density through the emission region for a given velocity width.
If the column density through the medium is high, such that at the photoelectric edge as quoted in Lee et al. (2001), the number of photoionizations dominates over that of photoexcitations in producing the resonance line, and the forbidden to resonance () line ratio is close to what one expects from pure recombination, as in the calculations of Porquet & Dubau (2000). Recalling that the measured equivalent width of the resonance absorption line of O VII is mÅ and that of the forbidden line in emission is mÅ, and using the fact that the to ratio in a recombination-dominated plasma is , the estimated total absorption of the line, after subtraction of the re-emitted resonance line radiation, is mÅ. This corresponds to an O VII ion column density of . That is, again, more than an order of magnitude lower than (), and is, therefore, not self-consistent. On the other hand, if the column density is lower (), the to ratio may be as low as , in which case the total absorption is mÅ. The corresponding column density, in this case, is , and is in much better agreement with our measurements. Note that, for pure absorption by O VII at a column density of , the predicted He absorption is mÅ for , which is much larger than observed in both the Chandra HETG and XMM-Newton RGS data. We note that the above estimate for the amount of resonance absorption line re-filling is really an upper limit, since resonance line photons that are re-emitted or produced through recombination cascades also suffer subsequent scatterings as they travel through the photoionized medium. For a more general and complete treatment of photoexcitation and photoionization, see Kinkhabwala et al. (2002, 2003).
The estimate of the column density described above is fairly insensitive to the geometry of the absorbing medium, since we are comparing the of the forbidden line, which is produced entirely through recombination, to that of the resonance line. There are, however, other possible geometric configurations that can, in principle, reproduce the observed O VII He-like triplet ratio. We note that the problem with a high O VII column density interpretation is that the amount of resonance line re-filling as determined from the forbidden line flux is insufficient to account for the observed resonance absorption line , as discussed above. This problem can be avoided if one considers a region with low O VII column density (to enhance the resonance line relative to the forbidden line) and high covering fraction (to match the flux of the observed forbidden line). We estimate that the required covering fraction must be approximately times larger than the covering of the absorber along the line of sight, and the column density must be . In addition, this region cannot be intercepted by the absorber as seen from the observer, since the emitted resonance line photons will then be absorbed almost entirely. Although this geometry is able to reproduce the observed O VII He triplet ratio, it cannot reproduce the observed of the higher series lines. Since the amount of re-filling in these lines is smaller compared to that of the He line by roughly their respective oscillator strength ratio, it overpredicts the absorption substantially. It is also rather ad hoc and contrived, as it would seem to make the identification of the absorber with the emitter and its self-consistency as argued above a pure coincidence.
In addition, the high-velocity component does not seem to be present in the Chandra HETG spectrum, possibly due to intrinsic variability of the line-of-sight warm absorber properties. The O VII column density of this component, however, is more than an order of magnitude lower than that of component 1, and, therefore, imposes only a negligible contribution to the total O VII edge opacity. On the other hand, the opacity of iron L-shell ions in this kinematic component, particularly those of Fe XX – Fe XXIII, are non-negligible. No comparison of the derived iron L properties with the HETG data can be made, however, since Lee et al. (2001) did not publish the Chandra HETG data above ( Å).
Variability of the warm absorber in the soft X-ray band ( ke V) was observed in MCG6-30-15 by ASCA (Fabian et al., 1994; Reynolds et al., 1995; Otani et al., 1996). It was suggested that the observed correlation of the O VIII column density and the continuum flux, and the lack of variability in the O VII column density, are due to a two-zone nature of the absorbing medium. Orr et al. (1997), however, found that this model is not consistent with their BeppoSAX data. Morales, Fabian, & Reynolds (2000) later demonstrated that an additional, third zone can provide an adequate explanation. As we have shown, however, the opacity above the O VIII photoelectric edge is dominated by iron L ions. The significance of the inferred correlation with flux, therefore, is unclear.
4.1.2 Mrk 766
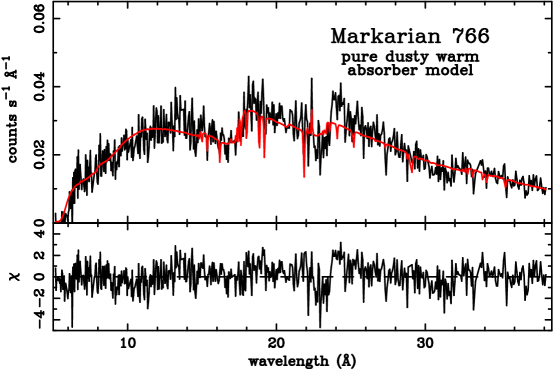
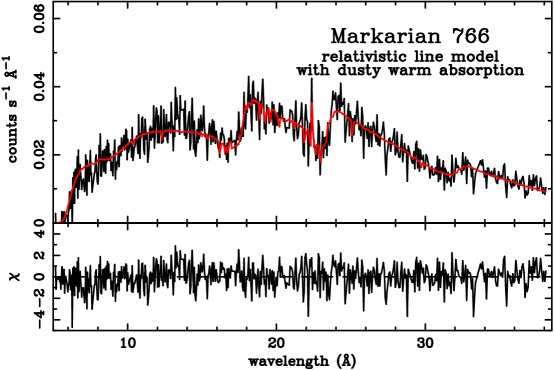
The absorption lines observed in Mrk 766 are much less prominent than those in MCG6-30-15. The spectrum, however, is of somewhat lower statistical quality, owing to the shorter exposure time and lower intrinsic flux during the observation (see Figure 6).
In addition, multiple velocity components are not detected in the Mrk 766 spectrum. Adopting a similar procedure for measuring the oxygen ion column densities as described above, we obtain , , , and (see Table 3). One-parameter 90% confidence ranges in the column densities are typically dex. The best-fit turbulent velocity is . These column densities are, again, much too low to produce observable photoelectric absorption. No obvious velocity shifts are detected, with an upper limit of .
The spectrum below Å is fairly well represented by a single powerlaw that matches the high-energy continuum derived from the EPIC data (Boller et al., 2001; Page et al., 2001), and no obvious absorption features are detected from, for example, K-shell Ne and L-shell iron. Upper limits to the derived column densities are also listed in Table 3. As in the spectrum of MCG6-30-15, there is evidence for a broad absorption feature between Å, which is most likely due to the presence of a weak iron UTA.
4.2 Absorption by Dust Particles
Lee et al. (2001) argued that part of the sharp drop in the MCG6-30-15 spectrum is due to absorption by iron oxides in dust grains. The parameters derived by these authors (i.e., and in addition to Galactic absorption), however, are grossly incompatible with the RGS data. Using photoionization and resonance absorption cross sections of neutral iron calculated with HULLAC, we measure the atomic column density to be , which is a factor of lower than the derived HETG value. At least part of the reason for this discrepancy is due to the fact that the absorption cross sections published by Kortright & Kim (2000), which were used in the HETG analysis, are underestimated owing to saturation effects through the sample filter. The RGS data do not show any obvious signatures of excess absorption by atomic oxygen at the systemic velocity of MCG6-30-15. If we assume that the underlying continuum is smooth across the oxygen K-edge, the inferred column density is consistent with zero with a 90% upper limit of . This is approximately two orders of magnitude lower than claimed for the HETG Lee et al. (2001) model, probably again due to their limited number of photons in that region. The shape of the spectrum across this wavelength region is also inconsistent with that of photoelectric absorption. The spectrum, therefore, is inconsistent with any reasonable value for the Fe:O ratio in standard dust models (e.g., Snow & Witt 1996). An Fe:O ratio of 1:2 with claimed by Lee et al. (2001) is fundamentally incompatible with the data (see Figure 3). Even in the most optimistic case of an Fe:O ratio of 1:1, the neutral O edge is still severely overpredicted compared to what is observed in the spectrum. Assuming an iron abundance of (Anders & Grevesse, 1989), our measurement indicates an equivalent hydrogen column density of , which is a factor of few lower than the lower limit derived by Reynolds et al. (1997) from the optical reddening assuming the Galactic value for the dust-to-gas ratio.
Laboratory measurements and theoretical calculations of Crocombette et al. (1995) first indicated that the iron L-shell opacity of iron oxides peaks near Å, which is mÅ longer than what is observed in the MCG6-30-15 spectrum. However, recent communications with that group have now revealed that there was an error in the wavelength scale in that paper (Crocombette 2000, private communication; Gautier-Soyer et al. 2001; Gota, Gautier-Soyer, & Maurizio 2000), and that the deepest resonance complex for iron oxides is instead centered at Å. While closer, this revised value still differs significantly from the wavelength of the observed edge-like feature in the MCG6-30-15 spectrum, by more than the uncertainty attributable to the RGS instrument. The observed position of this feature is much closer to that appropriate to pure iron, as measured by Kortright & Kim (2000), rather than iron oxides in dust grains. The Fe L absorption feature observed in the spectrum must, therefore, be due to either atomic or pure metallic iron.
Absorption by other elements that are expected to deplete onto dust are also not detected in the spectrum of MCG6-30-15. For example, neutral Mg and Si, whose K-shell edges are at Å and Å, respectively, are not seen in the data. The upper limits to their column densities are smaller than that of neutral oxygen with and at 90% confidence.
The spectrum of Mrk 766 does not show any obvious evidence for absorption by neutral iron at the galaxy’s systemic velocity. Additional absorption by neutral oxygen, however, is possible. If we assume that the underlying spectrum is smooth across the edge at Å, the derived neutral oxygen column density is , but the model still leaves excess residuals just above the edge near Å. In addition, the associated resonance absorption line at Å (Krause, 1994; Stolte et al., 1997; McLaughlin & Kirby, 1998; Paerels et al., 2001) is not detected at the galaxy’s systemic velocity. Resonance absorption by iron oxides in the range Å (Wu et al., 1997) is also not observed. The resulting empirical continuum is, again, flatter () and brighter ( at 1 ke V) than that inferred from the high energy region. As for MCG6-30-15, the Mrk 766 spectrum shows a complete absence of absorption features from other elements that are expected to deplete onto dust grains.
The question still remains as to what causes the reddening in the optical and the UV band. The RGS spectrum of another highly-reddened AGN, IRAS 13349+2438, does not show any obvious evidence for absorption by dust (Sako et al., 2001). The estimated reddening in this galaxy is (Wills et al., 1992), which is times smaller than in MCG6-30-15, where (Reynolds et al., 1997) and comparable to that in Mrk 766 (; Walter & Fink 1993). Whether this is due simply to the variation in dust composition or an inherent inaccuracy of the estimates is currently unknown. It is also possible that the line of sight towards the X-ray source is nearly dust-free.
5 The Relativistic Accretion Disk Interpretation
As shown above, the ionic and atomic column densities measured from the fits to the absorption lines are too low to account for the spectral jumps observed in the data. In the spectra of both MCG6-30-15 and Mrk 766, the flux near Å nearly doubles within a wavelength region of Å. We interpret these features as due to Ly emission lines of carbon, nitrogen, and oxygen originating from the inner-most regions of a relativistic accretion disk, as in our original interpretation (Branduardi-Raymont et al., 2001). The profiles of these lines appear to be different from those expected for a disk rotating in a Schwarzschild metric, which predicts prominent blue and red peaks (see e.g., Fabian et al. 1989). Instead, the profiles look similar to those produced in an accretion disk around a Kerr black hole, where the radius of marginal stability is substantially smaller than in a Schwarzschild metric, and, therefore, the effects of relativistic distortion are larger. It is worth noting, however, that the nitrogen line in MCG6-30-15 shows evidence for a red peak centered at Å. This feature is in a relatively clean band of the spectrum (i.e., no strong absorption lines are expected or observed), and contains . The best-fit global models for MCG6-30-15 and Mrk 766 using emission lines originating from an accretion disk around a Kerr metric (Laor, 1991) are shown in Figure 12. Statistically, this description of the data is better than that provided by the best-case dusty warm absorber model by for 1148 degrees of freedom. The best-fit accretion disk parameters are very similar to those derived in Branduardi-Raymont et al. (2001), however, they are listed in Table 4 for completeness. Although we have chosen to tie the emissivity indices and the disk inner and outer radii for the three emission lines included in the fit, there is no reason to presume that these parameters for the three lines should be identical, as discussed briefly later in this section.
Theoretical spectra originating from an X-ray ionized accretion disk have been investigated by many authors (Raymond, 1993; Ross & Fabian, 1993; Matt, Fabian, & Ross, 1993; Ko & Kallman, 1994; Zycki et al., 1994). The details of the results predicted by the various models vary substantially, but there is one general property of an X-ray illuminated disk common to all model calculations – the existence of a highly ionized layer (X-ray skin) on the surface of the disk with appreciable Thomson optical depth in the vertical direction. This layer has a temperature close to the Compton temperature, which ranges from , depending on the shape of the ionizing continuum (Nayakshin, Kazanas, & Kallman, 2000; Nayakshin & Kallman, 2001). The medium is nearly fully ionized, with trace abundances of H-like ions of low- and mid- elements, as well as the iron L species.
As shown by Nayakshin, Kazanas, & Kallman (2000) and Nayakshin & Kallman (2001), the disk intrinsic flux has significant impact on the thermal/ionization structure of the surface layers of an accretion disk. When the X-ray flux exceeds the disk intrinsic flux , the ionization equilibrium curves (or S-curves) typically show three distinct thermally stable regions separated by unstable regions (Nayakshin & Kallman, 2001). However, if the disk flux is sufficiently large relative to the X-ray flux ( few ), the upper unstable region usually does not exist, mainly due to inverse Compton cooling by soft UV photons that affect the temperature structure at high ionization parameters.
To estimate the rough ionization and thermal structure of the irradiated disk, we use the photoionization code XSTAR (Kallman & Krolik, 1995), assuming that the medium is optically thin to the ionizing continuum. The spectrum we adopt is a power law with with a UV blackbody component of . Although the UV flux of both MCG6-30-15 and Mrk 766 are unknown, we assume that the disk-to-X-ray flux ratio is . The resulting S-curve is shown in Figure 13. We note that this value corresponds to the flux ratio as observed from the accretion disk surface and not from an observer at a distance. The former may be larger by orders of magnitude, since the UV source lies just beneath the ionized surface layer, whereas the X-ray source is believed to lie above the disk at an unknown distance, which could be much larger than the distance to the UV source. In order for our interpretation to hold, however, a value of is required.
Nayakshin, Kazanas, & Kallman (2000) show that the Thomson optical depth in the hot layer is given approximately as, , where is the pressure ionization parameter (, where is the incident X-ray flux, is the pressure, and is the speed of light) at which the transition between the hot and cold phases occurs and is the dimensionless gravity parameter, which characterizes the ratio of the vertical component of the gravitational force at one disk scale height to the incident radiation force (; see, Nayakshin & Kallman 2001). Recently, Li, Gu, & Kahn (2001) showed that thermal conduction between the hot and cold stable layers allows only a single, unique ionization parameter where the transition can occur. Adopting their method, we find that for the ionizing continuum specified above. The Thomson optical depth, therefore, is , where is the gravity parameter in multiples of 0.1. Although the numerical value for is uncertain, the derived Thomson depth is similar to our original estimate, which is based purely on the observed emission measures of the recombination lines (Branduardi-Raymont et al., 2001).
Above the transition region at , there are trace abundances of H-like ions of C, N, O, Ne, Mg, and Si, and substantial amounts of several charge states of L-shell Fe. Ion fractions of He-like ions are almost completely negligible. By integrating the fractional abundances along the hot stable branch, we find K-shell photoelectric absorption optical depths of H-like C, N, and O of , respectively, assuming solar abundances of Anders & Grevesse (1989). A large fraction of the total photoelectric opacity is produced near the transition region at where the fractional abundances of H-like C, N, and O are the highest. This indicates that most of the soft X-ray flux is absorbed in this layer before penetrating into the lower branch of the S-curve.
Since photoionization is balanced by recombination, essentially all of this flux is re-radiated into recombination line and continuum emission. If the edge optical depth is large (), and the covering fraction of the illuminated disk is , the equivalent widths of the resulting line emission are, therefore, on the order of their respective ionization potentials. For O VIII, this amounts to approximately a few hundred e V, much larger than what is observed in the RGS data (). Since the medium is almost completely optically thick to photoelectric absorption by O VIII, any recombination emission at wavelengths shorter than that of the K-shell edge of O VIII ( Å), is absorbed and eventually re-radiated into O VIII Ly, as suggested by Branduardi-Raymont et al. (2001). Recombination lines from Ne, Mg, Si, and most of the Fe L ions, lie above the O VIII photoelectric edge, and, therefore, most of the line and continuum radiation are converted into O VIII Ly.
Higher order Lyman transitions of carbon, nitrogen, and oxygen should also be suppressed by line opacity, given the high photoelectric optical depths inferred. After a few scatters, the excited levels for these lines decay via Balmer, Paschen, etc., emission, thereby contributing to the Ly lines. However, a reliable estimate of the Lyman line opacity is difficult given the geometry of the problem. One would naively expect the optical depth to be lowest in the vertical direction, but given the huge velocity shear in the disk, this is probably not the case. A detailed radiative transfer model for this problem would require at least a 2D calculation, which is beyond the scope of this paper, and will be deferred to future publications. So the absence of the higher Lyman series transitions in the observed spectra remains an open issue.
In cases where the disk intrinsic flux is sufficiently low, the S-curve separates into three stable branches. In such a case, the temperature in the hot layer is very close to the Compton temperature with only trace abundances of H-like C, N, and O. The photoelectric opacities are, therefore, small, and the re-radiated spectrum is nearly featureless in the soft X-ray band. This might explain why some Seyfert 1 galaxies exhibit these relativistic lines, and others clearly do not.
Recently, Ballantyne & Fabian (2001) argued against the relativistic line interpretation of the soft X-ray features in MCG6-30-15 based on their own model calculations of an irradiated disk. They find that: (1) the predicted O VIII Ly line EW is at most (2) comparable emission line equivalent widths from O VII must be observed, and (3) that these lines must be accompanied by observable amounts of Fe L line emission (specifically, Fe XVII and Fe XVIII) as well. One of the reasons for the discrepancy with our conclusions above is the difference in the ionization structure of the hot layer. For our calculations, the photoelectric opacity of O VII, Fe XVII, Fe XVIII is , respectively, and the resulting line emission is negligible compared to that of O VIII. On the other hand, the opacities of Fe XX – XXVI are non-negligible, and the recombination line fluxes are high enough to produce observable features, if radiative transfer effects are ignored. As discussed above, however, the opacity of O VIII is so large that almost all of the radiative power of Fe XX – XXVI is re-radiated into O VIII Ly.
In a later publication, Ballantyne, Ross, & Fabian (2002) were able to reproduce the large O VIII inferred from the data, but criticized the relativistic line interpretation by showing that (1) the strength of the N VII cannot be reproduced and (2) Compton scattering smears out the blue edge of the disk line profile. The former discrepancy can possibly be understood again as a radiative transfer effect, in which O VIII Ly line photons fluoresce with the N VII Ly line in an optically thick medium, the details of which are discussed in (Sako, 2003). In our view, the latter criticism is not a serious concern. Unlike in the case for iron, for example, where the abundance weighted K-shell photoelectric cross section is only a factor of few larger than the Thomson cross section, the abundance weighted K-shell photoelectric cross section of oxygen is more than two orders of magnitude larger for solar abundances. Therefore, the amount of Compton scattering relative to O VIII line production depends only on the trace abundance of O VIII in their particular model assuming either constant disk density or hydrostatic equilibrium with a smooth density profile. We speculate that reflection from an inhomogenous accretion disk, which more or less mixes regions from a range in ionization parameter, can suppress Compton scattering of the line by up to two orders of magnitude. The viability of such models remains to be investigated quantitatively. In any case, the discrepancy in the width of the blue edge is only a factor of few at most when the neutral iron UTA and edges are accounted for.
Vaughan & Edelson (2001) noted that the lack of correlation of the iron K line flux with the continuum in MCG6-30-15 cannot be understood in terms of a simple cold, irradiated disk, and suggested that this is likely to be due to the presence of an ionized layer above the disk. Unless this layer is extremely hot, such that all the elements are completely ionized (), recombination emission must be produced and should be observable, if the opacity is substantially high.
Wilms et al. (2001) have shown that the EPIC PN data of MCG6-30-15 exhibit an extremely broad line at a rest energy of , which is most likely produced by H-like iron. For the model described above, the photoelectric opacity of Fe XXVI through the disk is , while that of Fe XXV is . Therefore, a significant fraction of the incident continuum above is re-radiated in lines, and the observed equivalent width of can be qualitatively understood. The radial emissivity index inferred from the Fe line, however, is slightly larger than that inferred from the RGS data using the C, N, and O lines, but within the error bars. We note that the derived indices, in general, do not need to be identical, since, if the lines are produced through recombination, the radial emissivity profile does not necessarily trace the density profile. Various effects, such as temperature and ion fraction gradients, may be able to explain the discrepancy. Also, as noted by Wilms et al. (2001), returning radiation from the disk may affect the observed emissivity profile as well. A more quantitative investigation is certainly required, and will be discussed in a future publication.
If there are fluorescent iron lines produced below the ionized skin in a cold medium (in the cold stable branch of the S-curve), they must suffer multiple Compton scatterings as they travel through the hot medium. Since the temperature of the hot layer is still substantially lower than the iron K line energy, the photons will be down-scattered and broadened in addition to being subjected to relativistic effects (see also, Misra & Sutaria 1999). Note that this hot layer does not alter the shape of the direct continuum radiation, which is presumably formed above the accretion disk (cf., Reynolds & Wilms 2000; Ruszkowski et al. 2000). We also note that most of the iron L-shell ions (Fe XVIII – XXIV) that produce the forest of valence-shell absorption lines observed in the RGS data also absorb the ke V region in the inner-shell resonance transitions. Using the measured column densities of L-shell iron ions listed in Table 2 for MCG6-30-15, we estimate the total absorption equivalent width to be e V, capable of carving out a non-negligible portion of the blue emission edge of the relativistic line profile. Accounting for this opacity is important for detailed analyses of the broad iron K lines in Seyfert 1 galaxies.
6 Summary
By taking advantage of the extended wavelength coverage and high statistical quality provided by XMM-Newton, we have shown that the dusty warm absorber model posited by Lee et al. (2001) cannot explain the measured RGS spectra of either MCG6-30-15 or Mrk 766. The ionized oxygen column densities and turbulent velocity widths are well-constrained by the data, and eliminate the possibility that ionized oxygen makes any significant contribution to the observed edge-like feature near 17.5 Å. The absence of any discernible neutral oxygen edge, and the detailed structure of the 17.5 Å feature further suggest that absorption by iron oxides associated with dust is negligible in both spectra. By contrast, the model involving relativistic Ly emission lines of carbon, nitrogen, and oxygen, with some contribution from an ionized absorber, quantitatively provides a superior fit. The parameters characterizing these emission lines are roughly compatible with what would be expected for the surface layers of an irradiated accretion disk. While there are still outstanding theoretical questions associated with this interpretation, the relativistic line model more successfully reproduces the spectra of these two objects.
References
- Anders & Grevesse (1989) Anders, E., & Grevesse, N. 1989, Geochim. Cosmochim. Acta, 53, 197
- Ballantyne & Fabian (2001) Ballantyne, D. R., & Fabian, A. C. 2001, MNRAS, 328, 11
- Ballantyne, Ross, & Fabian (2002) Ballantyne, D. R., Ross, R. R., & Fabian, A. C. 2002, MNRAS, 336, 867
- Bar-Shalom, Klapisch, & Oreg (2001) Bar-Shalom, A., Klapisch, M., & Oreg, J. 2001, J. Quant. Spectr. Radiat. Transfer, 71, 169
- Behar, Sako, & Kahn (2001) Behar, E., Sako, M., & Kahn, S. M. 2001, ApJ, 563, 497
- Boller et al. (2001) Boller, Th., Keil, R., Trümper, J., O’Brien, P. T., Reeves, J., & Page, M. 2001, A&A, 365, L146
- Branduardi-Raymont et al. (2001) Branduardi-Raymont, G., Sako, M., Kahn, S. M., Brinkman, A. C., Kaastra, J. S., & Page, M. 2001, A&A, 365, L140
- Brinkman et al. (2002) Brinkman, A. C., Kaastra, J. S., van der Meer, R. L. J., Kinkhabwala, A., Behar, E., Kahn, S. M., Paerels, F. B. S., & Sako, M. 2002, A&A, 396, 761
- Brown et al. (2000) Brown, G., V., Beiersdorfer, P., Liedahl, D., A., Widmann, K., Kahn, S., M., & Clothiaux, E. J. 2002, ApJS, 140, 589
- Chenais-Popovics et al. (2000) Chenais-Popovics, C., et al. 2000, ApJS, 127, 275
- Collinge et al. (2001) Collinge, M. J., et al. 2001, ApJ, 557, 2
- Crocombette et al. (1995) Crocombette, J. P., Pollak, M., Jollet, F., Thromat, N., & Gautier-Soyer, M. Phys. Rev. B, 52 3134
- Elvis, Lockman, & Wilkes (1989) Elvis, M., Lockman, F. J., & Wilkes, B. J. 1989, AJ, 97, 777
- Fabian et al. (1989) Fabian, A. C., Rees, M. J., Stella, L., & White, N. E. 1989, MNRAS, 238, 72
- Fabian et al. (1994) Fabian, A. C., et al. 1994, PASJ, 46, L59
- Fabian et al. (1995) Fabian, A. C., Nandra, K., Reynolds, C. S., Brandt, W. N., Otani, C., Tanaka, Y., Inoue, H., & Iwasawa, K. 1995, MNRAS, 277, L11
- Fiore et al. (1992) Fiore, F., Perola, G. C., Matsuoka, M., Yamauchi, M., & Piro, L. 1992, A&A, 262, 37
- Fisher et al. (1995) Fisher, K. B., Huchra, J. P., Strauss, M. A., Davis, M., Yahil, A., & Schlegel, D. 1995, ApJS, 100, 69
- Den Herder et al. (2001) den Herder, J. W., et al. 2001, A&A, 365, L7
- Gautier-Soyer et al. (2001) Gautier-Soyer, M., et al. 2001, in preparation
- Gota, Gautier-Soyer, & Maurizio (2000) Gota, S., Gautier-Soyer, M., Maurizio, S. 2000, Phys. Rev. B, 62, 4187
- Guainazzi et al. (1999) Guainazzi, M., et al. 1999, A&A, 341, L27
- Iwasawa et al. (1996) Iwasawa, K., et al. 1996, MNRAS, 282, 1038
- Jansen et al. (2001) Jansen, F., et al. 2001, A&A, 365, L1
- Kaastra et al. (2000) Kaastra, J. S., Mewe, R., Liedahl, D. A., Komossa, S., & Brinkman, A. C. 2000, A&A, 354, L83
- Kallman & Krolik (1995) Kallman, T. R., & Krolik, J. H. 1995, XSTAR – A Spectral Analysis Tool, HEASARC (NASA/GSFC, Greenbelt)
- Kaspi et al. (2000) Kaspi, S., et al. 2000, ApJ, 535, L17
- Kaspi et al. (2001) Kaspi, S., et al. 2001, ApJ, 554, 216
- Kinkhabwala et al. (2002) Kinkhabwala, A., et al. 2002, ApJ, 575, 732
- Kinkhabwala et al. (2003) Kinkhabwala, A., et al. 2003, in preparation
- Ko & Kallman (1994) Ko, Y.-K., Kallman, T. R. 1994, ApJ, 431, 273
- Kortright & Kim (2000) Kortright, J. B., & Kim, S.-K. 2000, Phys. Rev. B, 62, 12216
- Krause (1994) Krause, M. O. 1994, Nucl. Instrum. Methods B, 87, 178
- Laor (1991) Laor, A. 1991, ApJ, 376, 90
- Lee et al. (1999) Lee, J. C., Fabian, A. C., Brandt, W. N., Reynolds, C. S., & Iwasawa, K. 1999, MNRAS, 310, 973
- Lee et al. (2000) Lee, J. C., Fabian, A. C., Reynolds, C. S., Brandt, W. N., & Iwasawa, K. 2000, MNRAS, 318, 857
- Lee et al. (2001) Lee, J. C., et al. 2001, ApJ, 554, L13
- Leighly et al. (1996) Leighly, K. M., Mushotzky, R. F., Yaqoob, T., Kunieda, H., & Edelson, R. 1996, ApJ, 469, 147
- Li, Gu, & Kahn (2001) Li, Y. X., Gu, M. F., & Kahn, S. M. 2001, ApJ, 560, 644
- McLaughlin & Kirby (1998) McLaughlin, B. M., & Kirby, K. P., 1998, J. Phys. B, 31, 4991
- Mason et al. (2001) Mason, K. O., et al. 2001, A&A, 365, L36
- Matt, Fabian, & Ross (1993) Matt, G., Fabian, A. C., & Ross, R. R. 1993, MNRAS, 262, 179
- Matt et al. (2000) Matt, G., Perola, G. C., Fiore, F., Guainazzi, M., Nicastro, F., & Piro, L. 2000, A&A, 363, 863
- Matsuoka et al. (1990) Matsuoka, M., Piro, L., Yamauchi, M., & Murakami, T. 1990, ApJ, 361, 440
- Misra & Sutaria (1999) Misra, R., & Sutaria, F. K. 1999, ApJ, 517, 661
- Molendi, Maccacaro, & Schaeidt (1993) Molendi, S., Maccacaro, T., & Schaeidt, S. 1993, A&A, 271, 18
- Molendi & Maccacaro (1994) Molendi, S., & Maccacaro, T. 1993, A&A, 291, 420
- Morales, Fabian, & Reynolds (2000) Morales, R., Fabian, A. C., Reynolds, C. S. 2000, MNRAS, 315, 149
- Murphy et al. (1996) Murphy, E. M., Lockman, F. J., Laor, A., & Elvis, M. 1996, ApJS, 105, 369
- Nandra, Pounds, & Stewart (1990) Nandra, K., Pounts, K. A., & Stewart, G. C. 1990, MNRAS, 242, 660
- Nayakshin, Kazanas, & Kallman (2000) Nayaksin, S., Kazanas, D., & Kallman, T. R. 2000, ApJ, 537, 833
- Nayakshin & Kallman (2001) Nayaksin, S., & Kallman, T. R. 2001, ApJ, 546, 406
- Ogle et al. (2003) Ogle, P. M., Brookings, T., Canizares, C. R., Lee, J. C., & Marshall, H. L. 2003, A&A, 402, 849
- Orr et al. (1997) Orr, A., Molendi, S., Fiore, F., Grandi, P., Parmar, A. N., & Owens, A. 1997, A&A, 324, L77
- Otani et al. (1996) Otani, C., et al. 1996, PASJ, 48, 211
- Paerels et al. (2001) Paerels, F., et al. 2001, ApJ, 546, 338
- Page et al. (1999) Page, M. J., Carrera, F. J., Mittaz, J. P. D., & Mason, K. O. 1999, MNRAS, 305, 775
- Page et al. (2001) Page, M. J., et al. 2001, A&A, 365, L152
- Pietsch et al. (2001) Pietsch, W., et al. 2001, A&A, 365, L174
- Porquet & Dubau (2000) Porquet, D., & Dubau, J. 2000, A&AS, 143, 495
- Pounds et al. (2001) Pounds, K., Reeves, J., O’Brien, P., Page, K., Turner, M., & Nayakshin, S. 2001, ApJ, 559, 181
- Pounds, Turner, & Warwick (1986) Pounds, K. A., Turner, T. J., & Warwick, R. S. 1986, MNRAS, 221, 7
- Pradhan (2000) Pradhan, A. K, 2000, ApJ, 545, L165
- Raymond (1993) Raymond, J. C. 1993, ApJ, 412, 267
- Read & Stevens (2002) Read, A. M., & Stevens, I. R. 2002, MNRAS, 335, 36
- Reynolds et al. (1995) Reynolds, C. S., Fabian, A. C., Nandra, K., Inoue, H., Kunieda, H., & Iwasawa, K. 1995, ApJ, 277, 901
- Reynolds et al. (1997) Reynolds, C. S., Ward, M. J., Fabian, A. C., & Celotti, A. 1997, MNRAS, 291, 403
- Reynolds & Wilms (2000) Reynolds, C. S., & Wilms, J. ApJ, 533, 821
- Ross & Fabian (1993) Ross, R. R., & Fabian, A. C. 1993, MNRAS, 261, 74
- Ruszkowski et al. (2000) Ruszkowski, M., Fabian, A. C., Ross, R. R., & Iwasawa, K. 2000, MNRAS, 317, L11
- Sako et al. (2001) Sako, M., et al. 2001, A&A, 365, L168
- Sako (2003) Sako, M. 2003, ApJ, submitted
- Smith et al. (1987) Smith, B. J., Kleinmann, S. G., Huchra, J. P., & Low, F. J. 1987, ApJ, 318, 161
- Snow & Witt (1996) Snow, T. P., & Witt, A. N. 1996, ApJ, 457, 211
- Stolte et al. (1997) Stolte, W. C., Samson, J. A. R., Hemmers, O., Hansen, D., Whitfield, S. B., & Lindle, D. W. 1997, At. Mol. Opt. Phys., 30, 4489
- Steenbrugge et al. (2001) Steenbrugge, et al. 2001, A&A, submitted
- Strüder et al. (2001) Strüder, L., et al. 2001, A&A, 365, L18
- Tanaka et al. (1995) Tanaka, Y., et al. 1995, Nature, 375, 659
- Turner et al. (2001) Turner, M. J. L., et al. 2001, A&A, 365, L27
- Turner et al. (2000) Turner, T. J., et al. 2001, ApJ, 548, L13
- Vaughan & Edelson (2001) Vaughan, S., & Edelson, R. 2001, ApJ, 548, 694
- Verner et al. (1996) Verner, D. A., Ferland, G. J., Korista, K. T., & Yakovlev, D. G. 1996, ApJ, 465, 487
- Verner, Verner, & Ferland (1996) Verner, D. A., Verner, E. M., & Ferland, G. J. 1996, Atomic Data Nucl. Data Tables, 64, 1
- Walter & Fink (1993) Walter, R., & Fink, H. H. 1993, A&A, 274, 105
- Wills et al. (1992) Wills, B. J., Wills, D., Evans, N. J., Natta, A., Thompson, K. L., Breger, M., & Sitko, M. L. 1992, ApJ, 400, 96
- Wilms et al. (2001) Wilms, J., Reynolds, C. S., Begelman, M. C., Reeves, J., Molendi, S., Staubert, R., & Kendziorra, E. 2001, MNRAS, 328, 27
- Wu et al. (1997) Wu, Z. Y., Gota, S., Jollet, F., Pollak, M., Gautier-Soyer, M., & Natoli, C. R. 1997, Phys. Rev. B, 55,2570
- Zycki et al. (1994) Zycki, P. T., Krolik, J. H., Zdziarski, A. A., & Kallman, T. R. 1994, ApJ, 437, 597
| MCG6-30-15 | Mrk 766 | ||||||
|---|---|---|---|---|---|---|---|
| Instrument | Mode | Filter | Exposure (s)aawhere applicable | Mode | Filter aawhere applicable | Exposure (s)bbtotal good time | |
| RGS1 | Spectroscopy + Q | 127272 | Spectroscopy + Q | 56593 | |||
| RGS2 | Spectroscopy + Q | 127543 | Spectroscopy + Q | 56613 | |||
| MOS1 | Timing – uncompressed | MEDIUM | 82753 | Imaging – full window | MEDIUM | 28602 | |
| MOS2 | Imaging – full window | MEDIUM | 93904 | Imaging – full window | MEDIUM | 28280 | |
| PN | Imaging – small window | MEDIUM | 69662 | Imaging – small window | MEDIUM | 37127 | |
| OM | Imaging | UVW2 | 82328 | Imaging | UVW1 | 10000 | |
| 82328 | Imaging | UVM2 | 19500 | ||||
| Imaging | UVW2 | 9600 | |||||
| (cm-2) | ||
|---|---|---|
| Ion | Component 1 | Component 2 |
| C VI | 16.43aa90% upper limit. | 16.29aa90% upper limit. |
| N V | 15.52 | 16.58aa90% upper limit. |
| N VI | 15.01 | 16.87aa90% upper limit. |
| N VII | 16.57 | 16.11 |
| O V | 16.94 | 16.23aa90% upper limit. |
| O VI | 16.55 | 15.98 |
| O VII | 17.34 | 16.13 |
| O VIII | 17.27 | 16.75 |
| Ne IX | 16.54 | 16.08 |
| Ne X | 17.00 | 16.83 |
| Mg XI | 16.12 | 16.14 |
| Mg XII | 16.74aa90% upper limit. | 16.73 |
| Si XIII | 17.10aa90% upper limit. | 16.52 |
| Si XIV | 17.03aa90% upper limit. | 17.54aa90% upper limit. |
| Fe XVII | 16.42 | 15.72 |
| Fe XVIII | 16.97 | 16.37 |
| Fe XIX | 17.02 | 16.37 |
| Fe XX | 16.49 | 16.81 |
| Fe XXI | 16.73 | 16.95 |
| Fe XXII | 16.66 | 16.69 |
| Fe XXIII | 15.07 | 17.05 |
| Fe XXIV | 16.42aa90% upper limit. | 16.61 |
| Ion | (cm-2) |
|---|---|
| C VI | 16.84aa90% upper limit. |
| N V | 16.74aa90% upper limit. |
| N VI | 16.28 |
| N VII | 16.33 |
| O V | 16.78 |
| O VI | 16.81 |
| O VII | 16.69 |
| O VIII | 16.95 |
| Ne IX | 17.24aa90% upper limit. |
| Ne X | 17.60aa90% upper limit. |
| Mg XI | 17.12aa90% upper limit. |
| Mg XII | 16.50aa90% upper limit. |
| Si XIII | 17.11aa90% upper limit. |
| Si XIV | 17.53aa90% upper limit. |
| Fe XVII | 17.01aa90% upper limit. |
| Fe XVIII | 16.88aa90% upper limit. |
| Fe XIX | 16.58aa90% upper limit. |
| Fe XX | 16.26aa90% upper limit. |
| Fe XXI | 16.96aa90% upper limit. |
| Fe XXII | 16.39aa90% upper limit. |
| Fe XXIII | 17.16aa90% upper limit. |
| Fe XXIV | 17.33aa90% upper limit. |
| Value | ||
|---|---|---|
| Parameter | MCG6-30-15 | Mrk 766 |
| (degrees) | ||
| () | ||
| () | ||