Radio Galaxies at z = 1.1 to 3.8: Adaptive-Optics Imaging and Archival Hubble Space Telescope Data
Abstract
We have undertaken a program of high-resolution imaging of high-redshift radio galaxies (HzRGs) using adaptive optics on the Canada-France-Hawaii Telescope. We report on deep imaging in , , and bands of 6 HzRGs in the redshift range 1.1 to 3.8. At these redshifts, near-infrared bandpasses sample the rest-frame visible galaxian light. The radio galaxy is resolved in all the fields and is generally elongated along the axis of the radio lobes. These images are compared to archival Hubble Space Telescope Wide-Field Planetary Camera 2 optical observations of the same fields and show the HzRG morphology in rest-frame ultraviolet and visible light is generally very similar: a string of bright compact knots. Furthermore, this sample - although very small - suggests the colors of the knots are consistent with light from young stellar populations. If true, a plausible explanation is that these objects are being assembled by mergers at high redshift.
1 Introduction
The range of redshifts of the known radio galaxies (RGs) spans from for Cygnus A (catalog ) to well above . For example, 4C +41.17 (catalog ) at , 6C 0140+326 (catalog ) at , and TN J0924-2201 (catalog ) at . It is well established that the most powerful low redshift radio sources are associated with giant elliptical galaxies, often the brightest cluster galaxies. The optical morphology of powerful RGs with redshifts greater than is dramatically different from that of those of lower redshift. These high-redshift radio galaxies (HzRGs) are clumpy and very irregular and tend to be elongated along the axis of their radio lobes, a characteristic known as the ‘alignment effect’ (Chambers, Miley, & van Breugel, 1987; McCarthy et al., 1987). The best optical imaging of HzRGs has been obtained with the Hubble Space Telescope (HST) Wide-Field Planetary Camera 2 (WFPC2). These data include objects mostly from the 3C and 4C catalogs and have revealed very complex rest-frame UV morphologies down to the resolution limit of ″ (Longair, Best, & Röttgering, 1995; Best, Longair, & Röttgering, 1996, 1997; Chambers et al., 1996; McCarthy et al., 1997; Pentericci et al., 1999). These images reveal the immediate neighbourhood of the AGN host to be strings of knots with separations on the order of a few kpc aligned along the radio axis. These are embedded in a diffuse emission region with projected scales of kpc. Typically, several faint field objects within kpc projected radius from the host are also found.
A still unanswered question about the stellar population of HzRGs is whether it is young or old. Since the highest redshifts for RGs are in the 3 - 5 range, one might assume that they are very young systems since, for a universe with , the look-back time is about 90% of the age of the universe. A popular theory presented by Lilly & Longair (1984) (Lilly, 1988, 1989) is that most of the star formation in these systems took place in an initial burst at and that minor star-formation episodes afterwords produce the dramatic morphologies in rest-frame UV light. This ‘old galaxy burst’ model is reasonably successful in matching the relation for RGs but it is not the only way to account for the rest-frame UV light. The high incidence of double and multiple component galaxies with separations of a few kpc suggests that these may be in the process of merging in the direction defined by the radio axis (Djorgovski et al., 1987; West, 1991, 1994). Star formation could be induced by the shocking of the intergalactic medium by jets along the radio axis (Chambers, Miley, & van Breugel, 1987; McCarthy et al., 1987; De Young, 1989; Rees, 1989; Begelman & Cioffi, 1989; Chambers & Charlot, 1990; Daly, 1990). The high linear polarization of some galaxies suggests that scattering of light from the active galactic nucleus (AGN) by electrons or dust may be the dominant source of emission (di Serego Alighieri et al., 1989; Tadhunter et al., 1992; di Serego Alighieri, Cimatti, & Fosbury, 1993; Januzzi et al., 1995; Cimatti et al., 1996, 1997). Also, nebular thermal continuum associated with ionized gas is an important contributor for some objects (Dickson et al., 1995; Stockton, Ridgway, & Kellogg, 1996).
The rest-frame UV morphologies of HzRGs may be dramatic but in order to study galaxy evolution in HzRGs one should follow the mature stellar populations. If these populations are mapping out the structure of the ‘true’ galaxy one might well ask how this structure changes in time. Do these galaxies appear as elliptical galaxies from early epochs to the present or, if not, how do they evolve? Deep, high-resolution NIR imaging allows the study of HzRGs to be extended to the most distant ones known. It permits the investigation of the rest-frame-visible properties of RGs over a large range in redshift and enables the discrimination between opposing viewpoints on HzRG formation and evolution - mature, red, passively evolving ellipticals or young, bursting irregulars - by permitting studies of the morphology of the stellar populations of HzRG environments. Work on imaging HzRGs in the NIR using the HST have been hampered by the failure of the Near-Infrared Camera and Multi-Object Spectrometer (NICMOS) in January 1999. From a sample of 19 RGs with NICMOS -band images Pentericci et al. (2001) suggest that the lower redshift galaxies are well fit by de Vaucouleurs profiles. Zirm et al. (1999) have obtained images of a further 11 RGs and also suggest the NIR morphologies are consistent with dynamically relaxed elliptical host galaxies.
The work discussed here involves a program of deep imaging of HzRGs with the Canada-France-Hawaii Telescope (CFHT) Probing the Universe with Enhanced Optics (PUEO) AO system that was designed to provide similar depth and resolution in the NIR as that provided by HST in the optical (Steinbring, Crampton, & Hutchings, 1998). The aim of the study was to discover if the compact knots found in rest-frame UV had corresponding rest-frame-visible counterparts or if the stellar HzRG morphology was more like that of an evolved elliptical galaxy. We present CFHT PUEO observations of 6 HzRGs with . Deep HST WFPC2 images of the same fields had already been obtained by others and were publically available from the Archive, but in two cases these data were unpublished. In Section 2 we discuss sample selection and in Section 3 the combined HST and CFHT dataset and its reduction is outlined. Descriptions of the individual fields and comparison of the WFPC2 and PUEO images will follow in Section 4. Analysis of the morphology and colors of the RGs in the sample is presented in Sections 5; conclusions follow in Section 6.
2 Sample Selection
Ideally, a study of the stellar environments of HzRGs should have a sample that covers a wide range in redshift and radio brightness. The major discovery surveys of RGs contain several hundred sources each. Thus, there are thousands of RGs from which to choose a sample that should satisfy these criteria.
The difficulty is, however, that very few of these galaxies will satisfy the selection criteria for observation with a natural guide-star AO instrument such as the CFHT PUEO. The major problem is that a suitable guide-star must not only be bright but in close proximity on the sky to the RG. Thus, in effect, the selection criterion for the RG sample is purely based on the proximity of a guide star. This may yield a very small sample but at least it is assured to be chosen without bias for a particular physical trait. Radio galaxy surveys select objects based on radio flux which is not at all dependent on the projected proximity of stars. One might suggest that their identification with an optical counterpart does prohibit ones with bright stars very close to, or, worse, superimposed on, the galaxy. But this will not, of course, correlate with radio brightness or redshift or any other intrinsic parameter of the RG sample either.
Possible RG targets were chosen in the following fashion. First, all objects catalogued by the NASA Extragalactic Database as an RG with and visible from the CFHT during our observing runs were found. That is, these were galaxies that were identified with an optical component. This yielded a target list including hundreds of candidates. Next, the United States Naval Observatory Guide-Star Catalogue was used to determine all of those targets within 45″ of an star. This reduced the target list to only 25 members. Finally, of the targets remaining, only those with archival HST WFPC2 images were included. The last step was applied to ensure that high-resolution optical observations would be available for all the targets. This reduced the sample to 12 members; all but one of which were from either of the 3C and 4C Catalogues of radio sources.
3 Data and Reductions
We obtained CFHT PUEO data during observing runs in June 1997 and January 1998. A journal of the observations is given in Table 1. See Rigaut et al. (1998) for a discussion of the PUEO instrument and its performance. In all observations a guide-star was used to guide PUEO. During the 1997 run only the pixel Montreal NIR Camera (MONICA) was available. Its poor sensitivity hampered our efforts to obtain deep exposures of the RG fields. The small field of view (FOV) (9″ 9″ with 0.0347″ pixels) meant that neither the guide-star nor any star suitable for determining the point-spread function (PSF) was included in the target field. The pixel NIR imager KIR was used in our 1998 run and its greater sensitivity ( that of MONICA) provided much deeper exposures. The larger format (0.0350″ pixels giving a field of 36″ 36″) also included either the guide-star or some other stars suitable for PSF analysis. We also used these stars to register the PUEO and WFPC2 images.
For the observations reported here the natural seeing was between 0.5″ and 0.9″ with good transparency. We made observations primarily through standard and filters. A few observations through standard were also made. A filter would have been preferred because of the lower resultant sky-noise but none was available for our runs. We were unable to obtain any data during the 1997 run due to problems with the filter-wheel. Exposures of 300 s each were made in a non-repeating rectangular dither pattern with 1″ steps for MONICA and 4″ steps for KIR. An -band image of a single object, 3C 356 (catalog ), was obtained in June 1997 with MONICA. Images of 5 more fields were acquired in January 1998 with KIR.
3.1 Archival Hubble Space Telescope Data
The archival WFPC2 data were obtained through the Canadian Astronomy Data Centre which is operated by the National Research Council of Canada Herzberg Institute of Astrophysics. The images were combined using standard Space Telescope Science-Database Analysis System tasks and rotated to the proper orientation based on information contained in the image headers. A list of the observations is given in Table 2. In all cases the MONICA or KIR data were resampled to match the pixel sampling of the WFPC2 data. No smoothing was done prior to resampling.
3.2 Calibration
Photometric standard stars from the United Kingdom Infrared Telescope catalog were observed. Star FS 30 was used as a calibrator in June 1997 and the star FS 21 was used in January 1998. For the archival HST data the photometric zero-points and first-order transformations to the standard Johnson filter set were found in the WFPC2 Instrument Handbook (Biretta, 1996).
In the remainder of the analysis the HST WFPC2 F675W and F702W filters are assumed to be approximately equivalent to and the F785LP and F814W filters also roughly equivalent to . Only a first order transformation from the local to standard Johnson filter set has been made for these and the CFHT data.
For both the WFPC2 and KIR images the PSF FHWM at the galaxy position was determined by measuring a bright but unsaturated star in the field. For WFPC2 images this was the star nearest the RG and for KIR it was a star at a similar offset from the guide-star. In the case of 3C 294 (catalog ) no such PSF star was available and no guide-star calibration observations were made but the galaxy is within 9″ of a magnitude star. We therefore followed these observations with imaging of a crowded stellar field in the globular cluster NGC 4147 (catalog ), also using a guide-star. An isolated star roughly 9″ from the guide-star in NGC 4147 was used as the PSF for the scientific observation.
For MONICA no PSF stars were available due to its small FOV. However, for the MONICA observations of 3C 356 (catalog ) exposures of the guide-star were available. These were taken immediately before each set of galaxy exposures and were combined to determine an average on-axis PSF. The PSF reconstruction technique of Véran, Rigaut, & Maître (1996) was also employed to determine an on-axis PSF and this agreed with the observed one. The PSF at the target position was then determined using calibration observations of a crowded stellar field and the technique discussed in Steinbring (2001). Observations of the globular cluster M 5 (catalog ) were made. A mosaic pattern was used to obtain a roughly 12″ wide by 30″ long strip with the guide-star at one end. The mosaic was composed of 6 individual pointings of the telescope. At each position a dithering pattern was used to build up an image. Since the guide-star appeared in only one of the component images and time lapse of several minutes occured between each pointing a danger with this method was that the PSF would change during the construction of the mosaic. This did not appear to be a problem because stars in overlapping regions in the mosaic were almost identical. In each overlapping region the FWHM of a particular star in both frames was not different by more than 5%. The M 5 (catalog ) calibration field was then deconvolved with its guide-star. The Lucy-Richardson algorithm was employed and this process was permitted to continue until all the flux in the guide-star image was concentrated into roughly one pixel. This produced an image of deconvolved stars. These stars are also the ‘kernels’ necessary to degrade an image of the on-axis PSF to one at an off-axis position. Next, the deconvolved image was convolved with the on-axis PSF for the scientific observation of 3C 356 (catalog ). This produced an off-axis PSF correct for both the seeing conditions and anisoplanatic effects during the 3C 356 (catalog ) observations.
The FWHM of the PSFs were determined by fitting them with a Gaussian using the IRAF task IMEXAM. The results are presented in Table 3. All the galaxies were resolved, typically at resolutions of 0.20″ to 0.25″ FWHM. The per-pixel for bright knots within the RGs is approximately 10 for both the CFHT and HST data. For the fainter knots and field objects this drops to .
3.3 Photometry
The CFHT images were searched by eye to find stars, knots, and faint objects in the field. Also, the software package SExtractor (Bertin & Arnouts, 1996) was used to find objects in the field but it was determined that this generally selected the same objects as those found by eye. Each RG field was corrected for galactic extinction with values from the extinction map of Schlegel, Finkbeiner, & Davis (1998). Coordinate lists of objects in the fields were generated and synthetic aperture photometry was performed for all of these objects in the CFHT and HST images.
The IRAF task APPHOT was used employing a 3.0″ aperture on all objects in the field. This aperture was large enough to encircle all the flux for each of the targets. For the RGs themselves rectangular apertures were determined that separated the individual knots without overlap. This was always done in the band corresponding most closely to the rest-frame visible for each galaxy and the same apertures were maintained for the other bands. We defined a knot as a bright region of connected pixels that was separated from any other region by a trough of pixels with flux lower than half of the maximum brightness. This task was accomplished by analyzing the image of the RG with a display interface that permitted the flux in any pixel to be displayed when the cursor was pointed at it. By scanning the cursor over pixels radiating from a local maximum in the image it was straightforward to determine which peaks were connected and which were isolated. The results are shown in Table 4. The subcomponents of the RG are labeled with a lower-case letter and we assume km and when quoting their magnitudes. Other field objects are indictated by a number. The quoted 1- photometric errors are due to Poisson statistics from sky-flux. In some cases the formal errors were somewhat less than 0.1 magnitude but uncertainties in flat-fielding, extinction, and photometric zero-points suggest a lower limit on the photometric uncertainty of 0.1 magnitude.
Another consideration is emission-line contamination of the broadband fluxes. These emission lines are the products of ionization by the hidden AGN and it is important to know if they will seriously interfere with what should be measurements of stellar continuum light. The following are strong lines redshifted into the observed bandpasses: Si IV 1403, C IV 1549, C III] 1909, [Ne V] 3426, [O II] 3727, [Ne III] 3869, H, [O III] 5007, [N II] 6548, 6583, and H. If a spectrum was available the contamination was estimated by comparing the FWHM of the filter bandpass and the equivalent width of the emission lines. No NIR spectra were available for two of the targets so the equivalent widths here were estimated from a composite RG spectrum constructed from observations of galaxies with (McCarthy, 1993). The results are shown in Table 5. The estimated contamination is always less than 20% and suggests that emission lines will not have a significant effect on the photometric results. It should be noted that even with the advantage of an observed spectrum this method only gives an estimate for the galaxy as a whole since emission-line strengths will not be uniform among its components. However, in our photometry the light of each RG was divided among a just few sub-apertures and there is no evidence for strong discord over these spatial scales since the colors generally agree within photometric uncertainty.
4 Descriptions of Each Field
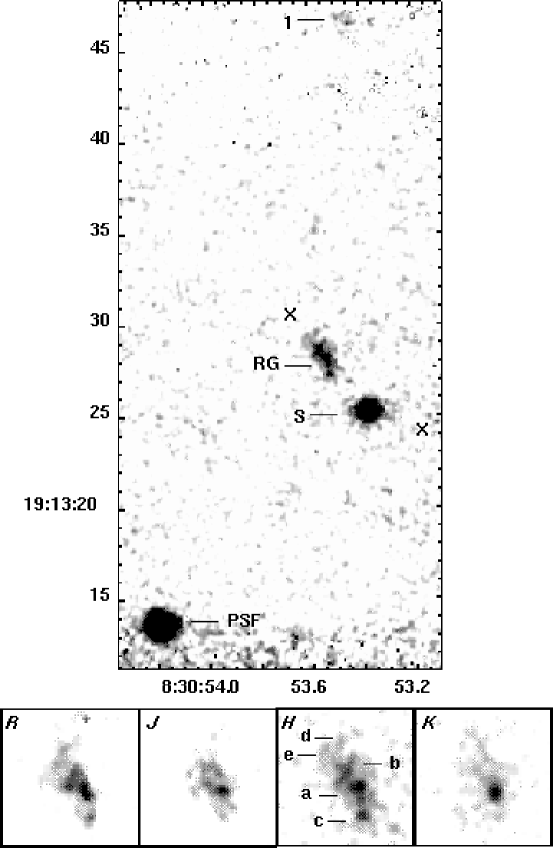
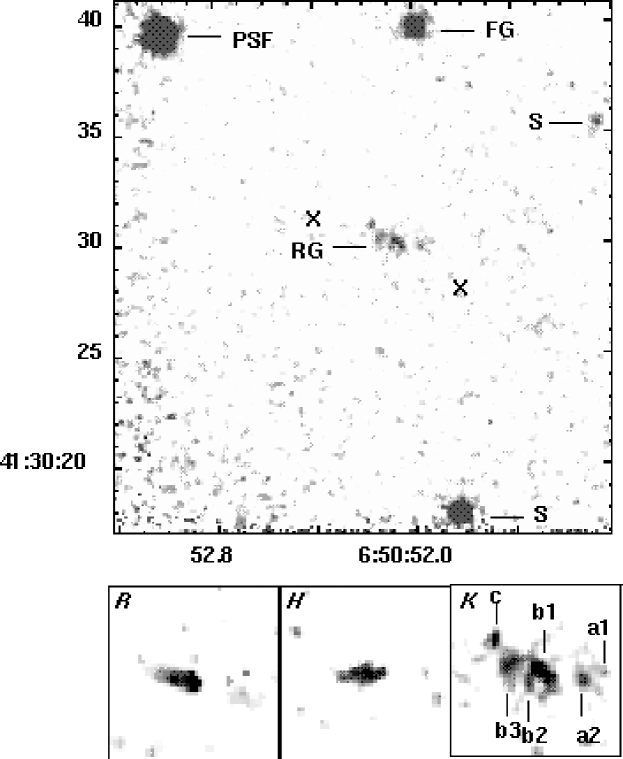
The CFHT and HST images follow. First, either our or -band AO image is shown. Each image has north up and east left with right ascension and declination given in J2000 coordinates. Stars are indicated by an ‘S’, the guide-star by ‘GS’, and the calibration star by ‘PSF’. Some well-resolved galaxies much brighter than the RG were detected and these are indicated by ‘FG’ for foreground galaxy. The peaks of emission of the radio lobes are denoted by ‘X’s. Enlarged fields showing the RG itself are given for each of the available bands including the HST data. Each field is 4″ 4″ with north up and east left.
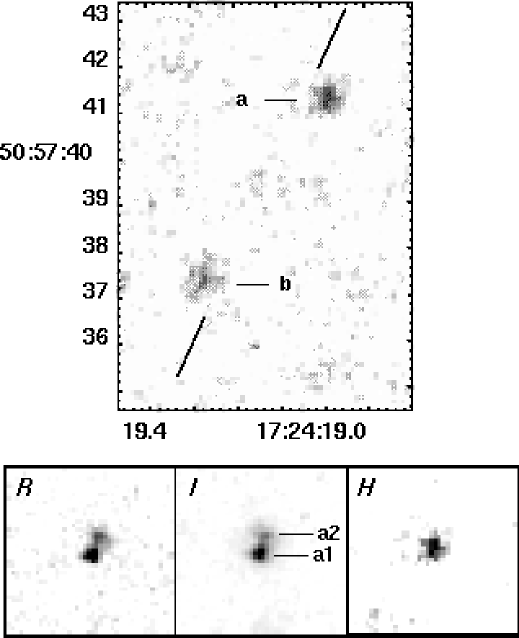
4.1 3C 356
This is a radio bright (11.3 Jy at 178 MHz) RG. This RG has a very extended double radio lobe morphology. The projected separation of the lobes is just over an arcminute or about 250 kpc in physical size. A high-resolution (0.18″ FWHM) VLA radio map at 8.4 GHz was obtained by Best et al. (1997) and indicates two unresolved radio sources located roughly midway along the radio axis.
Previous non-AO ground-based NIR observations had been obtained by Eisenhardt & Chokshi (1990), Rigler et al. (1992), and Best et al. (1997). These images indicated that the central radio sources correspond to the two brightest rest-frame-optical components. Both components were, however, unresolved. These two objects, ‘a’ and ‘b’, are resolved in our -band imaging and have about the same brightness. The top panel of Figure 1 shows component ‘a’ to be elongated along roughly a north-south axis while object ‘b’ is more diffuse.
The WFPC2 and images of component ‘a’ are shown along with our image in the bottom three panels of Figure 1. The HST data are discussed in detail by McCarthy et al. (1997) and Best et al. (1997), and show component ‘a’ to be ‘dumbbell’ shaped. McCarthy et al. and Best et al. suggest that since the optical morphology of ‘a’ is more typically that of RGs of the 3C Catalogue it is the AGN host. This identification is confirmed by our NIR image. The marked difference in morphology between ‘a’ and ‘b’ is also exhibited in our -band image. Furthermore, the axis of elongation of component ‘a’ matches that seen in the HST images.
Keck Telescope optical spectropolarimetry by Cimatti et al. (1997) reveals that both components are polarized in rest-frame UV (observed 4000-9000 Å) with %. This continuum polarization rises towards the blue, reaching % for the northern component. Observations with the UK Infra-Red Telescope by Leyshon & Eales (1998) show that both components are also probably polarized in rest-frame visible light (observed -band) at the 10% level as well. These observations suggest an obscured AGN as a likely source of scattered non-stellar light. This further suggests that there might be pollution of our photometry with AGN light. Some contamination had also been suggested by the analysis of emission lines in Section 3.3.
4.2 3C 230
This is a radio-bright (19.2 Jy at 178 MHz) RG. Rhee et al. (1996) obtained VLA radio observations of 3C 230 (catalog ) at 4.8 GHz and 8.4 GHz. These moderate resolution (0.4″ FWHM) maps indicate that it has a double lobed morphology but no core object is detected.
Previous attempts to obtain ground-based NIR imaging of this field were hampered due to the proximity of the bright () star 4″ to the west (Hammer & Le Fèvre, 1990). This star provided an excellent guide for AO observations. Our -band image is shown in the top panel of Figure 2. The RG itself is extended and composed of 3 knots. They are aligned roughly parallel with the axis of the radio lobes; offset by about 1″ to the northeast. No knots are detected at the positions of the radio lobes. The bright object at the western edge of the field is probably a foreground galaxy.
The WFPC2 data were obtained by others as part of a snapshot survey of 3C radio galaxies (Sparks et al., 1995). These data are now public but were previously unpublished. The -band image of the RG is shown along with our NIR data in the bottom three panels of Figure 2. The -band image also shows the RG to be elongated along the axis of the radio lobes. Interestingly, the fainter central region of the RG in (southeast of knot ‘a’) is also the location of the brightest component in . This is especially apparent in the image and is perhaps due to obscuration by dust in the galaxy.
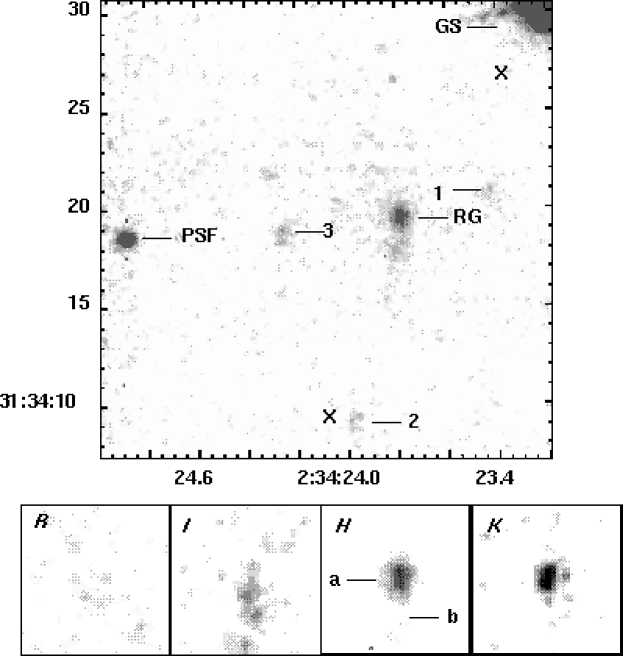
4.3 3C 68.2
This is a radio bright (10.0 Jy at 178 MHz) RG at . A high-resolution (0.18″ FWHM) VLA radio map at 8.4 GHz was obtained by Best et al. (1997). The radio emission has the classic extended double lobed morphology with an axis running roughly southeast to northwest. No core is detected to a 3- flux limit of 0.13 mJy.
Previous NIR observations had been obtained by Best et al. (1997). The -band image was acquired with ″ seeing and showed only that the RG was extended and roughly aligned with the radio axis. Our -band image appears at the top of Figure 3 and shows that the galaxy is extended and misaligned with the radio axis by 20 degrees. The RG itself is composed of 2 components separated by 1.5″ - denoted by ‘a’ and ‘b’ - in the image. Object ‘b’ is more diffuse than ‘a’ and although it is faint, there is some indication that it trails 2 or 3 arcseconds towards the southern radio lobe. Other objects are detected in the field. Field object ‘1’ is diffuse and lies roughly along the axis of the radio emission. Field object ‘2’ is within 2″ of the southern radio hotspot. It was not detected in the Best et al. image but in our image it appears to be more compact than ‘1’. We also detect a third field object, labelled ‘3’, that lies roughly 6″ east of the RG. The images of both ‘2’ and ‘3’ are extended and, furthermore, they share a common axis of elongation parallel to that of the RG.
The WFPC2 data are discussed in detail by Best et al. (1997). The -band image of the RG itself is displayed along with our and data in the bottom three panels of Figure 3. These show the RG to be more complex in the HST image. Three knots correspond to the extended component ‘a’ seen in the -band image, and there is also a knot corresponding to component ‘b’. The faint tail seen in the image extends southward 2″ from this knot. Best et al. suggest that component ‘2’ (labelled ‘f’ by them) may be at the same redshift as the RG and that its blue color is due to scattered light from an obscured AGN or to star-formation induced by shocks associated with the nearby radio lobe. Our NIR data reveals that components ‘2’ and ‘3’ have similar colors, each is aligned with the RG, and thus both may be related to it.
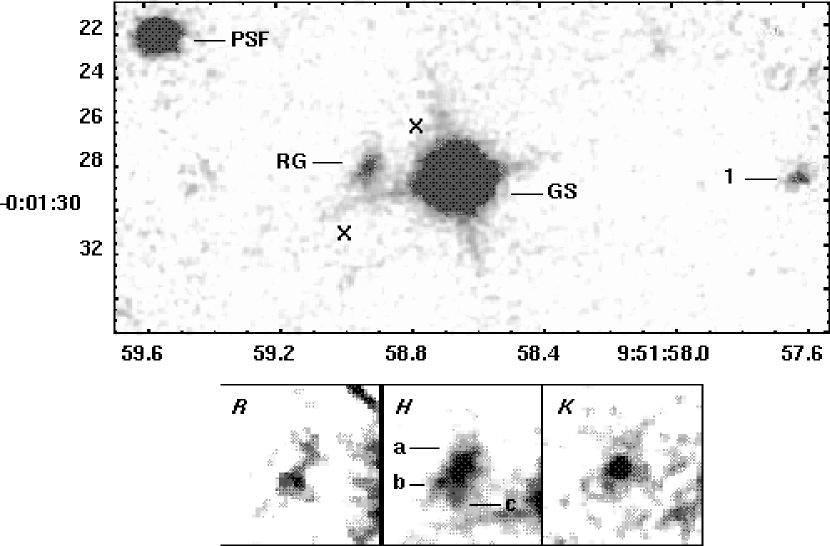
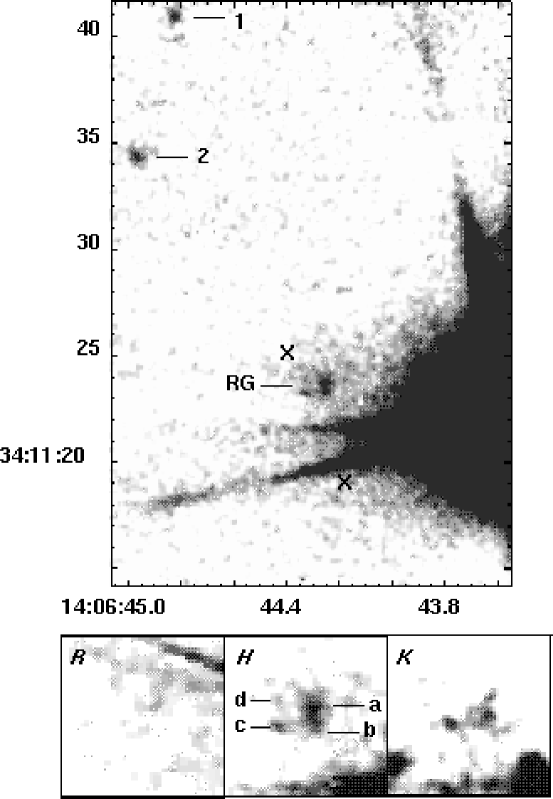
4.4 3C 294
This is a radio bright (10.0 Jy at 178 MHz) RG. A moderate resolution (0.4″ FWHM) VLA map at 5.0 GHz has been obtained by McCarthy et al. (1990) and indicates that 3C 294 (catalog ) has a double lobed morphology along an axis from northeast to southwest. An unresolved core is also detected.
Attempts to obtain non-AO ground-based NIR images of the RG have been hampered by the bright () star 9″ to the west (McCarthy et al., 1990). This proximity was an asset for AO imaging. Our image is shown in the top panel of Figure 4. The RG is in the centre of the field. The two other bright objects in the northeast seem to be positioned along the axis of the radio emission although they are far outside the northeastern radio lobe. The colors of these objects are also similar to those of the RG. The and images of the RG itself (bottom panels of Figure 4) are not aligned with the radio axis. The main component is elongated along a north-south axis with a companion about 2″ to the east of the southern tip. The brightest knot in lies 0.2″ west of the main structure in , which may indicate some reddening for the RG. The unresolved core (flux density 0.56 mJy) from the McCarthy et al. (1990) 5.0 GHz radio map does not correspond directly with any of the knots in our images. It is at a position 0.7″ due south of the peak of knot ‘b’. The uncertainty in this position is about 0.2″. This is because in this case the guide-star is double with a separation of 0.13″ and the positional error quoted by McCarthy et al. for their radio map is 0.05″.
The bright potential guide-star near this galaxy has lead others to obtain AO observations of 3C 294 (catalog ). Similar resolution images were obtained by Stockton, Canalizo, & Ridgway (1999) using the University of Hawaii AO system on the CFHT. Their image is of comparable depth and shows the RG to be very similar to our image. They also place the McCarthy et al. (1990) radio core at or near the southern edge of the RG. Based on this location, they suggest that the most plausible scenario is that of small dusty clumps being illuminated by an obscured AGN. A higher resolution (″ FWHM) -band image of similar depth to ours has been obtained with the Keck II AO system by Quirrenbach et al. (2001) which further resolves components ‘a’ and ‘b’ into several compact knots. Their derived position for the radio core corresponds to component ‘c’, which remains unresolved in their image. This leads them to conclude that a more plausible explanation for the NIR morphology is that of an ongoing merger event, with the AGN located in the less massive of two galaxies.
The WFPC2 image had previously been viewed as a nondetection (McCarthy et al., 1997). It is included in the bottom three panels of Figure 4. With the position of the galaxy now known in the NIR it is possible that the visible counterpart in the WFPC2 image is discernible. We suggest that this is the faint nebulosity partially obscured by the diffraction spike of the star. Several tests were carried out to ensure that it is not an artifact. The WFPC2 data consist of 8 equal integrations taken in either of two independent camera orientations. Different sub-sets of the data were co-added using a variety of cosmic-ray and bad-pixel-rejection methods. The object is faint but persists independently of the different processing. This indicates that the RG is certainly red, with , and thus parts of it may be obscured by dust.
4.5 TXS 0828+193
This is a radio bright (0.549 Jy at 365 MHz) RG at . Moderate resolution (1.5″ FWHM) VLA radio maps at 1.5 GHz by Röttgering et al. (1994) indicate that it has a double lobed morphology. A high-resolution (0.25″ FWHM) map at 8.2 GHz by Carilli et al. (1997) reveals a central core.
Non-AO NIR images were obtained by Knopp & Chambers (1997) but were obtained with 1″ seeing and thus the RG is only marginally resolved. The RG is spectacular in our image (top panel of Figure 5). It is composed of approximately 5 knots which are aligned with the radio axis. The bottom panels of Figure 5 show it to be less complicated in the image, with a dominant knot that does not correspond exactly with the brightest emission in the and images. Since corresponds roughly to rest-frame for this redshift the bluer light may be surpressed which might indicate internal reddening for this galaxy. There is a faint object 18″ to the north which is misaligned with the radio axis but has colors very similar to the RG. The bright object 3″ southwest of the RG is clearly pointlike in our images and NIR spectroscopy by Evans (1998) reveals no emission-line or absorption features. This may therefore be an unrelated object along the line of sight.
The HST image is discussed in detail by Pentericci et al. (1999) and is displayed along with our , , and images in the bottom four panels of Figure 5. Pentericci et al. identify the radio core with the brightest optical component. They suggest that the triangular morphology of the RG indicates an ionization cone with a large fraction of the rest-frame UV light originating from scattered light from an obscured AGN. Our NIR images show a striking correspondence between the rest-frame UV and visible morphologies. The brightest knot in is also dominant at NIR wavelenghts. Components ‘b’ and ‘c’ in correspond exactly in and . The fainter structure at the northern end of the image corresponds to knots ‘e’ and ‘d’ in our image. Whatever its origin, the emission in rest-frame UV is therefore likely to be from the source that dominates in visible light.
4.6 4C +41.17
At this is the highest-redshift object in the sample. Indeed it is one of the RGs with highest known redshift. It is a radio loud object with a 178 MHz flux of 2.7 Jy. Radio maps at several frequencies between 1.5 GHz and 15.0 GHz have been obtained with the VLA by Chambers, Miley, & van Breugel (1990), Carilli, Owen, & Harris (1994), and Chambers et al. (1996). The axis of the radio emission is roughly northeast to southwest and is double lobed. An elongated central source and a compact core are also detected in the higher resolution (0.2″ FWHM) maps.
A -band image was obtained by Chambers, Miley, & van Breugel (1990) under ″ seeing but showed only that the RG was elongated. Deeper NIR images were obtained by Graham et al. (1994) using the Keck Telescope. These latter images achieved a resolution of 0.65″ at and resolved the RG into two clumps which are aligned along the radio axis. Our image of the RG is very complex (top panel of Figure 6). It is composed of 6 distinct structures which are compact knots. The morphology of the RG in is less complicated. It appears as an elongated structure running east-west, somewhat misaligned with main axis of the band image, which runs from northeast to southwest. A compact unresolved radio core corresponds to a position 0.7″ west of the brightest emission in - knot ‘b1’. Chambers et al. (1996) quote an internal positional uncertainty of 0.5″ so it is possible that the radio core corresponds to this rest-frame optical knot.
Pre-refurbishment optical HST images were obtained by Miley et al. (1992) but the post-refurbishment WFPC2 data discussed here were obtained by van Breugel et al. (1998). The close correspondence of the optical and radio structures leads van Breugel et al. to suggest that star formation has been induced by passage of the northeastern radio jet. The -band image is displayed along with our and images in the bottom three panels of Figure 6. The morphology of the RG in is less complicated than in and composed of 3 knots which do not exactly register with the knots in the image. This is not surprising because, in the rest-frame, the 4000Å break separates and . The mechanism responsible for the striking morphology in is one with emission dominant at rest-frame-visible wavelengths. Since the elongation of the image is so closely aligned with the radio axis a plausible source is jet-induced star formation.
Using deep Keck Telescope spectropolarimetry observations, Dey et al. (1997) find that the rest-frame UV continuum radiation is unpolarized (a 2- limit of %). This suggests that scattered light from an obscured AGN is not to be likely the source of this emission. Furthermore, the absorption line UV spectrum is similar to that of star-forming regions in nearby galaxies. This, along with the low polarization, suggests that the UV emission is due to star formation.
5 Analysis
The goal of comparing our NIR data to the existing WFPC2 images was to determine if the complicated morphology exhibited by our sample of RGs in the rest-frame UV persisted at visible wavelengths and if the colors of those sub-components are consistent with mature stellar populations. A simple analysis by eye of the images in Figures 1, 2, 3, 4, 5, and 6 reveals that the RGs are complex objects at rest-frame visible wavelengths; moreso for those with redshifts of . That is, they appear to be composed of knots of roughly equal brightness in the rest-frame visible bandpass. All of the galaxies would be classified as irregulars in both rest-frame UV and visible light in the standard Hubble sequence. The absolute brightness of the RGs, however, is roughly constant with redshift and consistent with values for giant elliptical galaxies at low redshift (McCarthy, 1993).
5.1 Stellar Populations
The spectral synthesis models of Bruzual & Charlot (1993) were used to estimate the ages of potential stellar populations in the RGs. These yield the Galaxy Isochrone Synthesis Spectral Evolution Library (GISSEL) isochrones. By experiment with the parameters of their code it was determined that very simple models of star formation and galaxy evolution were sufficient to match the observed colors of the objects in the fields within the errors.
The GISSEL approach is to start with an initial mass function (IMF), star-formation rate, and a set of stellar evolutionary tracks to predict the evolution of a population of stars. At each time-step for a given mass of star the position along its stellar evolutionary track is determined. A library of stellar spectra is available which represents increments along the stellar evolution tracks. The composite spectrum of the evolving population of stars is calculated by adding the spectra of the individual stars from that library and weighting these according to the IMF. By convolving the resulting spectral energy distribution (SED) with functions for reddening and observational passbands observed galaxy colors can be predicted.
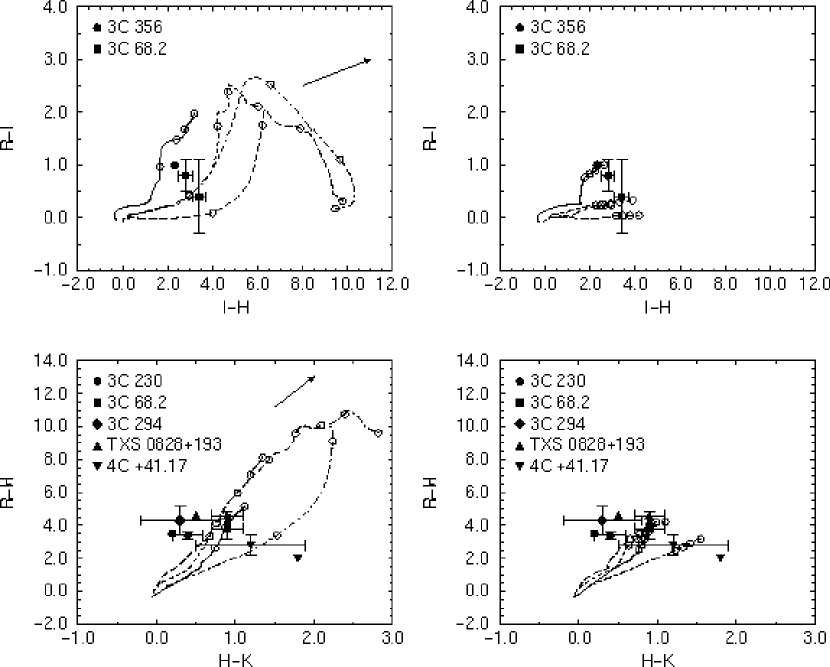
In Figure 7 the versus and versus colors of the RG components are overplotted with isochrone predictions corresponding to three main models. The first model is a single burst of star formation lasting 1 Gyr followed by passive stellar evolution. The second is the same as the first, except that strong reddening, , is introduced. This is due to the evidence for obscuration in colors, specifically in 3C 230 (catalog ), 3C 294 (catalog ), and TXS 0828+193 (catalog ). The third model is one of continuous star formation at a rate of 100 . This high rate of star formation was purposefully chosen to ‘saturate’ the blue colors. That is, a higher rate of star formation cannot make the measured colors of the galaxy any bluer. These particular models were chosen because they bracket the extremes of expectations for evolution for these galaxies. In general the isochrones from the reddened passive evolution model are too red to match the observed colors. The predictions from the continuous star formation model are, likewise, too blue. In each plot a solid line indicates the isochrone for a galaxy at . That is, it is a track giving the expected observed color of a galaxy at given the chosen model evolution. The epoch is indicated by open circles at 1, 2, 5, and 20 Gyr after the onset of star formation. A short-dashed line indicates the isochrone for the same model galaxy if it were at , a long-dashed line for , and a dot-dashed line for . The GISSEL models suggest that the colors of all the RGs in the sample are blue and well fitted by a young or bursting stellar population. In the case of 3C 356 (catalog ) some reddening would be necessary to explain the versus colors of the RG. In all cases the errors in the color measurements make it difficult to make any strong distinction between ages of the individual components of the RG. All of the color information is consistent with stellar populations younger than 5 Gyr for all of the RGs.
5.2 Model Galaxy Profiles
The previous analysis suggests that the RGs are inconsistent with a population of relaxed evolved elliptical galaxies at these redshifts. It is interesting to consider if the removal of the knots from the images might reveal an underlying galaxy which is consistent with this picture. To investigate this possibility we developed a method to model the profiles of the galaxies and subtract the knots.
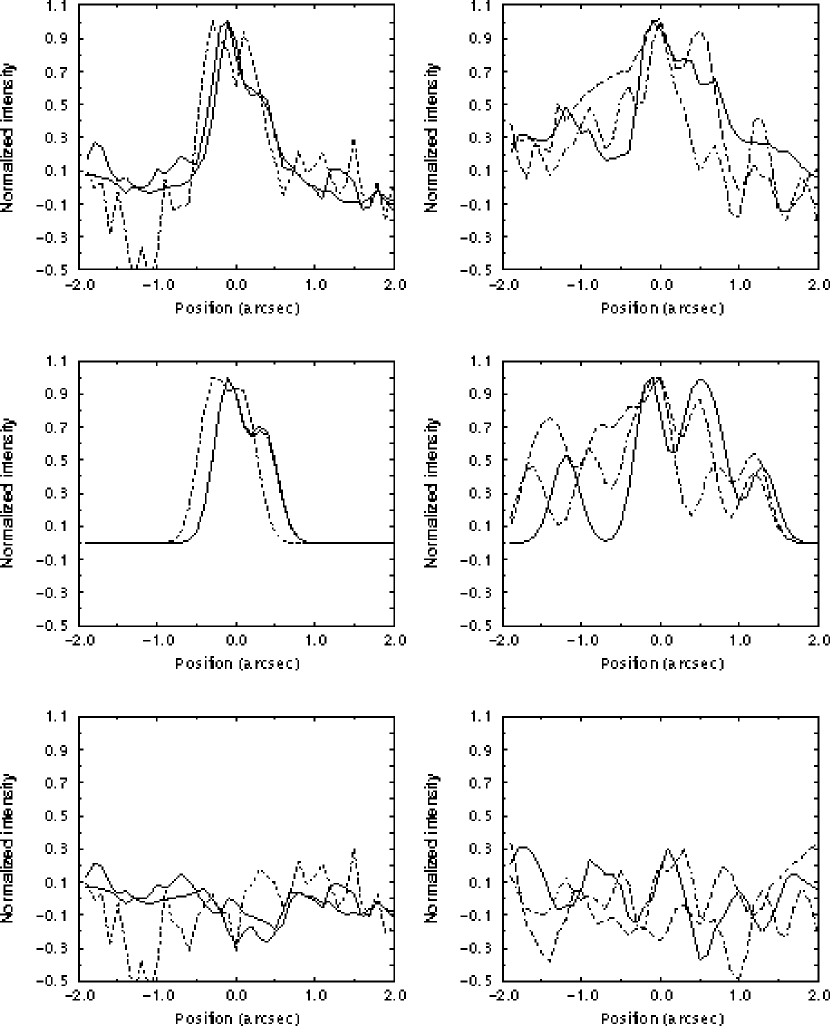
For each RG a 4″ 4″ image was extracted for each filter and rotated to a common alignment along the axis of the greatest elongation. For each image the pixel values were summed along a direction perpendicular to this axis. In effect, the images were compressed to slices along the axis of the RG. These profiles were normalized to have peak fluxes of unity.
We hypothesize that the galaxies are composed entirely of bright unresolved regions of young stars. Thus a model of each RG for each filter was generated as a composition of Gaussian profiles. The Gaussian had a FWHM given by the image resolution in Table 3. The model galaxy was built up by starting with a blank image the same size as the RG image and adding a Gaussian with peak flux and position determined from the photometry. This image was then summed in the same manner as for the real data and normalized to a peak flux of unity.
For each RG and each filter the model galaxy was subtracted from the data. The results for 3C 356 (catalog ) and 4C +41.17 (catalog ) will serve as examples, and they are shown in Figure 8. The data are shown in the top panels, the models in the centre panels, and the residuals in the bottom panels. These plots show that the model galaxies account for almost all of the light in the data. In some cases the residuals show a sharp peak (for example at ″ in for 4C +41.17) but this peak is always of the same FWHM as the imaging resolution for that bandpass. This can only suggest that an unresolved knot was missed by the method of Section 3.3. Accounting for these missed knots leaves residuals in each band for all the RGs that are random and have in normalized flux to the peak of the original image. This is consistent with the noise in the images.
The net result, then, is that a model of unresolved knots can account for all of the flux in the RG images. We point out that the detection limit for point sources in our AO imaging is approximately only 21 magnitudes in . These limits are even poorer for low-surface-brightness distributions, aggravated by the small angular sizes of the pixels in MONICA and KIR. So we cannot say that a low-surface-brightness component does not exist, but to the detection limit of the imaging none of the galaxies can be fitted with a de Vaucoleurs’ profile.
6 Conclusions
None of the RGs look like a typical low redshift RG. Both the alignment effect and the irregular morphology exhibited at rest-frame UV wavelengths persist into the visible for this sample. We see no evidence of underlying relaxed galaxies composed of mature stars, although the low of these observations does not exclude them. The colors of the compact knots seem to indicate stellar populations younger than 5 Gyr for all of the RGs, yet the overall brightness of the RGs is consistent with low redshift giant ellipticals. A plausible explanation is that these objects are being assembled by mergers at high redshift.
Certainly this study demonstrates the benefit of obtaining AO NIR imaging of these systems. This work suggests that a least some HzRGs are not passively evolved ellipticals at , but deeper imaging of a large sample is needed. The sample provided by natural guide-stars is insufficient and therefore the path will be provided by the next generation of AO systems, notably for Gemini and Keck, employing laser beacons.
References
- Begelman & Cioffi (1989) Begelman, M. C., & Cioffi, D. F. 1989, ApJ, 345, L21
- Bertin & Arnouts (1996) Bertin, E. & Arnouts, S. 1996, A&A, 117, 393
- Best, Longair, & Röttgering (1996) Best, P. N., Longair, M. S., & Röttgering, H. J. A. 1996, MNRAS, 280, L9
- Best, Longair, & Röttgering (1997) Best, P. N., Longair, M. S., & Röttgering, H. J. A. 1997, MNRAS, 292, 758
- Best, Röttgering, & Longair (2000) Best, P. N., Röttgering, H. J. A., & Longair, M. S. 2000, MNRAS, 311, 1
- Biretta (1996) Biretta, J. 1996, WFPC2 Instrument Handbook, STScI
- Bruzual & Charlot (1993) Bruzual A. G. & Charlot, S. 1993, ApJ, 405, 538
- Carilli, Owen, & Harris (1994) Carilli, C. L., Owen, F. N., & Harris, D. E. 1994, AJ, 107, 480
- Carilli et al. (1997) Carilli, C. L., Röttgering, H. J. A., van Ojik, R., Miley, G. K., & van Breugel, W. J. M. 1997, ApJS, 109, 1
- Chambers, Miley, & van Breugel (1987) Chambers, K. C., Miley, G. K. & van Breugel, W. J. M. 1987, Nature, 329, 604
- Chambers & Charlot (1990) Chambers, K. C. & Charlot, S. 1990, ApJ, 348, L1
- Chambers, Miley, & van Breugel (1990) Chambers, K. C., Miley, G. K., & van Breugel, W. J. M. 1990, ApJ, 363, 21
- Chambers et al. (1996) Chambers, K. C., Miley, G. K., van Breugel, W. J. M., Bremer, M. A. R., Huang, J., & Trentham, N. A. 1996, ApJS, 106, 247
- Cimatti et al. (1996) Cimatti, A., Dey, A., van Breugel, W. J. M., Antonucci, R., Spinrad, H. 1996, ApJ, 465, 145
- Cimatti et al. (1997) Cimatti, A., Dey, A., van Breugel, W. J. M., Hurt, T., & Antonucci, R. 1997, ApJ, 476, 677
- Daly (1990) Daly, R. A. 1990, ApJ, 355, 416
- di Serego Alighieri et al. (1989) di Serego Alighieri, S., Fosbury, R. A. E., Quinn, P. J., Tadhunter, C. N. 1989, Nature, 341, 307
- di Serego Alighieri, Cimatti, & Fosbury (1993) di Serego Alighieri, S., Cimatti, A., & Fosbury, R. A. E. 1993, ApJ, 404, 584
- Dey et al. (1997) Dey, A., van Breugel, W. J. M., Vacca, W. D., & Antonucci, R. 1997, ApJ, 490, 698
- De Young (1989) De Young, D. S. 1989, ApJ, 342, L59
- Dickson et al. (1995) Dickson, R., Tadhunter, C., Shaw, M., Clark, N., & Morganti, R. 1995, MNRAS, 273, L29
- Djorgovski et al. (1987) Djorgovski, S., Spinrad, H., Pedelty, J., Rudnick, L, Stockton, A. 1987, AJ, 93, 1307
- Eales & Rawlings (1993) Eales, S. A., & Rawlings, S. 1993, ApJ, 411, 67
- Eisenhardt & Chokshi (1990) Eisenhardt, P. & Chokshi, A. 1990, ApJ, 351, L9
- Evans (1998) Evans, A. S. 1998, ApJ, 498, 553
- Graham et al. (1994) Graham, J. R., Matthews, K., Soifer, B. T., Nelson, J. E., Harrison, W., Jernigan, J. G., Lin, S., Neugebauer, G., Smith, G., & Ziomkowski, C. 1994, ApJ, 420, L5
- Hammer & Le Fèvre (1990) Hammer, F. & Le Fèvre, O. 1990, ApJ, 357, 38
- Hutchings et al. (1998) Hutchings, J. B., Crampton, D., Morris, S. L., & Steinbring, E. 1998, PASP, 110, 374
- Januzzi et al. (1995) Januzzi, B. T., Elston, R., Schmidt, G. D., Smith, P. S., Stockman, H. S. 1995, ApJ, 454, 111
- Knopp & Chambers (1997) Knopp, G. P. & Chambers, K. C. 1997, ApJ, 487, 644
- Leyshon & Eales (1998) Leyshon, G. & Eales, S. A. 1998, MNRAS, 295, 10
- Lilly & Longair (1984) Lilly, S. J. & Longair, M. S. 1984, MNRAS, 211, 833
- Lilly (1988) Lilly, S. J. 1988, ApJ, 333, 161
- Lilly (1989) Lilly, S. J. 1989, ApJ, 340, 77
- Longair, Best, & Röttgering (1995) Longair, M. S., Best, P. N., & Röttgering, H. J. A. 1995, MNRAS, 275, L47
- McCarthy (1993) McCarthy, P. J. 1993, ARA&A, 31, 639
- McCarthy et al. (1990) McCarthy, P. J., Spinrad, H., van Breugel, W. J. M., Liebert, J., Dickinson, M., Djorgovski, S., & Eisenhardt, P. 1990, ApJ, 365, 487
- McCarthy et al. (1987) McCarthy, P. J., van Breugel, W. J. M., Spinrad, H., & Djorgovski, S. 1987, ApJ, 321, L29
- McCarthy et al. (1997) McCarthy, P. J., Miley, G. K., de Koff, S., Baum, S. A., Sparks, W. B., Golombek, D., Biretta, J., Macchetto, F. 1997, ApJS, 112, 415
- Miley et al. (1992) Miley, G. K., Chambers, K. C., van Breugel, W. J. M., & Macchetto, F. 1992, ApJ, 401, L69
- Pentericci et al. (1999) Pentericci, L., Röttgering, H. J. A., Miley, G. K., McCarthy, P., Spinrad, H., van Breugel, W. J. M. & Macchetto, F. 1999, A&A, 341, 329
- Pentericci et al. (2001) Pentericci, L., McCarthy, P. J., Röttgering, H. J. A., Miley, G. K., van Breugel, W. J. M., & Fosbury, R. 2001, ApJ, preprint (astro-ph/0102323)
- Quirrenbach et al. (2001) Quirrenbach, A., Roberts, J. E., Fidkowski, K., de Vries, W., & van Breugel, W. J. M. 2001, preprint (astro-ph/0103352)
- Rees (1989) Rees, M. J. 1989, MNRAS, 239, 1p
- Rhee et al. (1996) Rhee, G., Marvel, K., Wilson, T., Roland, J., Bremer, M., Jackson, N., & Webb, J. 1996, ApJS, 107, 175
- Rigler et al. (1992) Rigler, M. A., Lilly, S. J., Stockton, A., Hammer, F., & Le Fèvre, O. 1992, ApJ, 385, 61
- Rigaut et al. (1998) Rigaut, F., Salmon, D., Arsenault, R., Thomas, J., Lai, O., Rouan, D., Véran, J. P., Gigan, P., Crampton, D., Fletcher, J. M., Stilburn, J., Boyer, C., & Jagourel, P. 1998, PASP, 110, 152
- Röttgering et al. (1994) Röttgering, H. J. A., Lacy, M., Miley, G. K., Chambers, K. C., & Saunders, R. 1994, A&A, 108, 79
- Schlegel, Finkbeiner, & Davis (1998) Schlegel, D. J., Finkbeiner, D. P., & Davis, M. 1998, ApJ, 500, 525
- Sparks et al. (1995) Sparks, W. B., Miley, G. K., Maccheto, F., Baum, S. A., Biretta, J., Golombek, D., McCarthy, P. J. 1995, HST Cycle 4 Proposal 5476
- Steinbring (2001) Steinbring, E. 2001, PhD dissertation, Univ. of Victoria
- Steinbring, Crampton, & Hutchings (1998) Steinbring, E., Crampton, D., & Hutchings, J. B. 1998, BAAS, 30(4), 1280
- Stockton, Canalizo, & Ridgway (1999) Stockton, A., Canalizo, G., & Ridgway, S. E. 1999, ApJ, 519, L131
- Stockton, Ridgway, & Kellogg (1996) Stockton, A., Ridgway, S. E., & Kellogg, M. 1996, AJ, 112, 902
- Tadhunter et al. (1992) Tadhunter, C. N., Scarrot, S. M., Draper, P., Rolph, C. 1992, MNRAS, 256, 53
- van Breugel et al. (1998) van Breugel, W. J. M., Stanford, S. A., Dey, A., Miley, G. K., Stern, D., Spinrad, H., Graham, J., & McCarthy, P. J. 1998, in the Most Distant Radio Galaxies, eds. P. N. Best, H. J. A. Röttgering, & M. Lehnert (Dordrecht: Reidel), 83
- Véran, Rigaut, & Maître (1996) Véran, J. -P., Rigaut, F., & Maître, H. 1996, in ESO Conf. and Workshop Proc., Adaptive Optics, ed. M. Cullum, 497
- West (1991) West, M. J. 1991, ApJ, 379, 19
- West (1994) West, M. J. 1994, MNRAS, 268, 79
- Zirm et al. (1999) Zirm, A., Dey, A., Dickinson, M., McCarthy, P. J., Eisenhardt, P., Djorgovski, S. G., Spinrad, H., Stanford, S. A., & van Breugel, W. J. M. 1999, in ASP Conf. Vol. 193, The Hy-Redshift Universe: Galaxy Formation and Evolution at High Redshift, Eds. A. J. Bunker, W. J. M. van Breugel, 114
| Guide Star | Exposure time (s) | |||||||
|---|---|---|---|---|---|---|---|---|
| Target | Mag. () | Offset (″) | Date | Camera | ||||
| 3C 356 (catalog ) | 1.08 | 15.0 | 16 | 14, 15, 16 Jun 1997 | MONICA | 3600 | 14400 | |
| 3C 230 (catalog ) | 1.49 | 14.7 | 4 | 17 Jan 1998 | KIR | 1200 | 3600 | |
| 3C 68.2 (catalog ) | 1.58 | 14.2 | 14 | 17, 18 Jan 1998 | KIR | 2400 | 4800 | |
| 3C 294 (catalog ) | 1.78 | 11.7 | 9 | 18 Jan 1998 | KIR | 2400 | 4800 | |
| TXS 0828+193 (catalog ) | 2.57 | 12.7 | 38 | 17 Jan 1998 | KIR | 3600 | 1200 | 6000 |
| 4C +41.17 (catalog ) | 3.80 | 14.1 | 24 | 18 Jan 1998 | KIR | 1200 | 3600 | 10800 |
| Exposure time (s) | ||||
|---|---|---|---|---|
| Target | F675W | F702W | F785LP | F814W |
| 3C 356 (catalog ) | 600 | 1700 | ||
| 3C 230 (catalog ) | 560 | |||
| 3C 68.2 (catalog ) | 600 | 3400 | ||
| 3C 294 (catalog ) | 1120 | |||
| TXS 0828+193 (catalog ) | 4000 | |||
| 4C +41.17 (catalog ) | 21600 | |||
| FWHM (″) | |||||
|---|---|---|---|---|---|
| Target | |||||
| 3C 356 (catalog ) | 0.21 | 0.21 | 0.21 | ||
| 3C 230 (catalog ) | 0.20 | 0.24 | 0.24 | ||
| 3C 68.2 (catalog ) | 0.21 | 0.21 | 0.23 | 0.26 | |
| 3C 294 (catalog ) | 0.21 | 0.21 | 0.24 | ||
| TXS 0828+193 (catalog ) | 0.23 | 0.45 | 0.35 | 0.27 | |
| 4C +41.17 (catalog ) | 0.23 | 0.25 | 0.29 | ||
| Object | ||||||||||
|---|---|---|---|---|---|---|---|---|---|---|
| 3C 356 | ||||||||||
| a1 | ||||||||||
| a2 | ||||||||||
| b | ||||||||||
| 3C 230 | ||||||||||
| a | ||||||||||
| b | ||||||||||
| c | ||||||||||
| 1 | ||||||||||
| 3C 68.2 | ||||||||||
| a | ||||||||||
| b | ||||||||||
| 1 | ||||||||||
| 2 | ||||||||||
| 3 | ||||||||||
| 3C 294 | ||||||||||
| a | ||||||||||
| b | ||||||||||
| c | ||||||||||
| d | ||||||||||
| 1 | ||||||||||
| 2 | ||||||||||
| TXS 0828+193 | ||||||||||
| a | ||||||||||
| b | ||||||||||
| c | ||||||||||
| d | ||||||||||
| e | ||||||||||
| 1 | ||||||||||
| 4C +41.17 | ||||||||||
| a1 | ||||||||||
| a2 | ||||||||||
| b1 | ||||||||||
| b2 | ||||||||||
| b3 | ||||||||||
| c | ||||||||||
| Contamination (%) | |||||
|---|---|---|---|---|---|
| Target | |||||
| 3C 356 (catalog ) | 18cc[Ne V], [O II], [Ne III]; Best, Röttgering, & Longair (2000) | ||||
| 3C 230 (catalog ) | 13ddH; estimated from composite spectrum | ||||
| 3C 68.2 (catalog ) | 7cc[Ne V], [O II], [Ne III]; Best, Röttgering, & Longair (2000) | 14ddH; estimated from composite spectrum | |||
| 3C 294 (catalog ) | |||||
| TXS 0828+193 (catalog ) | 5aaC III]; Pentericci et al. (1999) | 5eeH, [N II]; Evans (1998) | |||
| 4C +41.17 (catalog ) | 15bbSi IV, C IV; Dey et al. (1997) | 15ffH, [O III]; Eales & Rawlings (1993) | |||