Quasar clustering redshift distortion constraints on dark energy
Abstract
Redshift distortions, both geometrical and kinematical, of quasar clustering are simulated, for the Two-Degree Field QSO Redshift Survey (2QZ), showing that they are very effective to constrain the cosmological density and equation of state parameters, , and . Particularly, it emerges that, for the cosmological constant case, the test is especially sensitive to the difference , whereas, for the spatially flat case, it is quite competitive with future supernova and galaxy count tests, besides being complimentary to them.
Universidade Federal do Rio de Janeiro, Instituto de Física, C. P. 68528, CEP 21945-970, Rio de Janeiro, RJ, Brazil
1. Introduction
Following Alcock & Paczyński’s (1979) and Phillipps’ (1994) lead, we extended Popowski et al. (1998) investigation as follows: (1) We performed Monte Carlo simulations to obtain the probability density function and corresponding confidence contours in the parametric plane , comparing them to other tests; (2) We included a general dark energy component with constant equation of state parameter , obtaining, for flat models, the confidence contours in the plane; (3) We explicitly took into account the effect of large-scale coherent peculiar velocities (Hamilton 1992; Matsubara & Suto 1996). Our calculations are based on the measured 2QZ distribution function and we consider best fit values for the amplitude and exponent of the correlation function as obtained by Croom et al. (2001).
2. Results
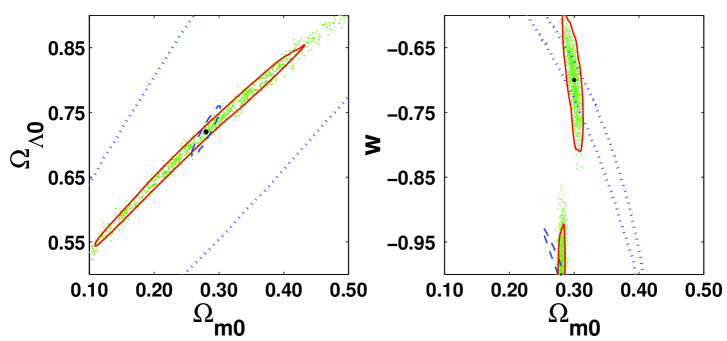
Our results are summarized in Fig. 1, where the scattered points represent the maximum likelihood estimates from our simulations and the solid black dots the “true” starting models. The left panel displays typical confidence contours for a SNAP simulation (dashed line; Goliath et al. 2001) and for the Supernova Cosmology Project (dotted line; Perlmutter et al. 1999), besides our corresponding contour (solid line), all for typical cosmological constant () models. The right panel displays two sets of confidence contours, all for typical flat models: the upper ones correspond to level for our simulations (solid line) and for DEEP (dotted; Newman & Davis 2000); the lower ones correspond to level for our simulations (solid lines) and for SNAP (dashed)
3. Discussion and conclusion
Fig. 1 shows that the test is quite sensitive (when ) to the difference ; also, for flat models, the constraints are similar to those from SNAP and somewhat better than the ones from DEEP. We have also run simulations where the “true” model takes into account the linear kinematical redshift distortion and the simulated ones do not; it then turns out that the “true” model is not reliably recovered (at level), demonstrating the importance of taking this effect explicitly into account. In contrast, for different bias functions for the “true” and the simulated models, we were able to faithfully recover .
We conclude by stressing that this sort of Alcock-Paczyński test is very promising and referring the reader to a more detailed version of this work (Calvão, de Mello Neto & Waga 2001).
References
Alcock, C. & Paczyński, B. 1979, Nature 281, 358.
Phillipps, S. 1994, MNRAS 269, 1077.
Calvão, M. O., J. R. T. de Mello Neto & Waga, I. 2001, astro-ph/0107029.
Croom, S. M. et al. 2001, MNRAS, in press.
Goliath, M. et al. 2001, astro-ph/0104009.
Hamilton, A. J. S. 1992, ApJ 385, L5.
Matsubara, T. & Suto, Y. 1996, ApJ 518, 24.
Newman, J. F. & Davis, M. 2000, ApJ 534, L11.
Perlmutter, S. et al. 1999, ApJ 517, 565.
Popowski, P. A., Weinberg, D. H., Ryden, B. S. & Osmer, P.S. 1998, ApJ 498, 11.