High Resolution 4.7 Keck/NIRSPEC Spectra of Protostars. I: Ices and Infalling Gas in the Disk of L1489 IRS111The data presented herein were obtained at the W.M. Keck Observatory, which is operated as a scientific partnership among the California Institute of Technology, the University of California and the National Aeronautics and Space Administration. The Observatory was made possible by the generous financial support of the W.M. Keck Foundation.
Abstract
We explore the infrared M band (4.7 ) spectrum of the class I protostar L1489 IRS in the Taurus Molecular Cloud. This is the highest resolution wide coverage spectrum at this wavelength of a low mass protostar observed to date (25,000; 12 ). A large number of narrow absorption lines of gas phase , , and are detected, as well as a prominent band of solid . The gas phase lines have red shifted absorption wings (up to 100 ), which likely originate from warm disk material falling toward the central object. Both the isotopes and the extent of the line wings are successfully fitted with a contracting disk model of this evolutionary transitional object (Hogerheijde, 2001). This shows that the inward motions seen in millimeter wave emission lines continue to within 0.1 AU from the star. The amount of high velocity infalling gas is however overestimated by this model, suggesting that only part of the disk is infalling, e.g. a hot surface layer or hot gas in the magnetic field tubes. The colder parts of the disk are traced by the prominent CO ice band. The band profile results from CO in ’polar’ ices (CO mixed with H2O), and CO in ’apolar’ ices. At the high spectral resolution, the ’apolar’ component is, for the first time, resolved into two distinct components, likely due to pure CO and CO mixed with CO2, O2 and/or N2. The ices have probably experienced thermal processing in the upper disk layer traced by our pencil absorption beam: much of the volatile ’apolar’ ices has evaporated, the depletion factor of CO onto grains is remarkably low (7%), and the CO2 traced in the CO band profile was possibly formed energetically. This study shows that high spectral resolution 4.7 observations provide important and unique information on the dynamics and structure of protostellar disks and the origin and evolution of ices in these disks.
1 Introduction
In the process of low mass star formation, a mixture of gas, dust, and ices accumulates in protostellar envelopes and disks. The fate of this molecular material is diverse. Most of it will fall toward the protostar and dissociates in the inner disk region or stellar photosphere. Some material will be blown away and destroyed by the stellar wind. Some may also survive and be the building material for comets and planets. Major aspects of this complicated process are not well understood, and poorly observationally constrained. For example, do the ices that form comets still resemble ices of the original pristine molecular clouds or are new ices of different composition being formed in the envelope or disk? The type of ices being formed depends on the composition of the gas that accretes onto grains. Reducing environments produce H2O-rich (‘polar’) ices, while in cold inert environments ‘apolar’ ices rich in CO, N2 and O2 can be formed (Tielens & Hagen, 1982). Depending on the composition, ices evaporate between temperatures of 18 and 90 K. Also, heat can change the solid state structure of ices by for example crystallization. Energetic particles (e.g. cosmic rays) and ultraviolet (UV) radiation are able to initiate reactions in ices and form new species. Dynamics and shocks within disks may be able to destroy ices as well.
Clearly, to determine the relative importance of these ice formation and destruction processes, knowledge of the physical conditions and structure of envelopes and disks is crucial. Much theoretical and observational work on this topic has been done over the last 10 years. Molecular gas was detected in a suite of protostellar disks by millimeter wave observations sensitive to emission over radii of several hundred AU (Dutrey, Guilloteau, & Guelin 1997; Thi et al. 2001). Gas phase abundances were found to be reduced by factors of 5 to several 100, depending on the source and the sublimation temperature of the molecules. Models of disk mid-planes indeed show high depletions because of the formation of icy mantles on grains (Aikawa et al., 1997; Willacy et al., 1998). The predicted depletions were in fact higher than observed and thus desorption mechanisms are needed to explain the millimeter wave observations (Goldsmith, Langer, & Velusamy, 1999). It was realized that the outer parts of disks are heated more efficiently when they are flared (Kenyon & Hartmann, 1987). Thus, by the influence of the stellar radiation a layer with ‘super-heated’ dust is formed in which molecules have been dissociated (Chiang & Goldreich, 1997). The layer below that is warm enough to evaporate the ices, but not dissociate the released molecules. The importance of this warm layer, and relative gas phase molecular abundances, depends strongly on how effective ice desorption mechanisms are (Willacy et al., 1998). Recent studies indicate that desorption by UV and X-ray photons may be strong enough to explain observations of molecular gas by millimeter wave telescopes (Willacy & Langer, 2000; Najita, Bergin, & Ullom, 2001). This idea is confirmed by multi transition molecular line observations which indicate temperatures ( K) and densities that typically occur in this warm layer (van Zadelhoff et al., 2001). In a third layer, the disk mid-plane, cold, dense conditions prevail, resulting in extreme depletions of gas phase molecules many orders of magnitude larger than in quiescent dense molecular clouds. Indeed, recent absorption line observations failed to detect gas phase CO in the edge-on disk around the protostar Elias 18, thus indicating an enormous depletion in the mid-plane (Shuping et al., 2001).
In this Paper we report high spectral resolution (25,000) 4.7 M band observations of the obscured protostar L1489 IRS (IRAS 04016+2610) in the Taurus Molecular Cloud. L1489 IRS is a low luminosity object (3.7 ), with a spectral energy distribution resembling that of an embedded class I protostar (Kenyon, Calvet, & Hartmann 1987). Detailed millimeter wave line and continuum studies show that L1489 IRS is surrounded by a large, 2000 AU radius rotating thick disk-like structure (Hogerheijde et al., 1998; Saito et al., 2001), rather than an inside-out collapsing envelope (Hogerheijde & Sandell, 2000). The rotation is sub-Keplerian, and the disk as a whole is contracting. Thus it was suggested that L1489 IRS represents a short-lasting (2 yr) transitional phase between embedded YSOs that have large envelopes and small (few hundred AU) rotationally supported disks, and T Tauri stars which have no envelopes and fully rotationally supported 500-800 AU size disks (Hogerheijde, 2001). This circumstellar (or circumbinary: Wood et al. 2001) disk is seen close to edge-on (60 to 90o) in scattered light images (Whitney et al., 1997; Padgett et al., 1999). A CO outflow emanates from the object (Myers et al., 1988) with Herbig Haro objects lying along it (Gómez, Whitney, & Kenyon, 1997).
Low spectral resolution infrared observations of L1489 IRS show that deep H2O (Sato et al., 1990) and CO (Chiar et al. 1998; Teixeira, Emerson, & Palumbo 1998) ice bands are present along the line of sight. In this Paper we will use the newly available spectrometer NIRSPEC at the Keck II telescope to obtain high resolution M band spectra (12 at 4.7 ) of this source. The large array of NIRSPEC allows both the vibrational band of solid CO and the surrounding ro-vibrational transitions of gas phase CO to be observed in the same high resolution spectrum. This offers a new view on this system, both on the origin and evolution of ices and the interrelationship of gas and ices as well as on the kinematics and structure of the young, contracting, close to edge-on disk. It is a unique view, because infrared absorption line studies trace all gas and solid state material at all radii from the star, while present day millimeter wave observations are limited by their relatively low spatial resolution (100 AU). Thus one of the questions that will be answered in this Paper is whether the large scale inward motions seen in millimeter wave emission lines continue to smaller radii (1 AU or less) from the star.
Previous studies have already shown that rich astrophysical information can be obtained from high spectral resolution observations in the atmospheric M band. Mainly massive, luminous protostars were observed, however (Mitchell et al., 1990), and the few observations of low mass protostars cover a small wavelength range containing only a few gas phase lines and not the solid CO band (Shuping et al., 2001; Carr, Mathieu, & Najita, 2001). This is Paper I in a series on high resolution M band spectroscopy of protostars, initiated by the availability of the NIRSPEC spectrometer at Keck II with which weak, low mass protostars can be routinely observed at high spectral resolution over a large wavelength range covering both the solid and gas phase CO features.
The reduction of the long slit spectra is discussed in §2. In §3.1, we analyze the observed gas lines, which at this resolution even give dynamical information. We use standard curve of growth and rotation diagram techniques to get a first idea of gas column and temperatures. In order to analyze the solid CO band profile in this line of sight, a detailed discussion of available laboratory experiments of solid CO is given in §3.2. In §4.1 we apply the infalling disk model of Hogerheijde (2001) to explain the observed gas phase and line profiles, and constrain the physical conditions and structure of the disk. The possibility of binarity is briefly discussed in §4.2. The gas phase analysis is linked to the the solid CO results to determine the origin and thermal history of solid CO in §4.3. We conclude with suggestions for future work in §5.
2 Observations
The infrared source L1489 IRS was observed with the NIRSPEC spectrometer (McLean et al., 1998) at the Keck II telescope atop Mauna Kea on the nights of 28/29 and 29/30 January 2001. The sky was constantly clear and dry, and the seeing was reasonable ( at 2.2 ). NIRSPEC was used in the echelle mode with the 0.43 slit, providing a resolving power of (12 )222This nominal spectral resolution was verified by measuring the Gaussian width of absorption lines in a variety of astrophysical sources. with three Nyquist sampled settings covering the wavelength range 4.615–4.819 in the atmospheric M transmission band.
The data was reduced in a standard way, using IDL routines. The thermal background emission was removed by differencing the nodding pair. Each nodding position was integrated on for 1 minute, before pointing the telescope to the other nodding position. The positioning had to be done by hand because condensations on the dewar window prevented us from using the image rotator, and the instrument had to be used in the non-standard ‘stationary guiding mode’. In this mode, the condensations were well removed by subtracting nodding pairs, although the sensitivity of Keck/NIRSPEC was reduced by several magnitudes.

The most critical step in the reduction of this data is correction for atmospheric absorption features, and separate telluric and interstellar CO absorption features. For our observations of L1489 IRS this proved to be relatively easy, because at the time of our observations the deep interstellar CO lines are shifted by as much as 43 with respect to telluric CO lines. The low airmass of the source, 1.00–1.05, also made this step easier. The standard stars HR 1380 (A7V) and HR 1497 (B3V) were observed at similar airmass, and their spectral shape and hydrogen absorption features were divided out with Kurucz model atmospheres. A good telluric correction was achieved, although residuals are seen near deep atmospheric lines. To be safe, we therefore removed the parts of the spectrum which have less than 50% of the maximum transmission in each setting. This does not affect most of the features in the L1489 IRS spectrum, because the velocity shift of 43 fully separates them from telluric features. The final signal-to-noise value on the unsmoothed spectrum is , after integration times of 11, 14, and 20 minutes on each of the three settings of this magnitude (Kenyon et al., 1993) source. The different settings were wavelength calibrated on the atmospheric CO emission lines, and subsequently the three settings were combined by applying relative multiplication factors. We have not attempted to flux calibrate the spectrum, since we are interested in absorption features only.
3 Results
The fully reduced echelle spectrum of L1489 IRS shows, in great detail, many deep narrow absorption lines of gas phase and , and a few weak lines of (Fig. 1). These lines were identified, using the line frequencies in the HITRAN catalogue (Rothman et al., 1992). The broad absorption feature between 2122-2149 can be attributed to the stretching vibration mode of in ices along this line of sight.
In order to analyze these gas and solid state absorption features, a shallow, second order polynomial continuum was applied to derive the optical depth spectrum. The solid CO band was then analyzed using available laboratory experiments (§3.2). The derivation of physical parameters from the gas phase lines is highly model dependent. First, we will derive temperatures and column densities using the standard curve of growth and rotation diagram techniques (§3.1). Then, we will independently test an astrophysically relevant power law model in §4.1. This information is combined in §4.3 to discuss the origin and thermal history of the solid CO seen in this line of sight.
3.1 Gas Phase CO
The lines have a complicated profile. Deep lines are present at a velocity of with respect to earth, which is the systemic velocity of L1489 IRS at the date these observations were done (taking 5 from millimeter emission lines; e.g. Hogerheijde & Sandell 2000). Each of the lines is accompanied by a fairly prominent wing at the red shifted side (Fig. 3.1). As an exploring step in the analysis, we decomposed the main component and its wing by fitting two Gaussians. They are separated by on average 236 , and the main feature and its wing have widths of FWHM=203 and 5317 respectively. The main feature at the systemic velocity is resolved. Excess absorption is visible at the blue and red sides with respect to (Fig. 3.1). The lines have Gaussian shapes with a width equal to the instrumental resolution (FWHM=12 ). The main absorption feature of the lines is therefore only in part responsible for the same gas seen in .
![[Uncaptioned image]](/html/astro-ph/0112163/assets/x2.png)
Comparison of the and (thick gray line) spectra of L1489 IRS. The spectra shown are averaged over the observed P(6)–P(15) lines and all lines in order to increase the signal-to-noise. They are corrected for the source and earth velocity (43 ) and the spectrum was multiplied by 3.64 to facilitate comparison.
We derived equivalent widths for the isotopes and components (Table 1), and applied a standard curve of growth technique to calculate column densities for each level. The comparison of equal levels of , , and main component provides a handle on the intrinsic line width (=FWHM/), in the assumption that all material absorbs at the same velocity (however, see §4.1). One also has to assume that the isotope ratios are constant along the line of sight (/=80 and /=560; Wilson & Rood 1994). The equivalent widths of and are then simultaneously fit at 0.8 . Lower significantly () underestimates the lines, with respect to . As mentioned above, the main component is clearly contaminated by gas not seen in , both on the blue and red shifted sides. As a first order correction we lowered the equivalent widths in Table 1 with 40%, which corresponds to unresolved lines at the observed peak optical depth. Then, we find that all isotopes are best fit simultaneously at =1.4 . This would be an upper limit if the correction for contamination of the lines were too small. Hence, this curve of growth analysis of the CO isotopes shows that, in the assumption that all gas absorbs at the same velocity, is limited to 0.8 1.5 .
| transition | transition | transition | ||||
|---|---|---|---|---|---|---|
| 10-3 | 10-3 | 10-3 | ||||
| main | wing | |||||
| R(5) | 88 (11) | 70 (22) | R(17) | 3 | R(6) | 3 |
| R(4) | 84 (10) | 54 (17) | R(16) | 5 | R(5) | 6 (2) |
| R(3) | 67 (9) | 55 (18) | R(15) | 5 (2) | R(4) | 6 (2) |
| R(2) | 73 (10) | 64 (20) | R(14) | R(3) | ||
| R(1) | 70 (9) | 39 (12) | R(13) | 5 (2) | R(2) | |
| R(0) | 68 (9) | R(12) | 4 | R(1) | ||
| P(1) | 65 (9) | 11 (4) | R(11) | 6 (2) | R(0) | |
| P(2) | 72 (10) | 30 (10) | R(10) | 6 (2) | P(1) | |
| P(3) | 80 (11) | 21 (7) | R(9) | 7 (2) | P(2) | |
| P(4) | 69 (9) | 82 (26) | R(8) | |||
| P(5) | 84 (11) | 73 (23) | R(7) | 12 (3) | ||
| P(6) | 85 (10) | 65 (20) | R(6) | 13 (2) | ||
| P(7) | 85 (11) | 90 (28) | R(5) | 19 (2) | ||
| P(8) | 85 (11) | 71 (22) | R(4) | 17 (2) | ||
| P(9) | 85 (11) | 69 (21) | R(3) | 21 (2) | ||
| P(10) | 86 (10) | 84 (26) | R(2) | 18 (2) | ||
| P(11) | 79 (10) | 61 (18) | R(1) | |||
| P(12) | 79 (11) | 56 (17) | R(0) | 24 (2) | ||
| P(13) | 88 (12) | 43 (13) | P(1) | 22 (2) | ||
| P(14) | 69 (9) | 64 (19) | P(2) | 25 (2) | ||
| P(15) | 72 (10) | 53 (16) | P(3) | 18 (2) | ||
| P(16) | P(4) | 15 (2) | ||||
| ()a | Origin | |||
| K | ||||
| 19 | 1.6 | 6 | 53 | circumstellar disk+foreground; from |
| 15 | 1.3 | 10 | 53 | as above, but alternative |
| 13 | 1.0 | 19 | 53 | as above, but alternative |
| 11 | 0.7 | 96 | 53 | as above, but alternative |
| 300 | 1.3 | 2.4 | 53 | disk; from |
| 250 | 1.0/0.7 | 2.8 | 53 | as above, but alternative |
| 250 | 0.20 | 286 | red wing | |
| 500 | 5/15 | blue and red wings resolved main | ||
| a assuming N()/N()=80 | ||||
| b assuming optically thin absorption | ||||
With the column densities per level at hand, a rotation diagram was constructed for the lines (Fig. 3.1) to derive the total column density and temperature at a number of allowed values (Table 2). Clearly, the rotation diagram shows a double temperature structure, much resembling that of high mass objects (Mitchell et al., 1990): cold ( K), and warm gas ( K) are present along the same line of sight. The column density of the cold component toward L1489 IRS is a particularly strong function of , increasing with an order of magnitude from 0.7 to 1.3 . An independent CO column of 1.4 can be estimated from =29 (Myers et al., 1987), assuming the dust and gas are co-spatial. This would suggest is in the 1.0-1.3 range.
![[Uncaptioned image]](/html/astro-ph/0112163/assets/x3.png)
Rotation diagram of , with the column densities on the vertical axis calculated from the curve of growth with =1.0 (dots: P branch; closed triangles: R branch; open triangles: R branch upper limits). The solid line corresponds to temperatures =15 K, and 250 K (Table 2) in the Boltzmann equation. Open diamonds connected with a dotted line represent the rotation diagram for our disk model, which is different from the curve of growth analysis because of a lower assumed (0.1 ) and the presence of a velocity gradient (§4.1), although both models fit the observed lines well.
For the highly red shifted wing a rotation diagram is constructed as well. Here, we assume that the absorption is optically thin, because the wings are absent in , as evidenced by the high signal-to-noise average line profile (Fig. 3.1). The rotational temperature of this highly red shifted gas is similar to that of the warm component (250 K), however the column is an order of magnitude lower (Table 2). Finally, assuming that the absorption in the wings of the resolved main component is optically thin, the column of this blue and red shifted low velocity gas (within 10 of the systemic velocity) is about 25% of the column of the high velocity red shifted gas at a similar, although poorly determined, temperature.
Summarizing, this basic analysis indicates that, from , both a large column of cold 15 K gas and a significant amount of warm gas ( K) are present within of the systemic velocity (Table 2). The lines show that warm gas at K is also present at highly red shifted velocities ( ), but at a factor 10 lower column. A small amount of warm gas is present at low red and blue shifted velocities as well (within 10 ). As further described in §4.1, the gas components at the red shifted and systemic velocities can be fitted within the same physical model of a contracting disk, but the origin of the warm gas at low blue shifted velocities is more difficult to explain.
3.2 Solid CO
The broad absorption feature between 2122-2149 (Fig. 1) can be entirely attributed to the stretching vibration mode of in circumstellar ices (§4.3). The high spectral resolution allows, for the first time, to unambiguously separate the gas phase CO lines from the solid state absorption and study the solid CO band profile in great detail. In accordance with previous, low resolution studies (Chiar et al., 1998; Teixeira et al., 1998), a distinct narrow feature is seen at 2140 , and a significantly broader component at longer wavelengths. Our data however, indicates the presence of a new, third component on the blue side, separate from the narrow 2140 feature, most notable by a change of the blue slope at 2142 (Fig. 1).
In order to explain the shape of this CO absorption profile, we have taken laboratory experiments of solid CO from the literature (Sandford et al. 1988; Schmitt, Greenberg, & Grim 1989; Palumbo & Strazzulla 1993; Trotta 1996; Ehrenfreund et al. 1997; Elsila, Allamandola, & Sandford 1997; Baratta & Palumbo 1998; Teixeira et al. 1998). We determined peak position and width of the laboratory profiles as a function of ice composition, temperature, and cosmic ray bombardment intensity. Additionally, for CO–rich ices we used optical constants to calculate the absorption profile as a function of particle shape in the small particle, Rayleigh limit (for details, see Ehrenfreund et al. 1997). The absorption profile of CO–poor ices (concentration 30%) is not affected by these particle shape effects. Changing these various parameters gives a wide variety of peak positions (2135–2144 ) and widths (FWHM=1.5–14 ) in the laboratory. We limit ourselves here by identifying general trends, as summarized in Fig. 3.2. These trends are then related to the Gaussian peak position and width of the three aforementioned components observed toward L1489 IRS (also given in Fig. 3.2).
![[Uncaptioned image]](/html/astro-ph/0112163/assets/x4.png)
Diagram showing schematically the effect of several astrophysically relevant parameters on the peak position and width of the solid stretching mode, as determined from laboratory experiments. Ellipses indicate ices of various composition. For CO–rich ices, the effect of grain shapes is indicated by arrows for spheres and ellipsoids (‘CDE’). For polar ices, the effect (magnitude and direction) of heating is given by the arrow. ‘CH3OH+CR’ means a CH3OH or a CH3OH:H2O ice irradiated by energetic particles simulating cosmic rays. The dots with error bars represent the observed peak position and width of the absorption components detected toward L1489 IRS.
The absorption band of a thin film of pure, solid CO at 10 K peaks at 2137 , and is very narrow (2 ). This clearly does not fit any of the components observed toward L1489 IRS. However, for ellipsoidally shaped grains (more precisely, a distribution of ellipsoidal shapes, ‘CDE’; Bohren & Huffman 1983), this sensitive strong band shifts to shorter wavelengths and becomes broader. Now it exactly fits the 2140 component observed toward L1489 IRS, both in peak position and width (Fig. 3.2). In view of a recent controversy on optical constants (Ehrenfreund et al., 1997), it is worth noting that good fits are obtained with optical constants from the works of Ehrenfreund et al. (1997) and Baratta & Palumbo (1998). The optical constants of Trotta (1996) do not induce strong particle shape effects and therefore pure CO does not provide a good fit to L1489 IRS for any particle shape.
Broadening of the laboratory profile, in order to fit the 2140 feature in L1489 IRS, is also achieved by adding a small amount of CO2, O2, or H2O molecules. To avoid a too large broadening, and minimize aforementioned particle shape effects, this mixture needs be diluted in N2. This astrophysically relevant molecule does not broaden the feature, and gives a small blue shift (Ehrenfreund et al., 1997; Elsila et al., 1997), required to fit the 2140 feature in L1489 IRS. Thus, both this mixture, as well as ellipsoidally shaped pure CO ice grains, provide good fits to the central 2140 feature.
Now, the width significantly increases, and the peak shifts to longer wavelengths by diluting CO in a mixture of molecules with large dipole moments such as H2O or CH3OH (Sandford et al., 1988; Tielens et al., 1991). This particular behavior is needed to fit the broad long wavelength wing seen toward L1489 IRS. Solid CH3OH has an abundance less than a few percent of solid H2O toward low mass objects (Chiar, Adamson, & Whittet, 1996). H2O seems the best dilutant, because of its large interstellar abundance. The use of H2O:CO mixtures requires interesting additional constraints. Although a low temperature, unprocessed H2O–rich ice does provide a good fit to the red wing, it can be excluded based on the presence of a prominent second absorption at 2150 in the laboratory, which is clearly absent toward L1489 IRS. This second peak is caused by CO molecules located in pockets in an amorphous ice. These CO molecules are weakly bound, and the 2150 peak disappears rapidly at higher or as a result of cosmic ray hits (Sandford et al., 1988). Thus, the H2O ice responsible for the long wavelength wing toward L1489 IRS must be thermally ( 50 K) or energetically processed.
The blue wing seen at 2143 toward L1489 IRS can only be explained by an apolar ice. Adding a significant amount of CO2 to a CO ice (CO2/CO) results in the blue shift and broadening required to fit the observed wing. Somewhat less CO2 is needed (CO2/CO) when a large amount of O2 is present. N2 may be added as well, but is not essential except as a dilutant to reduce the effects of particle shape. A good fit is obtained by the mixture N2:O2:CO2:CO=1:5:0.5:1, as proposed in Elsila et al. (1997). If CO2/CO the band peaks at too high wavelength. In CO–rich ices this problem can however be overcome by particle shape effects (Fig. 3.2). In view of this effect it is not possible to constrain the relative molecular abundances of this interstellar component in more detail, but it is clear that an apolar CO2 or O2 ice is needed, different from the distinct 2140 feature.
A three component fit to the entire CO ice band of L1489 IRS is shown in Fig. 3.2. Although this is not a unique fit, it does obey the global trends that we identified in the laboratory experiments.
Finally, the solid CO column density is derived by dividing the integrated optical depth over the band strength . We take cm molecule-1 independent of ice composition (Gerakines et al., 1995), and thus find (solid CO)=6.5 . The main source of uncertainty here is in , which is about 10%. CO in polar ices contributes 3.5 to the total column and the apolar components at 2140 and 2142 contribute each 1.5 .
![[Uncaptioned image]](/html/astro-ph/0112163/assets/x5.png)
Observed CO absorption band of L1489 IRS, fitted by a combination of three laboratory ices: a polar H2O:CO=4:1 (=50 K; dotted) to account for the long wavelength wing, an apolar N2:O2:CO2:CO=1:5:0.5:1 (=10 K; dashed) for the short wavelength wing, and a pure CO ice (’CDE’ shape; =10 K; solid) that fits the central peak. The thick, smooth gray line is the sum of these components.
4 Discussion
4.1 An Infalling Disk
The astrophysical meaning of the apparent two component temperature structure seen in the rotation diagram (Fig. 3.1) requires further investigation. For high mass protostars it was found that similar rotation diagrams can be ‘mimicked’ by power law models of spherical envelopes (van der Tak et al., 2000).
For L1489 IRS, the detection of molecular gas at a range of temperatures and red shifted velocities could indicate the presence of infalling gas at a range of radii from the protostar. Indeed, a 2000 AU radius contracting, disk-like structure was found in millimeter wave interferometer data (Hogerheijde & Sandell, 2000). In a detailed follow-up study, Hogerheijde (2001) adopts a flared-disk model based on Chiang & Goldreich (1997) with a radial power-law distribution for the temperature
| (1) |
and a density distribution that has a power-law drop-off with radius and a vertical exponential drop-off with scale height
| (2) |
The scale-height is assumed to be a simple function of R, . An inward-directed radial velocity field described as
| (3) |
is inferred, in addition to Keplerian rotation around a 0.65 M⊙ central star.
Can this contracting disk model, based on (sub-) millimeter emission observations with angular resolution of –, reproduce the observed infrared CO absorption line profiles measured along a pencil beam? The absorption lines are modeled with the radiative transfer code of Hogerheijde & van der Tak (2000); the high densities in the disk ensure LTE excitation for the lines involved, and line trapping is neglected in the excitation calculation. The model spectra include dust opacity at a standard gas/dust ratio, as well as a cm-2 column of cold foreground material (15 K; Hogerheijde 2001); both factors do not affect the spectra in any significant way. The calculated spectrum is convolved with a Gaussian of FWHM=12 , which is the NIRSPEC instrumental resolution.
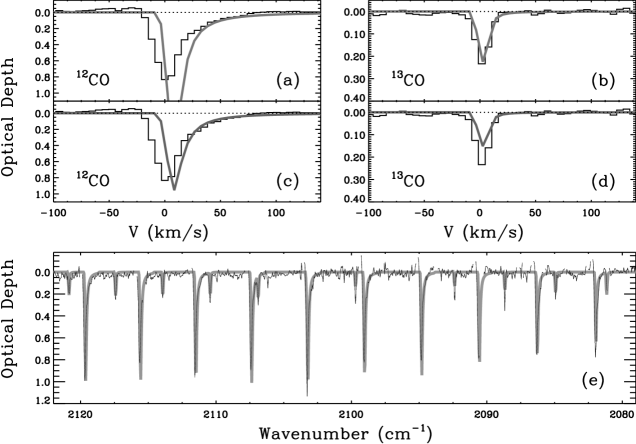
We find that, while keeping all other parameters the same as in Hogerheijde (2001), the assumed density profile sensitively influences the wings of the 12CO lines. This is enhanced by the fact that we are observing the flared disk of L1489 IRS at an inclination between and (cf., Padgett et al. 1999), and the pencil beam crosses the disk at a few scale heights. Small changes in the density profile, for example induced by the thermal structure, have a large effect on the absorption line profile. In the model of Hogerheijde (2001) the scale height increases linearly with distance from the star, and thus the density along the line of sight follows the density in the mid-plane (Eq. 2) reduced by a factor , with the inclination. Here, we include the effect of density variations, or deviations from the adopted scale height , by relaxing the values of the density along the line of sight by fitting to the data.
This initial model successfully fits the peak velocity and depth of both high and low 13CO lines (Fig. 2). Its rotation diagram is quite different from that of the curve of growth analysis (Fig. 3.1), showing that rotation diagrams must be interpreted with great care. Our model also matches the range of velocities observed in the red wings of the 12CO lines, when taking . This is a much shallower density profile compared to that derived from millimeter wave data (; Eq. 2) and indicates that the scale height increases more than linear, i.e. the disk flares more than assumed in Hogerheijde (2001). With this result, it is possible to determine the important relation of disk scale height as a function of , but only if the disk inclination is a priori known. Unfortunately the inclination is not better constrained than within the range of and imposed by near-infrared data (Padgett et al. 1999). We can therefore not distinguish between low and high values of and corresponding high and low inclinations respectively. In either case, the total 12CO column along the pencil beam is , with 58% of the CO mass at a temperature of K, 15% at K, and 27% at K. This result is of importance in §4.3 in the interpretation of the solid CO observations, and in particular in assessing the thermal history of ices. The total column of our model is in good agreement with the column derived from the visual extinction ( ; §3.1). It is also of the same order of magnitude as the total column through the mid-plane, calculated from dust and line emission ( ; Hogerheijde 2001), and confirms the relatively edge-on orientation of the disk.
However, apart from these successes, the lines show that our infalling disk model produces too much warm gas at high velocities (Fig. 2). The 12CO lines are a factor of 2.5 deeper, and, in contrast to 13CO, they peak at a too high velocity (+10 ) with respect to the observations. In principle, one could make the lines less deep by assuming that of the original, unextincted continuum flux (corresponding to 30% of the extincted continuum) reaches the slit without passing through the disk, by scattering on large grains. The shift in peak velocity however requires a solution of a more fundamental origin. Perhaps the infall velocity function is shallower, and the disk is more rotationally supported at lower radii. The amount of warm gas at high velocities can also be lowered by assuming that only part of the disk participates in the high velocity inflow, such as a thin hot surface layer, or gas accelerated in magnetic field tubes directed from the inner disk to the stellar photosphere. Such a two component model is consistent with the rotation diagram derived from the curve of growth (Fig. 3.1), and also with the low observed mass accretion rate. If we take the inflow at face value, and assume that the entire disk participates, the mass accretion rate would be M⊙, generating 7 L⊙ in accretion luminosity. The star’s Lbol is estimated at 3.7 L⊙ which also contains the stellar luminosity. It is therefore indeed likely that the mass accretion onto the star is significantly lower, as is also traced through the lack of the hydrogen Pf emission line in our spectrum (2148.8 ; Fig. 1) and the weakness of Br emission (Muzerolle, Hartmann, & Calvet, 1998).
4.2 Binarity?
An entirely different explanation for the line profiles may lie in the possibility that L1489 IRS is a protobinary system. A protobinary nature of L1489 IRS is suggested by various pieces of evidence (Lucas, Blundell, & Roche 2000; Wood et al. 2001 and references therein). The presence of a quadrupolar outflow system is inferred from K band polarization images, C18O emission line profiles, Herbig-Haro knots that are scattered throughout the L1489 IRS environment, and a very complex near infrared scattered light pattern. Three dimensional models, in which the axisymmetry of the infalling circumstellar envelope is broken by multiple outflow cavities that are perpendicular to each other, are able to account for the observed morphology.
The putative binary itself, however, has not been resolved so far. An upper limit on the projected separation from near infrared images has been set on 20 AU (Padgett et al., 1999). If the CO absorption line profile is in any way related to a binary system, then the large observed velocities (23 ; §3.1) may indeed favor a close binary system. The line profile is then expected to vary on a time scale of a few months, which can easily be tested. In this case, much of the observed warm gas might be present in two small circumstellar disks, which are in a close orbit around each other. Some of the warm gas may also be present at low density in the central cavity created by the binary. The large column of cold gas may originate in the circumbinary disk. The binary extracts momentum from the 2000 AU circumbinary disk, setting up the inward motion seen in millimeter wave emission lines. We leave further investigation of this topic for future studies.
4.3 The Origin and Evolution of Ices
In order to establish if the solid CO observed toward L1489 IRS originates in foreground clouds or in a circumstellar (or binary) disk, it is worth to compare with ices observed in lines of sight not affected by star formation. Observations of field stars obscured by intervening quiescent material of the Taurus Molecular Cloud have revealed that solid CO is not present when the extinction (e.g. Teixeira & Emerson 1999). The solid CO toward L1489 IRS can therefore not be associated with foreground clouds, which have a gas column of (12CO)= 1 (Hogerheijde, 2001), corresponding to .
Thus, the solid CO must be present in the disk of L1489 IRS. The absorption profile is intriguingly different from that seen in quiescent clouds. The broad red wing has a depth of 30% with respect to the narrow 2140 peak, which is significantly more than toward all measured background stars (10%; Chiar et al. 1995). This may well be an effect of thermal processing along the L1489 IRS line of sight, because the sublimation temperatures of polar and apolar ices, causing the broad and narrow features respectively, are very different (90 versus 18 K). However, a chemical origin of an increased abundance of polar ices in disks cannot be excluded, because the apparently edge-on system Elias 18 in the Taurus Molecular Cloud has an extremely large CO depletion factor (solid/[gas+solid]100% versus 7% for L1489 IRS), but a deep red ‘polar’ CO wing is present as well (Shuping et al., 2001; Chiar et al., 1998). On the other hand, energetic processing may take place even in the cold disk of Elias 18 (Whittet et al., 2001). Clearly, it is necessary to observationally characterize the ices in circumstellar disks in much more detail.
If for now we assume the sublimation scenario, we can do some general extrapolations which can be compared with the results of our gas phase study (§4.1). By scaling the long wavelength wing of solid CO of background field stars to that of L1489 IRS, we find that a column of 6 of CO has evaporated from the apolar ice component in the part of the L1489 IRS disk along the pencil absorption beam where K (the sublimation temperature of polar ices). Then the column of solid CO that went from the quiescent cloud into building this part of the disk is 12.5 . Extrapolating this further, we use the observed CO depletion factor of 30% toward field stars behind the Taurus Molecular Cloud (Chiar et al., 1995) to calculate that the original quiescent gas column must have been of the order of 3 . Adding the evaporated column, the expected present day gas column at K is 3.6 . This is of the same order of magnitude as the CO column below 90 K in our collapsing disk model ([CO]=8.7 ), which may indicate that no chemical change in the apolar/polar CO ice ratio and no significant additional depletion has occurred in the evolution from quiescent Taurus Molecular Cloud material to the formation of the L1489 IRS disk. This contrasts strongly with the very large depletions found in the (older) disks of T Tauri stars (Dutrey et al., 1997). The low CO depletion along the pencil beam toward L1489 IRS (7%) and the supposed signs of thermal processing (see below) may be due to the fact that our line of sight does not cross the disk mid-plane, i.e. the system is not exactly edge-on. The ice processing we see takes place higher in the disk atmosphere, perhaps in the warm layer below the super-heated dust layer responsible for millimeter wave line emission (van Zadelhoff et al., 2001). It must be noted that in the model of Hogerheijde (2001) the gas temperatures are larger than 25 K, prohibiting the formation of apolar ices and large CO depletions anywhere in the disk. The observed presence of apolar CO ices thus indicates that, as already suggested in §4.1, the line of sight may cross the cold, rotationally supported disk interior not traced in the observations and infall model of Hogerheijde (2001).
Apart from evaporation of apolar ices, other hints of thermal processing include the aforementioned absence of the 2150 absorption (§3.2), which occurs in cold unprocessed polar CO ices but disappears at temperatures K. Also, the blue apolar wing may be a consequence of thermal processing. If the central 2140 peak is due to a mixture of O2, N2 and CO instead of pure CO (spectroscopically these cannot be distinguished), thermal or energetic processing (UV radiation from the ISRF, UV induced by H2 cosmic ray collisions, or direct hits of cosmic rays) could efficiently produce CO2. This could cause the band to broaden and shift to the position of the observed blue wing. Chemical models indicate that energetic processing of molecules in disks takes place on a time scale of 106 yrs (Aikawa et al., 1999), which is somewhat longer than the age of the disk of L1489 IRS ( yrs). This however applies to the disk mid-plane, and the time scale may well be shorter in the lower density higher disk layers that our observations of L1489 IRS trace. A possible problem with the energetic processing interpretation is the absence of a feature adjacent to the short wavelength side of the CO ice band, usually attributed to energetically produced CN bondings (Whittet et al., 2001). Another spectroscopic tracer of thermal processing is the signature of crystallization in the band profiles of H2O and CO2 ices. Our infalling disk model predicts that only 15% of the gas is within the temperature range at which ices crystallize (60–90 K), and thus crystallization is not expected to play a significant role in the disk of L1489 IRS. This model prediction can be tested with future high quality H2O and CO2 spectra of L1489 IRS.
In summary, several pieces of evidence indicate that the CO ices in the disk of L1489 IRS have experienced thermal or energetic processing. The strongest arguments are the low depletion factor and the low ratio of apolar to polar ices with respect to the quiescent Taurus Molecular Cloud material. This may be explained by the fact that the disk of L1489 IRS is seen under an angle, and our pencil absorption beam traces the warm upper disk layers.
5 Summary and Future Work
We have shown that valuable and unique information is obtained from high resolution spectroscopy of the CO fundamental at 4.7 toward the low mass class I protostar L1489 IRS in the Taurus Molecular Cloud. At a resolution of (12 ) this object shows a multitude of deep ro-vibrational absorption lines of , as well as and . The isotopes trace large columns of warm and cold gas in the circumstellar disk at or within 3 of the systemic velocity, while the line profiles show warm gas that is red shifted at a range of velocities of up to 100 . Both the line depth of the isotopes and the extent of the red shifted warm gas seen in are well explained by an infalling flared disk model with power laws for the temperature, infall velocity, and density (a small column of blue shifted gas seen in the line wing however remains unexplained). These observations show that the inward motions inferred on scales of several hundred AU through millimeter wave interferometry, continue to within 0.1 AU of the star, where the velocity model of Hogerheijde (2001) predicts inward velocities exceeding several tens of . A detailed comparison of our power law infall model however overestimates the amount of warm, high velocity infalling gas. Much of this gas must therefore be rotationally supported, and only a thin disk surface layer is infalling, or gas is accelerated along magnetic fields in the inner parts of the disk. High spatial resolution millimeter wave observations (with ALMA) are needed to test our model, e.g. to refine the determination of the velocity field in the inner disk parts and the dependence of the disk scale height on radius . Finally, high spatial resolution infrared interferometer observations would be able to see if L1489 IRS is a close binary system ( 20 AU), which is essential to assess the importance of this aspect to the observed line profiles and disk evolution.
In the same spectrum, a deep CO ice band is seen toward L1489 IRS, which we conclude to originate in the disk. The high signal-to-noise and spectral resolution allowed us to separate it from circumstellar CO absorption lines, and to do a detailed comparison with laboratory mixtures. It is, for the first time, found that besides the well known long wavelength wing of polar H2O:CO ices and the central narrow absorption peak at 2140 , an additional, separate component is present on the blue side of the ice band. Both the central peak and the blue shifted component are due to CO in apolar ices, one due to pure CO and one due to a mixture of CO2 and perhaps O2 and N2. The relatively large depth of the long wavelength, polar wing relative to the apolar components may suggest that the ices in the disk of L1489 IRS are thermally processed with respect to the quiescent Taurus Molecular Cloud material, which is supported by the low depletion factor (7%) in this line of sight. This is likely due to the fact that we see the disk under an angle, and our pencil absorption beam traces the upper disk layers.
The present work shows that high spectral resolution 4.7 observations are a great tool to better understand protostellar disks, which define the initial conditions of planet and comet formation both in the solid and gas phase. This is an exploratory study and needs to be followed up by observing a larger sample of protostellar disks at 4.7 to investigate the influence of parameters such as foreground contribution, disk inclination, age, and binarity on gas and ice band profiles.
References
- Aikawa et al. (1997) Aikawa, Y., Umebayashi, T., Nakano, T., & Miyama, S.M. 1997, ApJ, 486, 51
- Aikawa et al. (1999) Aikawa, Y., Umebayashi, T., Nakano, T., & Miyama, S.M. 1999, ApJ, 519, 705
- Baratta & Palumbo (1998) Baratta, G.A., & Palumbo, M.E. 1998, J.Opt.Soc.Am. A, 15, 3076
- Bohren & Huffman (1983) Bohren, C.F., & Huffman, D.R. 1983, Absorption and Scattering of Light by Small Particles. John Wiley & Sons, New York, ch. 5
- Carr, Mathieu, & Najita (2001) Carr, J.S., Mathieu, R.D., & Najita, J.R. 2001, ApJ, 551, 454
- Chiang & Goldreich (1997) Chiang, E.I., & Goldreich, P. 1997, ApJ, 490, 368
- Chiar et al. (1995) Chiar, J.E., Adamson, A.J., Kerr, T.H., & Whittet, D.C.B. 1995, ApJ, 455, 234
- Chiar, Adamson, & Whittet (1996) Chiar, J.E., Adamson, A.J., & Whittet, D.C.B. 1996, ApJ, 472, 665
- Chiar et al. (1998) Chiar, J.E., Gerakines, P.A., Whittet, D.C.B., Pendleton, Y.J., Tielens, A.G.G.M., Adamson, A.J., & Boogert, A.C.A. 1998, ApJ, 498, 716
- Dutrey et al. (1997) Dutrey, A., Guilloteau, S., & Guelin, M. 1997, A&A, 317, L55
- Ehrenfreund et al. (1997) Ehrenfreund, P., Boogert, A.C.A., Gerakines, P.A., Tielens, A.G.G.M., & van Dishoeck, E.F. 1997, A&A, 328, 649
- Elsila et al. (1997) Elsila, J., Allamandola, L.J., & Sandford, S.A. 1997, ApJ, 479, 818
- Gerakines et al. (1995) Gerakines, P.A., Schutte, W.A., Greenberg, J.M., & van Dishoeck, E.F. 1995, A&A, 296, 810
- Goldsmith, Langer, & Velusamy (1999) Goldsmith, P.F., Langer, W.D., & Velusamy, T. 1999, 519, 173
- Gómez, Whitney, & Kenyon (1997) Gomez, M., Whitney, B.A., & Kenyon, S.J. 1997, AJ, 114, 1138
- Hogerheijde (2001) Hogerheijde, M.R. 2001, ApJ, 553, 618
- Hogerheijde & Sandell (2000) Hogerheijde, M.R., & Sandell, G. 2000, ApJ, 534, 880
- Hogerheijde & van der Tak (2000) Hogerheijde, M.R., & van der Tak, F.F.S. 2000, A&A, 362, 697
- Hogerheijde et al. (1998) Hogerheijde, M.R., van Dishoeck, E.F., Blake, G.A., & van Langevelde, H.J. 1998, ApJ, 502, 315
- Kenyon & Hartmann (1987) Kenyon, S.J., & Hartmann, L. 1987, ApJ, 323, 714
- Kenyon et al. (1993) Kenyon, S.J., Calvet, N., & Hartmann, L. 1993, ApJ, 414, 676
- Lucas, Blundell, & Roche (2000) Lucas, P.W., Blundell, K.M., & Roche, P.F. 2000, MNRAS, 318, 526
- McLean et al. (1998) McLean, I.S., Becklin, E.E., Bendiksen, O., Brims, G., & Canfield, J. 1998, Proc. SPIE, 3354, 566
- Mitchell et al. (1990) Mitchell, G.F., Maillard, J.-P., Allen, M., Beer, R., & Belcourt, K. 1990, ApJ, 363, 554
- Muzerolle, Hartmann, & Calvet (1998) Muzerolle, J., Hartmann, L., & Calvet, N. 1998, AJ, 116, 2965
- Myers et al. (1987) Myers, P.C., Fuller, G.A., Mathieu, R.D, Beichman, C.A., Benson, P.J., Schild, R.E., & Emerson, J.P. 1987, ApJ, 319, 340
- Myers et al. (1988) Myers, P.C., Heyer, M., Snell, R.L., & Goldsmith, P.F. 1988, ApJ, 324, 907
- Najita, Bergin, & Ullom (2001) Najita, J., Bergin, E.A., & Ullom, J.N. 2001, ApJ, 561, 880
- Padgett et al. (1999) Padgett, D.L., Brandner, W., Stapelfeldt, K.R., Strom, S.E., Terebey, S., & Koerner, D. 1999, AJ, 117, 149
- Palumbo & Strazzulla (1993) Palumbo, M.E., & Strazzulla, G. 1993, A&A, 269, 568
- Rothman et al. (1992) Rothman, L.S., Gamache, R.R., Tipping, R.H., Rinsland, C.P., Smith, M.A.H., et al. 1992, J. Quant. Spectrosc. Radiat. Transfer, 48, 469
- Sandford et al. (1988) Sandford, S.A., Allamandola, L.J., Tielens, A.G.G.M., & Valero, L.J. 1988, ApJ, 329, 498
- Saito et al. (2001) Saito, M., Kawabe, R., Kitamura, Y., & Sunada, K. 2001, ApJ, 547, 840
- Sato et al. (1990) Sato, S., Nagata, T., Tanaka, M., & Yamamoto, T. 1990, ApJ, 359, 192
- Schmitt, Greenberg, & Grim (1989) Schmitt, B., Greenberg, J.M., & Grim, R.J.A. 1989, ApJ, 340, L33
- Shuping et al. (2001) Shuping, R.Y., Chiar, J.E., Snow, Th.P., & Kerr, Th. 2001, ApJ, 547, 161
- Teixeira et al. (1998) Teixeira, T.C., Emerson, J.P, & Palumbo, M.E. 1998, A&A, 330, 711
- Teixeira & Emerson (1999) Teixeira, T.C., & Emerson, J.P 1999, A&A, 351, 292
- Thi et al. (2001) Thi, W.F., van Dishoeck, E.F., Blake, G.A., et al. 2001, ApJ, 561, 1074
- Tielens & Hagen (1982) Tielens, A.G.G.M., & Hagen, W. 1982, A&A, 114, 245
- Tielens et al. (1991) Tielens, A.G.G.M., Tokunaga, A.T., Geballe, T.R., & Baas, F. 1991, ApJ, 381, 181
- Trotta (1996) Trotta, F. 1996, PhD Thesis, Université Joseph Fourier, Grenoble, France
- van der Tak et al. (2000) van der Tak, F.F.S., van Dishoeck, E.F., Evans, N.J. II, & Blake, G.A. 2000, ApJ, 537, 283
- van Zadelhoff et al. (2001) van Zadelhoff, G., van Dishoeck, E.F., Thi, W., & Blake, G.A. 2001, A&A, 377, 566
- Whitney et al. (1997) Whitney, B.A., Kenyon, S.J., & Gómez, M. 1997, ApJ, 485, 703
- Whittet et al. (2001) Whittet, D.C.B., Pendleton, Y.J., Gibb, E.L., Boogert, A.C.A., Chiar, J.E., & Nummelin, A. 2001, A&A, 550, 793
- Willacy et al. (1998) Willacy, K., Klahr, H.H., Millar, T.J., & Henning, Th. 1998, A&A, 338, 995
- Willacy & Langer (2000) Willacy, K., & Langer, W.D. 2000, ApJ, 544, 903
- Wilson & Rood (1994) Wilson, T.L., & Rood, R.T. 1994, ARA&A, 32, 191
- Wood et al. (2001) Wood, K., Smith, D., Whitney, B., Stassun, K., Kenyon, S.J., Wolff, M.J., & Bjorkman, K.S. 2001, ApJ, 561, 299