X-ray Spectrum and Pulsations of the Vela Pulsar
Abstract
We report the results of the spectral and timing analysis of observations of the Vela pulsar with the Chandra X-ray Observatory. The spectrum shows no statistically significant spectral lines in the observed 0.25–8.0 keV band. It consists of two distinct continuum components. The softer component can be modeled as either a magnetic hydrogen atmosphere spectrum with eV, km, or a standard blackbody with eV, km (the radii are for a distance of 250 pc). The harder component, modeled as a power-law spectrum, gives photon indices depending on the model adopted for the soft component: for the magnetic atmosphere soft component, and for the blackbody soft component. Timing analysis shows three peaks in the pulse profile, separated by about 0.3 in phase. Energy-resolved timing provides evidence for pulse profile variation with energy. The higher energy ( keV) profile shows significantly higher pulsed fraction.
Penn. State University, 525, Davey Lab, University Park, PA 16802
Max-Planck-Insitut für Extraterrestrische Physik, Garching, Germany
ATNF, CSIRO, P.O. Box 76, Epping, NSW 1710, Australia
School of Maths & Physics, University of Tasmania, Australia
1. Introduction
The Vela pulsar (B0833-45), with a period of 89 millisecond and a characteristic age of 11,000 years, it is the prototype of the young “Vela-like” pulsars. The excellent angular resolution of Chandra allows us to separate the pulsar from its synchrotron nebula and study its X-ray properties.
2. Spectrum
We extracted a total of 16000 counts in the range 0.25–2.0 keV from two HRC-S/LETG observations of 25 ks each. No deviations of counts in the individual bins from the mean value of neighboring 10–20 bins were found with statistical significance higher than 2.7. This may indicate that there are no elements heavier than H present on the NS surface. The spectral fits with thermal models show excess counts at the high energy end.
To get a handle on the harder component, we used the publicly available ACIS/HETG data obtained in the Continuous Clocking (CC) mode. We used only the zero order image, which is equivalent to about 3 ks observation without the grating. We applied manual corrections for the dither and the SIM motion for both timing and the event position in sky plane (see Zavlin et al. 2000 for details). The background was estimated by interpolating between the neighboring regions in the 1D image of the pulsar and its nebula. Since the ACIS response is poorly known at E 0.5 keV, and the background dominates above 8.0 keV in the CC mode, we use the events in the energy range 0.5–8.0 keV.

| Thermal | Teff | Reff | L | L | ||
|---|---|---|---|---|---|---|
| Model | ( cm-2) | (MK) | (km) | (erg s-1) | (erg s-1) | |
| Blackbody | 2 | 1.5 | 2 | 1.5 | 2.7 | |
| H Atmosphere | 3 | 0.7 | 12 | 3.8 | 1.5 | 1.5 |
The combined spectral fit to the HRC-S/LETG and ACIS/HETG-CC data clearly shows two components – a soft thermal component, which fits equally well with a blackbody or a magnetic neutron star atmosphere model, and a harder component, which we interpret as a power-law (PL). The parameters of the fit depend on the model chosen for the soft thermal component. Table 1 shows the parameters of fits to the combined data (see Pavlov et al. 2001 for details) . Figure 1 shows the broadband spectrum of the Vela pulsar. The soft X-ray spectral parameters are for the atmosphere model. The extrapolation of the PL component matches both the optical and the hard X-ray/-ray flux. This is the first conclusive observation of both the thermal and the non-thermal radiation from the Vela pulsar.
3. Timing
The Vela pulsar was observed twice with the HRC-I and twice with the HRC-S/LETG. Both of the HRC-I observations and the first LETG observation suffered from the HRC timing problem. We corrected the times by shifting to the time of the next event in the level 1 event list taking only the events with time correction less than 4 ms. The second LETG observation was in the timing mode, so we could recover all the event times.
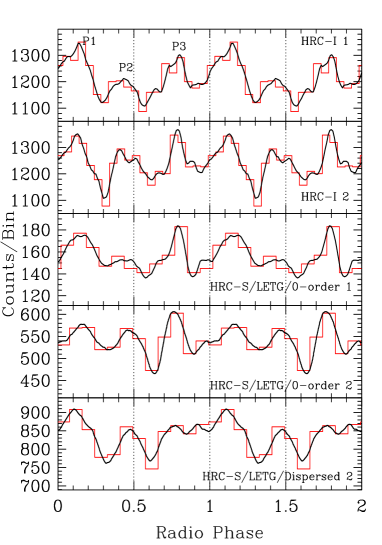
We used the radio ephemeris of the Vela pulsar based on the observations at the Hobart and Parkes radio observatories. The phase of each event was determined and folded to get the pulse profiles. The left panel of Figure 2 shows the observed pulse profiles of the HRC observations. The pulse profiles show three peaks separated by about 1/3 of phase, with a total pulsed fraction of (see also Helfand et al. 2001). The pulsed fluxes in the three peaks are shown in Figure 1.
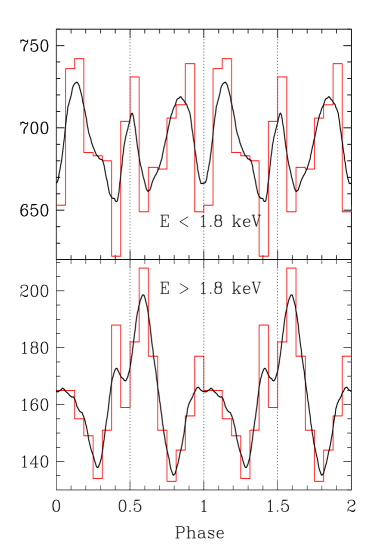
For the ACIS/HETG-CC observation, the recorded times are the event readout times. We corrected the times for the dither and SIM motion, and the delay from the event to its readout. The correction for absolute time depends on the actual position of the source on the CCD, which is poorly known at present. Therefore, we are unable to get the absolute times for the CC observation. The relative times, on the other hand, are accurate. The right panel of Figure 2 shows the ACIS pulse profiles in two energy bands ( keV and keV). The difference in the profile shapes and the pulsed fraction is striking. We estimate the intrinsic pulsed fraction of the pulsar to be and in the keV and keV bands, respectively.
4. Summary
-
•
The HRC-S/LETG spectrum shows no conclusive evidence for lines in the 0.25–2.0 keV range. The spectrum shows two components (thermal + non-thermal), similar to middle-aged pulsars. The thermal component is consistent with the emission from a magnetic Hydrogen atmosphere. Extrapolation of the PL component matches the optical and the hard X-ray points.
-
•
The thermal luminosity of the Vela pulsar is lower than that predicted by the “standard” neutron star cooling models (Tsuruta 1998).
-
•
HRC data show three peaks with total pulsed fraction of about . Energy-resolved ACIS pulse profiles show energy-dependent shape and pulsed fraction. The pulse profile at keV is similar to that observed with HRC. At keV, the pulse profile shows only two peaks with estimated intrinsic pulsed fraction of .
Acknowledgments.
This work was supproted by NASA grants NAG5-7017, NAG5-10865, NAS8-3852, and SAO grant GO1-2071X.
References
Helfand, D. J., Gotthelf, E. V., Halpern, J. P. 2001, ApJ, 556, 380
Kanbach, G. et al. 1994, A&A, 289, 855
Nasuti F. P. et al. 1997, A&A, 323, 839
Pavlov, G. G. et al. 2001, ApJ, 552, L129
Schönfelder, V. et al. 2000, A&AS, 143, 145
Strickman, M. S. et al. 1996, ApJ, 460, 735
Tsuruta, S. 1998, Phys. Rev., 292, 1
Zavlin, V. E., Pavlov, G. G., Sanwal, D. & Trümper, J. 2000, ApJ, 540 L25