Clustering Properties and Gravitational Lensing of Forming Spheroidal Galaxies
Abstract
We show that the predictions of the recent physical model by Granato et al. (2001) are fully consistent with the available estimates of the clustering properties of galaxies at (sub)-mm wavelengths. The model is then exploited to compute the expected power spectrum of fluctuations due to clustering at the frequencies of the High Frequency Instrument (HFI) of ESA’s Planck satellite. The clustering signal is found to be detectable in regions of low interstellar dust emission. A further distinctive prediction of the adopted model is a remarkably high fraction of gravitationally lensed sources at bright mm/sub-mm fluxes. In fact, according to the adopted model, only thanks to gravitational lensing, a significant number of high- forming spheroidal galaxies will be detectable by large area, shallow surveys at mm/sub-mm wavelengths, such as those carried out by Planck/HFI. Allowing for other source populations, we find that the fraction of gravitationally lensed sources at bright mm/sub-mm fluxes is expected to be up to .
keywords:
gravitational lensing – galaxies: formation – large scale structure of the Universe – submillimetre: galaxies1 Introduction
The formation and early evolution of massive spheroidal galaxies is still a most controversial issue. In the general framework of the hierarchical clustering picture for structure formation in Cold Dark Matter (CDM) cosmologies, two scenarios are confronting each other. According to the “monolithic” scenario, a large fraction of giant elliptical galaxies formed most of their stars in a single gigantic star-burst at high redshift, and then essentially underwent passive evolution. This approach is in contrast with the “merging” scenario, backed up by semi-analytic galaxy formation models (e.g. Kauffmann 1996; Baugh et al. 1998), wherein large galaxies mostly formed via mergers of smaller galaxies that, at the time of merging, had already converted part of their gas into stars. These two scenarios yield very different predictions of the evolution of large ellipticals: if “monolithic” collapse is assumed, the comoving number density of such galaxies remains essentially constant with redshift, while their bolometric luminosity increases with look-back time out to their epoch of formation. On the contrary, according to the “merging” scenario, the comoving density of large ellipticals decreases with increasing redshift.
The evolution of the comoving density in the optical band has however proven difficult to measure, and discordant results have been reported. A deficit of old ellipticals at , when compared to predictions from pure luminosity evolution models, has been claimed by several groups (Kauffmann et al. 1996; Zepf 1997; Franceschini et al. 1998; Barger et al. 1999b; Menanteau et al. 1999; Treu & Stiavelli 1999; Rodighiero et al. 2001), while others found evidence for a constant comoving density up to (Totani & Yoshii 1997; Benitez al. 1999; Broadhurst & Bowens 2000; Scodeggio & Silva 2000; Cohen 2001).
Furthermore, Daddi et al. (2000) find that the observed surface density of Extremely Red Objects (EROs)– the bulk of which appears to be passively evolving ellipticals – is consistent with predictions from the “monolithic” scenario.
The results of SCUBA and MAMBO surveys at sub-mm/mm wavelengths severely challenge the “merging” scenario. The most exhaustive investigation carried out so far (Granato et al. 2000) combines the semi-analytic galaxy formation model by the Durham group (Cole et al. 2000) with the state-of-the-art spectro-photometric code by Silva et al. (1998) which includes reprocessing of starlight by dust. It turns out that, while this approach successfully accounts for a large variety of observables (spectral energy distributions of galaxies of different morphological classes, luminosity functions over a wide wavelength range, from UV to far-IR, and more), it nevertheless falls short by a substantial factor when trying to account for the mm/sub-mm counts. Similarly, Devriendt & Guiderdoni (2000), who used a totally independent semi-analytic model, were forced to introduce an ad-hoc galaxy population to reproduce such counts.
The main problem stems from the fact that, although only a handful of redshifts of SCUBA/MAMBO sources have been reliably measured so far, there is growing circumstantial evidence that many (perhaps most) of them are ultraluminous star-forming galaxies at (Smail et al. 2000; Dunlop 2000; Carilli et al. 2000; Bertoldi et al. 2000; Scott et al. 2001; Fox et al. 2001). Furthermore, the inferred star-formation rates are very high (typically from a few hundreds to ), consistent with those required to build the stellar populations of massive ellipticals on a timescale Gyr.
A detailed, astrophysically grounded, model which fully accounts for both the SCUBA/MAMBO counts in the framework of hierarchical clustering scenarios, and for the main aspects of the chemical evolution of spheroidal galaxies (stellar metalicity, luminosity-metalicity relationship, enhancement) has been recently presented by Granato et al. (2001). Key ingredients of this model are: i) a tight relationship between formation and early evolution of spheroidal galaxies and active nuclei hosted at their centres (note that first evidences for a SCUBA/AGN connection have recently been found by Almaini et al. 2001); ii) once the effects of cooling and heating (the latter being mostly due to stellar feedback) are properly taken into account, the timescale for star formation within virialised dark matter (DM) halos turns out to be relatively short for massive spheroidal galaxies while it is longer in the case of less massive halos, where the feedback from supernovae (and/or the active nucleus) slows down the star formation and can also expel a significant fraction of the gas. It therefore follows that the canonical scheme implied by the hierarchical CDM scenario – small clumps collapse first – is reversed in the case of baryons.
During the active star-formation phase, large spheroidal galaxies show up as luminous sub-mm sources, accounting for the SCUBA and MAMBO counts. The subsequent evolution is essentially passive, except possibly for minor mergers, much like that expected in the “monolithic” scenario.
As mentioned by Granato et al. (2001), the model implies that SCUBA/MAMBO galaxies are highly biased tracers of the matter distribution. The model also establishes well defined links between these galaxies and other galaxy populations such as Lyman Break Galaxies (LBGs) and Extremely Red Objects (EROs). Studies of their clustering properties therefore provide a test for it. A first discussion of this aspect was offered by Magliocchetti et al. (2001a, henceforth MA2001). In this paper we extend the analysis and compare the clustering properties predicted by the model with recent observational measurements at m and m.
Another distinctive feature of this model is the extremely steep, essentially exponential decline of the bright tail of mm/sub-mm counts of forming spheroids. This is due to the fact that, according to the adopted model, the bulk of star formation in such objects is essentially complete at . The bright counts therefore essentially reflect the high luminosity tail of the luminosity function. This in turn relies on the fact that within the hierarchical clustering scenario massive halos are exponentially rare at high redshifts. Hints of such a steep decline can possibly be discerned in the recent MAMBO (Carilli et al. 2000; Bertoldi et al. 2000) and SCUBA bright surveys (Scott et al. 2001; Borys et al. 2001).
As extensively quantified and discussed in Sections 4 and 5, such a steep decrease in the number counts for fluxes implies a large fraction of strongly lensed galaxies to appear at bright mm/sub-mm fluxes. This fraction is found to be larger than those worked out for other (phenomenological) models that also successfully account for SCUBA/MAMBO counts (Rowan-Robinson 2001; Takeuchi et al. 2001; Pearson et al. 2001; Blain et al. 1999b).
The layout of this paper is as follows. In § 2 we compare the predictions of the model by Granato et al. (2001) with recent measurements of clustering properties of SCUBA galaxies (Peacock et al. 2000; Scott et al. 2001) and draw some conclusions on the cell-to-cell fluctuations of the projected density of sources, found to be strong enough to account for the discrepancies in the number counts observed in different regions of the sky by different groups. In § 3 we present the power spectra of temperature fluctuations due to clustering of forming spheroidal galaxies in Planck/HFI channels and derive predictions for the power spectrum of extra-galactic background fluctuations at m, to be compared with the signal detected by Lagache & Puget (2000). § 4 gives the essential details of our calculations on the effect of lensing on source counts, while in § 5 we report our predictions for counts of lensed galaxies at mm/sub-mm wavelengths, with reference to those covered by the Planck/HFI instrument. Conclusions are presented in § 6.
Throughout the paper we will assume a Cold Dark Matter flat cosmology with , , with and a COBE-normalised . We note however that our conclusions are only weakly dependent on the underlying cosmological model.
2 Clustering of high-z forming spheroidal galaxies: model predictions vs. observations
A crucial test for a galaxy formation model is its ability to correctly describe the large-scale properties of the populations under investigation. In MA2001 we have presented predictions for the clustering of SCUBA sources and their contribution to the total background fluctuations in the sub-mm band, based on the model by Granato et al. (2001). The model has been proven to provide a good fit to the clustering properties of LBGs (Giavalisco et al. 1998), corresponding in our framework to the early evolutionary phases of low-to-intermediate mass spheroidal galaxies.
In this Section we will extend the analysis of MA2001 and compare the results to the best up-to-date clustering measurements at 850 m. We start off with the theoretical expression for the angular two-point correlation function :
| (1) |
(Peebles 1980), where is the spatial mass-mass correlation function (obtained as in Peacock & Dodds 1996; see also Moscardini et al., 1998 and Magliocchetti et al. 2000), is the comoving radial coordinate, (for a flat universe and in the small angle approximation), and is the number of objects within the shell (). The relevant properties of SCUBA galaxies are included in the redshift distribution of sources , and in the bias factor .
The effective bias factor of all the dark matter haloes with masses greater than some threshold is then obtained by integrating the quantity (whose expression has been taken from Jing 1998) – representing the bias of individual haloes of mass – weighted by the mass function of SCUBA sources:
| (2) |
with , where is the mass function of haloes (Press & Schechter, 1974; Sheth & Tormen 1999), is the duration of the star-formation burst and is the life-time of the haloes in which these objects reside.
The bias factor in Eq. (2) and the angular correlation function of Eq. (1) have then been evaluated for three mass ranges: i) masses in the range , duration of the star formation burst Gyr, and typical m fluxes mJy; ii) masses in the range – and Gyr; iii) masses in the range , Gyr, dominating the counts at m fluxes mJy (note that by we denote the mass in stars at the present time).
Furthermore, we considered two extreme values for the ratio between mass in stars and mass of the host dark halo – and – which encompass the range covered by recent estimates for massive objects (McKay et al. 2001; Marinoni & Hudson 2001). Granato et al. (2001) found that this ratio is for the massive objects.
According to our model, sources are expected to be strongly clustered, with a clustering signal which increases for brighter sources and higher values of . From the above discussion it follows that measurements of are in principle able to discriminate amongst different models for SCUBA galaxies and in particular to determine both their star-formation rate, via the amount of baryonic mass actively partaking of the process of star formation, and the duration of the star-formation burst.

Tentative evidence for positive clustering of SCUBA galaxies on scales of – has been found by Scott et al. (2001) for a sample of 38 mJy sources observed in two regions of the sky corresponding to the ELAIS N2 and Lockman-Hole East fields. Although such measurements are dominated by noise due to small-number statistics, it is nevertheless interesting to note that – as illustrated by Figure 1 – our predictions show full consistency with the data (kindly provided by S. Scott).
Peacock et al. (2000) analysed the contribution of clustering of unresolved ( mJy) SCUBA sources to the 850 m background fluctuations detected in the Hubble Deep Field (HDF) North. They found some evidence for clustering of the background source population, consistent with an angular correlation function of the form , with and . Figure 2 presents our model predictions for the angular correlation function derived in the case of SCUBA galaxies with mJy; the redshift distribution spans the range .

Our results are fully consistent with the constraints on structure in the sub-millimetre background set by Peacock et al. (2000) and not far from their preferred clustering model (dotted line in Fig. 2), if . The shallower slope predicted by our model at small angles ( degrees) ultimately stems from the fact that at high we enter the regime of linear growth of density perturbations. This entails a flattening of the slope of the two-point spatial correlation function for . As a consequence, the angular correlation function obtained as in Eq. (1) by projecting over a wide range of redshifts, up to , will mirror this tendency to flatten out. Since a redshift range is also indicated by the analysis of Peacock et al. (2000), the adoption of a flatter slope for in their clustering analysis might have been more appropriate.
Strong clustering substantially enhances cell-to-cell fluctuations of the surface density of detected sources. The angular correlation function is in fact related to the second moment (variance) of the galaxy distribution function via the expression (Peebles 1980; Roche & Eales 1999)
| (3) |
where – mean count of sources in the solid angle – represents the Poisson noise arising from the discrete nature of the objects, and the normalised variance can be written as
| (4) |
In the case of square cells with , Eq. (4) can be expressed as the two-dimensional integral
| (5) |
with .
The quantity in Eq. (5) has been evaluated for the three cases of low-, intermediate- and high-mass SCUBA galaxies, introduced in this Section and based on the Granato et al. (2001) model, and for the usual two different values of the ratio. Results for the rms fluctuations relative to the mean number of detected sources per cell, [see Eq. (3)] are presented in Fig. 3, where dashed and dotted curves correspond, respectively, to sources brighter than 10 and 1 mJy. We have adopted a mean surface density per square degree of for a flux limit of 10 mJy, (see Scott et al. 2001), and of for a flux limit of 1 mJy (Granato et al. 2001). Fig. 3 clearly shows that the contributions due to clustering are generally larger than the Poisson contributions, shown by the two long-short dashed lines, and in some cases by a large factor. For surveys covering small areas of the sky the cell-to-cell fluctuations are large (up to ). We therefore conclude that the high clustering amplitude predicted for SCUBA sources can easily account for the differences found in the number counts observed in different sky regions by different groups (see e.g. Smail et al., 1997; Hughes et al., 1998; Blain et al., 1999b; Barger et al., 1999a; Eales et al., 2000; Scott et al., 2001).

3 Multi-wavelength analysis of the contribution of clustering to background fluctuations


The strong clustering of high-z forming spheroidal galaxies adds an important contribution to background fluctuations. Measurements of such a contribution can be informative on both the nature and the properties of sources below the detection limit. On the other hand, these fluctuations may have a significant impact on the detectability of Cosmic Microwave Background (CMB) fluctuations.
MA2001 (but see also Scott & White 1999 and Haiman & Knox 2000) estimated the power spectrum of clustering fluctuations at 850 m. In the present Section we will apply the same analysis to different wavelengths, corresponding to the effective frequencies of the channels of the High Frequency Instrument (HFI) of the Planck ESA mission: m 143 GHz; m 217 GHz; m 545 GHz; m 857 GHz. We will also work out predictions at m, the wavelength probed by the FIRBACK deep survey (Dole et al. 2001).
The counts of spheroidal galaxies are obtained from the model by Granato et al. (2001). The counts of spiral and of star-burst galaxies have been estimated by extrapolating to each considered wavelength the m local luminosity functions of the two populations, derived by Saunders et al. (1990), and evolving them in luminosity as , with in the case of starbursts and for spirals. The extrapolation in frequency has been carried out adopting the observed spectral energy distributions of NGC6946 and NGC6090, respectively in the case of spirals and star-burst galaxies.
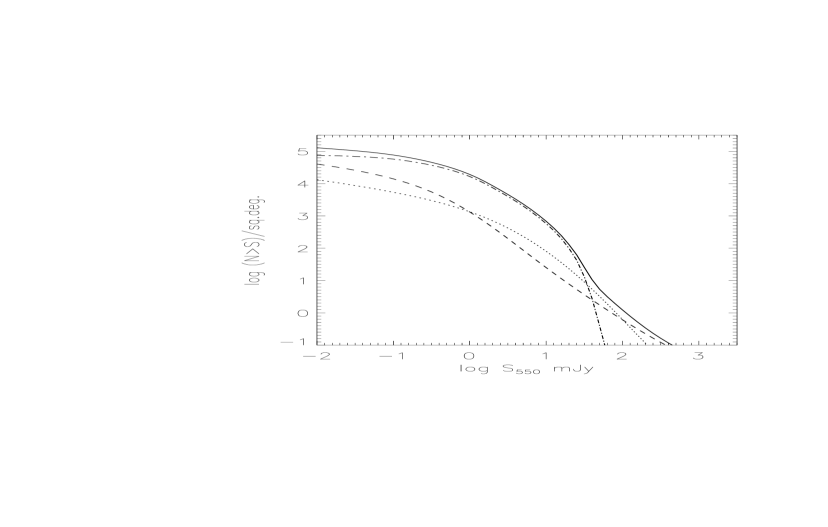
The contribution to the counts of forming spheroidal galaxies, when compared to the case for spirals and star-burst galaxies, is found to decrease with decreasing wavelength because of the increasingly less favourable K-corrections associated with the former population. Spirals and starbursts consequently become more and more important at shorter and shorter wavelengths, and eventually dominate the counts for m. This is illustrated by Fig. 4, where we show the contribution to the integral number counts (represented by the solid curves) of the three populations of spheroidal galaxies (dot-dashed lines), spirals (dashed lines) and starbursts (dotted lines) at different wavelengths.
Figure 4 shows that – under our assumptions – star-bursts and spirals constitute a negligible fraction of the total number of sources at mm/sub-mm wavelengths, the dominant contribution coming from high-z forming spheroidal galaxies (the same which – according to Granato et al. (2001) – show up as SCUBA sources at m), at all but very bright fluxes (with a flux threshold which varies with wavelength) where, as already discussed in the introduction and extensively discussed in Section 4, the number counts of spheroidal galaxies experience an exponential decline. The situation is reversed at 175 m (bottom right panel of Figure 4), where at all but very faint fluxes, spirals and star-bursts dominate the predicted number counts. In the following analysis we will therefore only consider the population of spheroidal galaxies when dealing with the mm/sub-mm wavelength range.
The angular correlation function of intensity fluctuations due to inhomogeneities in the space distribution of unresolved sources (i.e. with fluxes fainter than some threshold ), , can be expressed as the sum of two terms and , the first one due to Poisson noise (fluctuations given by randomly distributed objects), and the second one owing to source clustering (see MA2001 and De Zotti et al. 1996 for a detailed discussion). In the case of highly clustered sources such as forming spheroidal galaxies, the Poisson term is found (see e.g. Scott & White 1999) to be negligible when compared to . We can therefore safely assume , whose expression is given by
| (6) | |||||
with defined by Eq. (2), being the comoving radial coordinate, ( is introduced in Eq. (1) and is the speed of light), the redshift when the sources begin to shine and the redshift at which a source of luminosity is seen with a flux equal to the detection limit . The effective volume emissivity is expressed as:
| (7) |
being the luminosity function (per unit logarithmic luminosity interval), the K-correction and and respectively maximum and minimum local luminosity of the sources.
in Eq. (6) has been evaluated separately for the three cases of low-, intermediate- and high-mass objects, by plugging in Eq. (7) the appropriate luminosity functions (Granato et al. 2001). The total contribution of clustering to intensity fluctuations has then been derived by adding up all the values of obtained for the different mass intervals and by also taking into account the cross-correlation terms between objects of different masses, according to the expression (where we have dropped the index )
| (8) |
The angular power spectrum of the intensity fluctuations can then be obtained as
| (9) |
with
| (10) | |||||
which relates intensity and brightness temperature fluctuations.
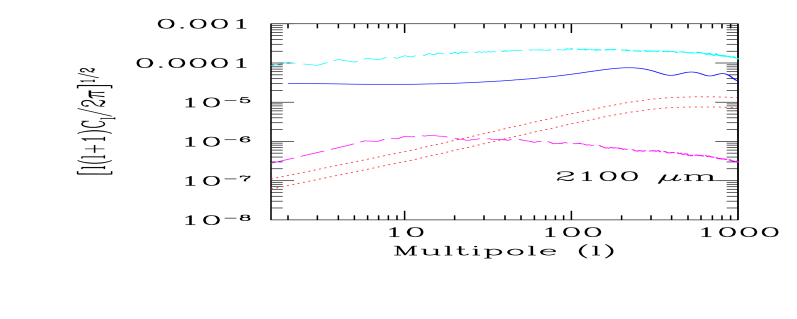
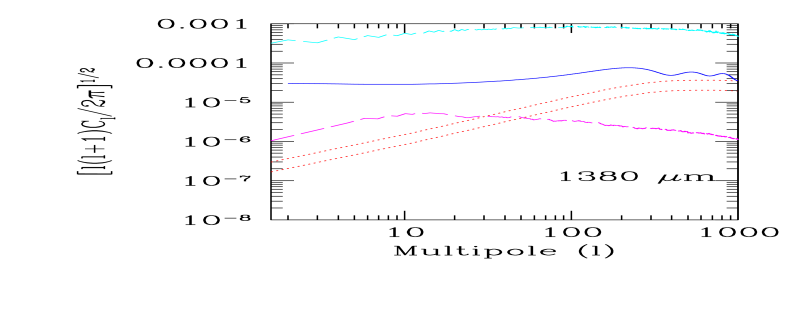
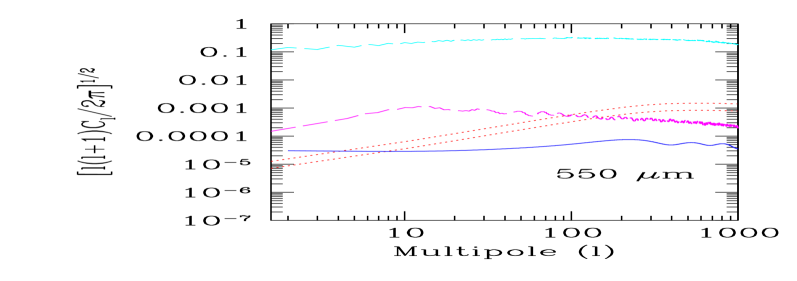
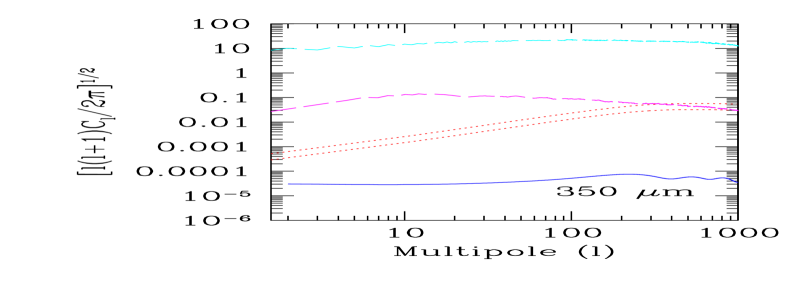
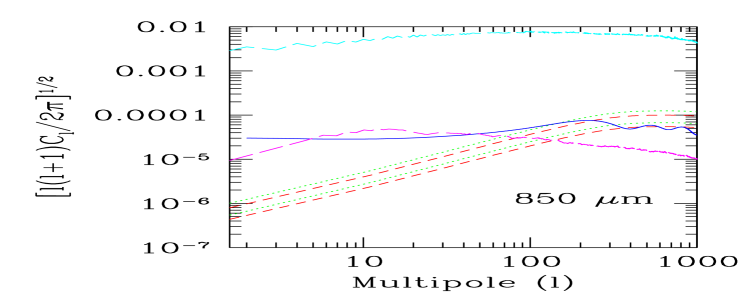
This analysis has been performed for the different central frequencies of the Planck HFI, and Figure 5 shows the results in terms of (in units of K) at 2100 m, 1380 m, 550 m and 350 m. In each of the four panels of Fig. 5, dotted curves are obtained by adopting the 5 detection limits of the different Planck channels ( mJy at 2100 m; mJy at 1380 m; mJy at 550 m; mJy at 350 m) estimated by Toffolatti et al. (1998). In Figure 6 we also plot predictions for temperature fluctuations at 850 m, where the contribution from star-forming spheroidals has been corrected for a mistake in MA2001. As in the former cases, dotted curves are obtained for a 5 detection limit of the relevant Planck channel, corresponding to mJy, while dashed ones illustrate the case for ten times higher sensitivity ().
The solid curves in Figs. 5 and 6 show, for comparison, the power spectrum of primary Cosmic Microwave Background (CMB) anisotropies corresponding to a flat CDM cosmology, calculated with the CMBFAST code developed by Seljak & Zaldarriaga (1996). The relative importance of fluctuations due to clustering rapidly increases with decreasing wavelength. CMB anisotropies on small angular scales are exceeded at wavelengths m. This high clustering signal mostly comes from massive galaxies with bright fluxes, which lie at substantial redshifts and are therefore highly biased tracers of the underlying mass distribution. Also the negative K-corrections increase their contribution to the effective volume emissivity [Eq. (7)] and therefore to the fluctuations.
This implies that important information on the clustering properties of faint sub-mm/far-IR galaxies (and hence on physical properties such as their mass and/or the amount of baryons involved in the star-formation process) will reside in the Planck maps at frequencies greater than 353 GHz where, however, the dominant signal is expected to come from interstellar dust emission.
In order to quantify this last effect, we have calculated the expected contribution of Galactic dust emission to background fluctuations. To this end, the dust emission maps constructed by Schlegel et al. (1998) by combining together IRAS and DIRBE data, have been extrapolated to all relevant frequencies assuming a grey-body spectrum with emissivity index and average dust temperature K.
Fig. 5 shows the power spectrum of Galactic dust emission averaged all over the sky (upper long-dashed curves). This signal dominates at all wavelengths due to contribution from the Galactic plane, highly contaminated by dust. Nevertheless, it is still possible to detect the clustering signal of sub-mm galaxies (and also recover the CMB power spectrum for m) if one restricts the analysis to high enough Galactic latitude regions (i.e. , lower long-dashed curves), which are least affected by dust emission.
It turns out that, both for m (see also Magliocchetti et al. 2001b) and m, the dust contribution in these regions becomes less important than the one due to the clustering of unresolved sources at any . For m the signal due to Galactic dust is instead found to hide all the other sources of background fluctuations at all Galactic latitudes, except possibly in the case of very high () multipoles.
Background fluctuations due to unresolved extragalactic sources have recently been measured by Lagache & Puget (2000) at m in a field covered by the FIRBACK survey with ISOPHOT (Dole et al. 2001).
As already discussed in this Section, the composition of counts at such relatively short wavelengths is substantially different from those considered so far because of the dominant presence of low-to-intermediate-redshift spiral and starburst galaxies. Calculations of the background fluctuations due to clustering of unresolved sources have then to take into account these two classes of sources, together with the population of spheroidal galaxies.
We use again Eqs. (6) and (7) but, when dealing with spiral and starburst galaxies, an important difference in the form of the the bias factor appearing in Eq. (6) has to be taken into account. In this case, in fact, assumes the form:
| (11) |
(Fry 1996), independent of the mass of the haloes hosting such sources and merely a function of redshift – via the linear growth rate – and of the local bias , where is the rms fluctuation amplitude in a sphere of radius 8 h-1Mpc as measured in the local universe for each population. As a consequence, no distinction between low-, intermediate- and high-mass objects is required.
The choice for a bias evolution of the form given by Eq. (11) stems from a number of results (see e.g. Baugh et al. 1999; Magliocchetti et al. 1999; Magliocchetti et al. 2000, to mention just a few) showing that bias models such as the one adopted for high-z forming spheroidal galaxies and illustrated by Eq. (2) do not provide a good fit for , where most spirals and star-burst galaxies with m fluxes lying within the range relevant to this work, are found.
We have estimated the amplitudes from the clustering properties by spectral type determined by Loveday, Tresse & Maddox (1999) from Stromlo-APM survey data. We find for galaxies with weak emission lines (spirals) and for galaxies with strong emission lines (starbursts). This leads to for spirals and to for starbursts, implying this latter population to be strongly anti-biased with respect to the underlying mass distribution.
The contribution of clustering to has then been calculated for the three populations of spheroidals, spirals and starbursts. The angular power-spectrum , in the units used by Lagache & Puget (2000) (Jy2 sr-1), has been derived according to the expression (see Peacock 1997):
| (12) |
where is the angular wavenumber and is the zero-th order Bessel function. The results for a detection limit mJy, corresponding to three times the confusion noise of the FIRBACK survey (Dole et al. 2001), are shown in Fig. 7, where the contribution of spheroidal galaxies is shown by the solid curves, while the dashed and dotted curves respectively show the predictions for spiral and starburst galaxies.
As expected, the contribution of spheroidal galaxies at this wavelength is negligible when compared to those originating from the clustering of both star-burst galaxies and spirals. Also, despite the strongly negative bias, the signal obtained for starbursts turns out to be stronger than the one predicted for spiral galaxies. This is due to the different evolutionary properties of the two populations, since no evolution is assumed for spiral galaxies, while strong evolution is instead allowed for in the case of starbursts (cf. beginning of this Section).
The short/long-dashed curve in Figure 7 represents the Poisson contribution Jy2/sr derived from the Guiderdoni et al. (1997) predictions, while the dashed-dotted curve illustrates the contribution to the observed power-spectrum of the Galactic cirrus (Lagache & Puget 2000). According to our predictions, one then has that fluctuations stemming from the clustering of starburst galaxies are detectable above other sources of signal, and this happens in the range of wavenumbers .
These findings, together with the predicted magnitude of the total (non-Poissonian) power spectrum for extragalactic sources (practically coincident with the dotted line in Figure 7) at 170 m, are fully consistent with the measurements of Lagache & Puget (2000). We therefore conclude that an excess of signal (with respect to Poisson fluctuations) due to clustering of unresolved/strongly evolving starburst galaxies, could possibly be discerned in the 170 m FIRBACK maps.

4 Gravitational Lensing


It is now well established (Franceschini et al. 1991, 1994, 2001; Blain & Longair 1993; Pearson & Rowan-Robinson 1996; Guiderdoni et al. 1997, 1998; Dwek et al. 1998; Blain et al. 1999b; Devriendt & Guiderdoni 2000; Pearson et al. 2001; Takeuchi et al. 2001; Rowan-Robinson 2001) that the coupling of the strongly negative K-correction at mm/sub-millimetre wavelengths – due to the steep increase with frequency of dust emission in galaxies – with the strong cosmological evolution demonstrated by both ISO and SCUBA data (Elbaz et al. 1999; Smail et al. 1997; Hughes et al. 1998; Barger et al. 1999a; Eales et al. 2000) and by the intensity of the far-IR background (Puget et al. 1996; Fixsen et al. 1998; Schlegel et al. 1998; Hauser et al. 1998; Lagache et al. 1999, 2000), greatly emphasises high-redshift sources. This yields very steep counts which maximise the magnification bias (Peacock 1982; Turner et al. 1984) and lead to a high probability for such sources to be gravitationally lensed (Peacock 1982; Turner et al. 1984). As already discussed by Blain (1996, 1997, 1998a,b, 1999, 2000), this corresponds to a fraction of lensed sources expected to show up in the mm/sub-millimetre band which is much larger than what is found in surveys at other wavelengths. For instance, Blain (1998a) predicts about 0.6 to 5% of the point sources observed in the future by the High Frequency Instrument (HFI) on board of the ESA satellite Planck to be lensed.
A distinctive feature of the astrophysically grounded model by Granato et al. (2001) is that both the lensing probability and the magnification bias at mm/sub-mm wavelengths are substantially higher than what other current, mostly phenomenological, models imply which also successfully account for SCUBA/MAMBO counts (Rowan-Robinson 2001; Takeuchi et al. 2001; Pearson et al. 2001; Blain et al. 1999b). This is because, according to this model, most galaxies detected in blank-field SCUBA and MAMBO surveys are interpreted as massive ellipticals at , in the process of building their stellar populations with very high star-formation rates (typically from a few hundreds to ). This leads to an extremely steep, essentially exponential, decline of the bright tail of mm/sub-mm counts of this galaxy population due to the fact that, in this model, dust emission from these objects rapidly fades away at when the bulk of their star formation is essentially over (Cohen 2001). The bright counts therefore somehow reflect the high luminosity tail of the luminosity function which, in turn, reflects to some extent the fact that, in the hierarchical clustering scenario, massive halos are exponentially rare at high redshifts. Such a steep decrease of the number counts for fluxes implies a large fraction of strongly lensed galaxies to appear at bright mm/sub-mm fluxes.
We recall here the main aspects of our model for gravitational lensing, referring to our previous work (Perrotta et al. 2001) for details. In the next Section we present quantitative predictions for the fraction of lensed spheroids to be compared with forthcoming observations.
Lensing statistics is expressed by the probability for a source at redshift to be lensed with magnification : it is obtained by dividing the total lensing cross section by the area of the source sphere as
| (13) | |||||
where is the comoving radial distance to redshift , is the proper volume element per unit redshift, and the comoving number density of the lenses. Since we are dealing with gravitational lensing by dark matter haloes, we assume that the lens distribution follows the Sheth & Tormen (1999) mass function
| (14) | |||||
where the best-fit values of the parameters for our cosmological model are , , and . is the mean mass density at a reference epoch , which we assume to be the present time, and is the variance of linear density fluctuations at the present epoch, smoothed with a spherical top-hat filter enclosing a mass . is the linear density contrast of an object virialising at , linearly evolved to the present epoch.
Quite independent of the lens model, decreases as for , hence the high magnification tail of the probability per unit magnification can be written as . Equation (14) assumes non-overlapping cross sections, which is satisfied in the regime, i.e. when no more than a single clump causes lensing of a background source: this results in magnifications markedly larger than 1, or strong lensing. Smaller magnifications, including de-magnifications, attain contributions from the distribution of dark matter along the entire line of sight, resulting in weak lensing effects. The latter case can be represented by a Gaussian probability per unit magnification:
| (15) |
where the location of the peak, , and the amplitude, , are determined by the normalisation and flux conservation conditions obtained by integrating over all possible magnifications the combined (weak plus strong lensing) probability distribution: . The transition between the weak and strong lensing regimes is set at a suitable magnification : a convenient choice is , yielding for the redshift range of interest.
The maximum magnification for strong lensing, , determined by the intrinsic size of the source (Peacock 1982) and by the geometry of the lens configuration was found to lie in the range 10-30 in the case of our model (Perrotta et al. 2001). Here we adopt the conservative value .
Lens density profiles have been modelled as Singular Isothermal Spheres (SIS) for masses , and with the Navarro, Frenk & White (1997; NFW) formula for larger masses. In fact, it is found that (Porciani & Madau 2000) such a “mixed” model provides a good fit to the observed statistics of the angular splitting of QSO multiple gravitational images. However we wish to emphasise that regarding statistical magnifications SIS and NFW profiles lead to comparable results (Perrotta et al. 2001), making the present conclusions very weakly dependent on the choice between SIS and NFW.
Before going to the results, let us consider the magnification bias on a flux-limited source sample. The integrated source counts above a flux density threshold of sources with a comoving luminosity function can be written as (e.g. De Zotti et al. 1996)
| (16) |
where is the comoving radial distance, and
| (17) |
The luminosity function modified by the magnification bias reads (e.g. Pei 1995):
| (18) |
Lensing effects on the source counts are taken into account by replacing with in Eq. (16).
5 Effect of gravitational lensing on source counts
We present here our estimates for the effect of lensing on integral number counts predicted using the model by Granato et al. (2001) and, for comparison, using the model by Rowan-Robinson (2001), taken as representative of the most successful phenomenological models. The model by Granato et al. (2001) includes three populations, namely spheroids, slowly-evolving starburst and evolving disk galaxies (spirals); the model by Rowan-Robinson instead includes AGN, spirals, high-luminosity and low-luminosity starburst. In both models, we added the contribution due to “flat”-spectrum radio sources, whose counts (kindly provided by L. Toffolatti) are based on the model by Toffolatti et al. (1998).
The contributions of different populations to the number counts at fluxes probed by SCUBA predicted by the two models are markedly different: while, as discussed above, according to Granato et al. (2001) SCUBA sources are mostly massive dusty spheroids at high , in the Rowan-Robinson (2001) model there is a large tail extending to low-. Correspondingly, while the model by Granato et al. (2001) predicts an essentially exponential decline of m counts with increasing flux density above a few mJy, the slope is substantially less steep in Rowan-Robinson’s (2001) model.
This different behaviour of the counts explains the vastly different fractions of lensed galaxies expected at bright fluxes, as quantified in Figs. 8 and 9, which show the integral number counts of lensed and unlensed galaxies, yielded by the two models, respectively, for the (top), (middle) and m (bottom) Planck/HFI channels. The heavy solid lines correspond to strongly gravitationally lensed sources (magnifications ). Note that, for the model of Granato et al. (2001), forming spheroids give the relevant contribution to lensed counts, due to their exponential slope in number counts: thus, the solid lines in Fig. 8 are given by the lensed spheroids, while starburst, spirals and radio sources are included only in the total counts (sum of weakly and strongly lensed sources), represented in Fig. 8 by the heavy dotted lines.
In the case of Rowan-Robinson (2001) all classes of sources (AGN, spirals and starburst) are taken into account in the strongly-lensed counts of Fig. 9 (solid lines). The heavy dashed lines show the counts for these classes of sources, obtained by only allowing for weak lensing (magnifications and de-magnifications), while the thin dotted lines (almost coincident with the heavy dashed lines in the case of Rowan-Robinson 2001) show the counts computed if one ignores the effect of lensing. Finally, the heavy dotted lines give the sum of weakly and strongly lensed sources, also added with the contribution of radio sources, for which the effect of lensing is negligible.
It is clear from Fig. 8 that, according to the model by Granato et al. (2001) and thanks to the strong magnifications by gravitational lensing, even faint forming spheroids at substantial redshifts can be detected in relatively shallow surveys, such as those provided by Planck/HFI. The quoted detection limits for this instrument are mJy at 1380,850,550 m, respectively. Note that, at 850 m, this implies that the expected strongly lensed objects at fluxes larger than on the whole sky are in the Rowan Robinson scenario (2001) and in the model by Granato et al. (2001). Strongly lensed forming spheroids may also be detectable by forthcoming balloon experiments operating at sub-mm wavelengths, such as BLAST (Devlin et al. 2000; www.hep.upenn.edu/blast/) and ELISA. Such surveys may then trace the large scale distribution of the peaks of the primordial density field.
Note that the distribution of strongly lensed sources would extend to even higher fluxes in the case of magnifications larger than our conservative limit (magnifications of up to 30 are possible according to the adopted model; cf. Perrotta et al. 2001).
Fig. (10) compares the fraction of lensed to unlensed sources as a function of 850 m flux predicted by the two models considered above. According to the model by Granato et al. (2001), at m the ratio of strongly lensed to unlensed sources reaches the value of about 40% for fluxes slightly below mJy, where the surface density of strongly lensed sources is of about . On the other hand, the fraction of strongly lensed sources is always below 10% for the model of Rowan-Robinson (2001). It is then clear that gravitational lensing can help to discriminate different models, all of them successfully reproducing the observed counts.
In principle, clustered lenses can change the clustering properties of the sources in a flux-limited sample. The auto-correlation function of the lensing magnification pattern can be described as a convolution of the magnification pattern of a single lens with the correlation function of the lens centres. In our case, the magnification patterns of individual lenses have typical angular scales of at most a few arc seconds. The auto-correlation of lens centres, however, has a typical angular scale of arc minutes, and its amplitude is substantially lowered by projection because the lens population is taken from a large redshift range. Therefore, the effect of lensing on the clustering properties of sub-mm sources is negligible.
6 Conclusions
A major challenge for current theories of galaxy formation is to account for the evolutionary history of large spheroidal galaxies. Even the best semi-analytic models (Cole et al. 2000; Devriendt & Guiderdoni 2000) hinging upon the “standard” picture for structure formation in the framework of the hierarchical clustering paradigm, tuned to agree with detailed numerical simulations, are stubbornly unable to account for the sub-mm counts of galaxies as well for the (somewhat still controversial) optical evidence for most large ellipticals we see today were already in place at and (almost) passively evolving since then (Daddi et al. 2000; Cohen 2001). These data are more consistent with the traditional approach whereby elliptical galaxies form most of their stars in a single gigantic star-burst followed by essentially passive evolution (“monolithic” models). This approach, however, is inadequate to the extent that it cannot be fitted in a consistent scenario for structure formation from primordial density fluctuations.
A possible way out was proposed by Granato et al. (2001) who worked out a physically motivated scheme according to which the mm/sub-mm galaxies detected by SCUBA and MAMBO surveys are large proto-ellipticals in the process of forming most of their stars and of growing a quasar at their centres. In their model, the early evolution of these galaxies and of quasars are tightly inter-related and feed-back effects (mostly due to supernova explosions) make large ellipticals to form as soon as the corresponding potential wells are in place, while the formation of smaller galaxies is delayed. Therefore, in this model, large ellipticals evolve essentially as predicted by “monolithic” models and the mm/sub-mm counts are successfully reproduced. The star-formation activity, powering the dust emission, quickly declines for for the most luminous (most massive) galaxies, while quasars reach their maximum luminosity. This naturally explains why very luminous quasars are more easily detected at mm/sub-mm wavelengths at redshifts larger than that () of maximum quasar activity (Omont et al. 2001). As indicated by the analysis of the latter authors, a substantial fraction of the observed far-IR emission is probably powered by the starburst in the host galaxy.
In this paper predictions of the model are extensively investigated and compared with recent data. Attention is focused, in particular, on two specific aspects. Since SCUBA/MAMBO galaxies are interpreted as massive galaxies at , they are expected to be highly biased tracers of the matter distribution and therefore highly clustered. The implied angular correlation function is found to be consistent with recent results by Scott et al. (2001), Peacock et al. (2000), Lagache & Puget (2000) as well as with the fluctuations in the SCUBA counts in different areas of the sky. Explicit estimates are presented for the power spectrum of temperature fluctuations due to clustering in Planck/HFI channels.
A second specific prediction of the model is an essentially exponential decline of the counts at mJy. Hints in this direction that can possibly be discerned in recent SCUBA (Scott et al. 2001; Borys et al. 2001) and MAMBO (Carilli et al. 2000) surveys are noted. As an implication of this prediction, together with the fact that sources are found at high redshifts, one has that both the gravitational lensing probability and the magnification bias on the counts are much higher than those derived for other current, phenomenological, models. We show that, according to this model, essentially all proto-spheroidal galaxies brighter than –70 mJy are gravitationally lensed. Allowing for the other populations of sources contributing to the bright mm/sub-mm counts, we find that the fraction of gravitationally lensed sources may be at fluxes slightly below mJy. If so, large area surveys such as those to be carried out by Planck/HFI or by forthcoming balloon experiment like BLAST and ELISA will probe the large scale distribution of the peaks of the primordial density field.
Acknowledgements We are grateful to P. Panuzzo and L. Toffolatti for help with the counts of spheroidal galaxies and radio sources, respectively. Work supported in part by ASI, MURST and UE.
References
- [1]
- [] Almaini O. et al., 2001, astro-ph/0108400
- [] Barger A.J., Cowie L.L., Sanders D.B., Taniguchi Y., 1998, Nat 394, 248
- [] Barger A.J., Cowie L.L., Sanders D.B., 1999a, ApJ 518, L5
- [] Barger A.J., Cowie L.L., Trentham N., Fulton E., Hu E.M., Songaila A., Hall D., 1999b, AJ 117, 102
- [] Baugh C.M., Cole S., Frenk C.S., Lacey C.G., 1998, ApJ 498, 504
- [] Baugh C.M., Benson A.J., Cole S., Frenk C.S., Lacey C.G., 1999, MNRAS, 305, 21
- [] Bertoldi F., Menten K.M., Kreysa E., Carilli C.L., Owen F., 2001, astro-ph/0010553
- [] Benitez N., Broadhurst T.J., Bouwens R.J., Silk J., Rosati P., 1999, ApJ 515, L65
- [] Bertoldi F. et al., 2000, A&A 360, 92
- [] Blain A. W., 1996, MNRAS, 283, 1340
- [] Blain A. W., 1997, MNRAS 290, 553
- [] Blain A.W., 1998a, MNRAS 295, 92
- [] Blain A.W., 1998b, MNRAS 297, 511
- [] Blain A.W., 1999, MNRAS 304, 669
- [] Blain A.W., 2000, in Cosmological Physics with Gravitational Lensing, Kneib J.-P., Mellier Y., Moniez M., Tran Thanh Van J. eds., Rencontres de Moriond XX, ed. Frontières, Gif sur Yvette, astro-ph/0007196
- [] Blain A.W., Jameson A., Smail I., Longair M.S., Kneib J.-P., Ivison R.J., 1999a, MNRAS 309, 715
- [] Blain A. W., Longair M. S., 1993, MNRAS 264, 509
- [] Blain A.W., Smail I., Ivison R.J., Kneib J.-P., 1999b, MNRAS 302, 632
- [] Borys C., Chapman S., Halpern M., Scott D., 2001, astro-ph/0107515
- [] Broadhurst T.J., Bowens R.J., 2000, ApJ 530, 53
- [] Carilli C.L., Bertoldi F., Bertarini A., Menten K.M., Kreysa E., Zylka R., Owen F., Yun M., 2000, in Deep Millimeter Surveys: Implications for Galaxy Formation, eds. J. Lowenthal & D.K. Hughes, World Scientific, in press, astro-ph/0009298
- [] Cohen J.G., 2001, AJ 121, 2895
- [] Cole S., Lacey C.G., Baugh C.M., Carlton M., Frenk C.S., 2000, MNRAS 319, 168
- [] Daddi E., Cimatti A., Renzini A., 2000, A&A 362, L45
- [] Devlin M.J. and the BLAST collaboration, 2000, astro-ph/0012327
- [] Devriendt J.E.G., Guiderdoni B., 2000, A&A 363, 851
- [] De Zotti G., Franceschini A., Toffolatti L., Mazzei P., Danese L., 1996, Ap. Lett.Comm., 35, 289
- [] Dole H. et al., 2001, A&A 372, 364
- [] Dunlop J.S., 2000, in Deep Millimeter Surveys: Implications for Galaxy Formation, eds. J. Lowenthal & D.K. Hughes, World Scientific, in press, astro-ph/0011077
- [] Dwek E., et al., 1998, ApJ 508, 106
- [] Eales S., Lilly S., Gear W., Dunne L., Bond J.R., Hammer F., Le Fèvre O., Crampton D., 1999, ApJ 515, 518
- [] Eales S. et al., 2000, AJ 120, 224
- [] Elbaz D. et al., 1999, A& A 351, L37
- [] Fixsen D.J. et al., 1998, ApJ 508, 123
- [] Fox M.J. et al., 2001, astro-ph/0107585
- [] Franceschini A., Aussel H., Cesarsky C.J., Elbaz D., Fadda D., 2001, A&A, submitted, astro-ph/0108292
- [] Franceschini A., De Zotti G., Toffolatti L., Mazzei P., Danese L., 1991, A&AS 89, 285
- [] Franceschini A., Silva L., Fasano G., Granato G.L., Bressan A., Arnouts S., Danese L., 1998, ApJ 506, 600
- [] Franceschini A., Mazzei P., De Zotti G., Danese L., 1994, ApJ 427, 140
- [] Fry J.N., 1996, ApJ, 461, L65
- [] Giavalisco M., Steidel C.C., Adelberger K.L., Dickinson M.E., Pettini M., Kellogg M., 1998, ApJ, 503, 543
- [] Granato G.L., Lacey C.G., Silva L., Bressan A., Baugh C.M., Cole S., Frenk C.S., 2000, ApJ 542, 710
- [] Granato G.L., Silva L., Monaco P., Panuzzo P., Salucci P., De Zotti G., Danese L., 2001, MNRAS 324, 757
- [] Guiderdoni B., Bouchet F.R., Puget J.L., Lagache G., Hivon E., 1997, Nat 390, 257
- [] Guiderdoni B., Hivon E., Bouchet F.R., Maffei B., 1998, MNRAS 295, 877
- [] Haiman Z., Knox L., 2000, ApJ, 530, 124
- [] Hauser M.G. et al., 1998, ApJ 508, 25
- [] Hughes D.K. et al., 1998, Nat 394, 241
- [] Jing Y.P., 1998, ApJ, 503, L9
- [] Kauffmann G., 1996, MNRAS 281, 487
- [] Kauffmann G., Charlot S., White S.D.M., 1996, MNRAS 283, 117
- [] Lagache G. et al., 1999, A& A 344, 322
- [] Lagache G. et al., 2000, A& A 354, 247
- [] Lagache G. & Puget J.L., 2000, A& A, 355, 17
- [] Loveday J., Tresse L. & Maddox S.J., 1999, MNRAS, 310,281
- [] Magliocchetti M., Maddox S.J., Lahav O., Wall J.V., 1999, MNRAS, 309, 943
- [] Magliocchetti, M., Bagla, J., Maddox, S.J., Lahav, O. 2000, MNRAS 314, 546
- [] Magliocchetti, M., Moscardini, L., Panuzzo, P., Granato, G.L., De Zotti, G., Danese, L. 2001a, MNRAS, 325, 1553
- [] Magliocchetti M., Moscardini L., De Zotti G., Granato G.L., Danese L., 2001b, proceedings of the conference “Where’s the Matter? Tracing Dark and Bright Matter with the New Generation of Large Scale Surveys”, June 2001, Treyer & Tresse Eds, Frontier Group, astro-ph/0107597
- [] Marinoni C., Hudson M.J., 2001, ApJ, submitted (astro-ph/0109134)
- [] McKay T.A. et al., 2001, astro-ph/0108013
- [] Moscardini L., Coles P., Lucchin F., Matarrese S., 1998, MNRAS, 299, 95
- [] Menanteau F., Ellis R.S., Abraham R.G., Barger A.J., Cowie L.L., 1999, MNRAS 309, 208
- [] Navarro J.F., Frenk C.S., White S.D.M., 1997, ApJ 490, 493
- [] Omont A., Cox P., Bertoldi F., McMahon R.G., Carilli C., Isaak K.G., 2001, A&A 374, 371
- [] Peacock J. A., 1982, MNRAS 199, 987
- [] Peacock J.A., 1997, Cosmological Physics, Cambridge University Press
- [] Peacock J.A., Dodds S.J., 1996, MNRAS, 267, 1020
- [] Peacock J.A., et al., 2000, MNRAS, 318, 535
- [] Pearson C.P., Matsuhara H., Onaka T., Watarai H., Matsumoto T., 2001, MNRAS 324, 999
- [] Pearson C.P., Rowan-Robinson M., 1996, MNRAS 283, 174
- [] Peebles P.J.E., 1980, The Large-Scale Structure of the Universe, Princeton University Press
- [] Peebles P.J.E., 1993, Principles of Physical Cosmology, Princeton University Press
- [] Pei Y.C., 1995, ApJ 440, 485
- [] Perrotta F., Baccigalupi C., Bartelmann M., De Zotti G., Granato G.L. 2001, to appear in MNRAS
- [] Porciani C., Madau P., 2000, ApJ 532, 679
- [] Press W.H., Schechter P., 1974, ApJ, 187, 425
- [] Puget J.L. et al. 1996, A& A 308, L5
- [] Roche N. & Eales S.A., 1999, MNRAS, 307, 703
- [] Rodighiero G., Franceschini A., Fasano G., 2001, MNRAS 324, 491
- [] Rowan-Robinson M., 2001, ApJ 549, 745
- [] Saunders W., Rowan-Robinson M., Lawrence A., Efstathiou G., Kaiser N., Ellis R.S., Frenk C.S., 1990, MNRAS 242, 318
- [] Schlegel D.J., Finkbeiner D.P. & Davies M., 1998, ApJ 500, 525
- [] Scodeggio M., Silva D., 2000, A&A 359, 953
- [] Scott D., White M., 1999, A&A, 346, 1
- [] Scott, S.E., et al., 2001, astro-ph/0107446
- [] Seljak U., Zaldarriaga M., 1996, ApJ, 469, 437.
- [] Sheth R. K., Tormen G., 1999, MNRAS, 308, 119
- [] Silva L., Granato G.L., Bressan A., Danese L., 1998, ApJ 509, 103
- [] Smail I., Ivison R.J., Blain A.W., 1997, ApJ 490, L5
- [] Smail I., Ivison R., Blain A., Kneib J.-P., 2000, in Deep Millimeter Surveys: Implications for Galaxy Formation, eds. J. Lowenthal & D.K. Hughes, World Scientific, in press, astro-ph/0008237
- [] Takeuchi T.T., Kawabe R., Kohno K., Nakanishi K., Ishii T.T., Hirashita H., Yoshikawa K., 2001, PASP 113, 586
- [] Toffolatti L., Argueso Gomez F., De Zotti G., Mazzei P., Franceschini A., Danese L., Burigana C., 1998, MNRAS, 297, 117
- [] Totani T., Yoshii J., 1997, ApJ 501, L177
- [] Treu T., Stiavelli M., 1999, ApJ 524, L27
- [] Turner E.L., Ostriker J.P., Gott J.R., 1984, ApJ 284, 1
- [] Zepf S.E., 1997, Nat 390, 377