CO Observations of the Interacting Galaxy Pair NGC 5394/95
Abstract
BIMA 12CO observations are presented of the spiral galaxies NGC 5394 and NGC 5395 that have undergone a recent, grazing encounter. In NGC 5394, approximately 80% of the CO emission detected by BIMA is concentrated in the central 800 pc (FWHM) starburst region, and the rest is from a portion of the inner disk south and west of the central starburst. In an encounter simulation that reproduces some of the main features of this galaxy pair, a considerable amount of gas in NGC 5394 falls into the central region early in the collision. The observed total gas distribution in the disk of NGC 5394 is lopsided, with more HI, CO, and H emission coming from the western or southwestern side. The innermost western arm of NGC 5394 is seen in CO and H emission, but the eastern inner–disk arm, which is very bright in the optical continuum, is not detected in CO or H emission.
The NGC 5394 starburst region is similar in radio continuum luminosity and size to the M82 starburst and has a CO luminosity times greater. A CO position–velocity diagram of the NGC 5394 nucleus reveals two separate velocity features very close to the center. This may indicate a nuclear ring or the “twin peaks” of an ILR or some depletion of 12CO at the nucleus. From a comparison of the radio continuum, H, 60 µm, and CO luminosities, we estimate that the average extinction of the starburst nucleus is 3 – 4 mag, the star formation rate is M⊙ per year, and the conversion factor in the starburst is a factor of 3 – 4 below the standard value. Comparison of NGC 5394 with two other systems previously studied suggests that in prograde grazing encounters a central starburst may not develop until near the end of the ocular phase.
Very little of the CO emission from NGC 5395 found in previous single–dish observations is detected in the BIMA data; thus molecular gas in NGC 5395 does not appear to be strongly concentrated in compressed ridges.
1 Introduction
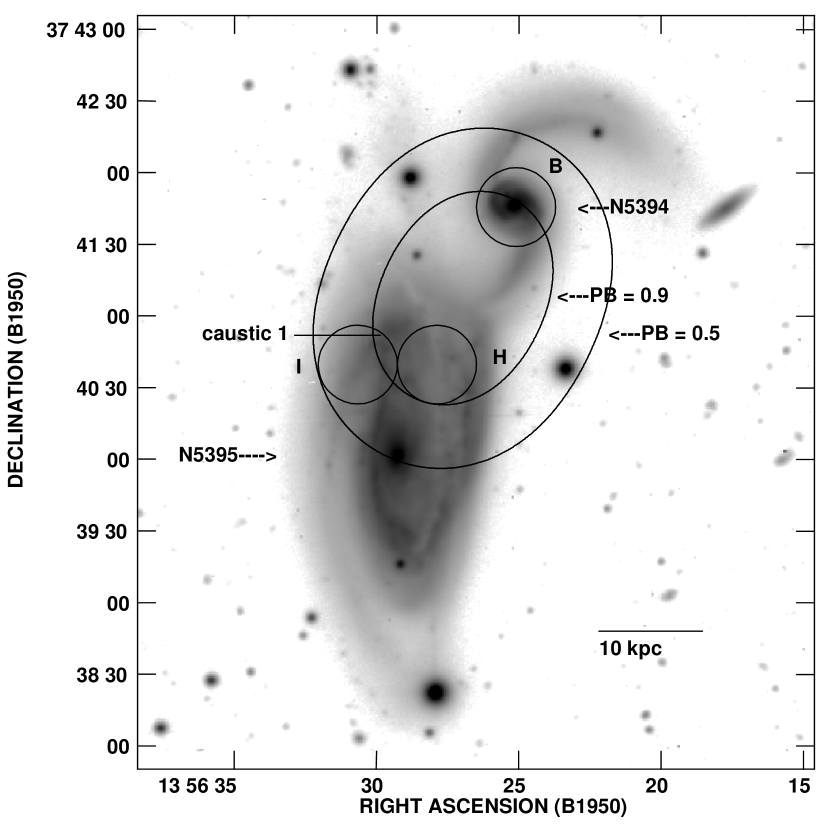
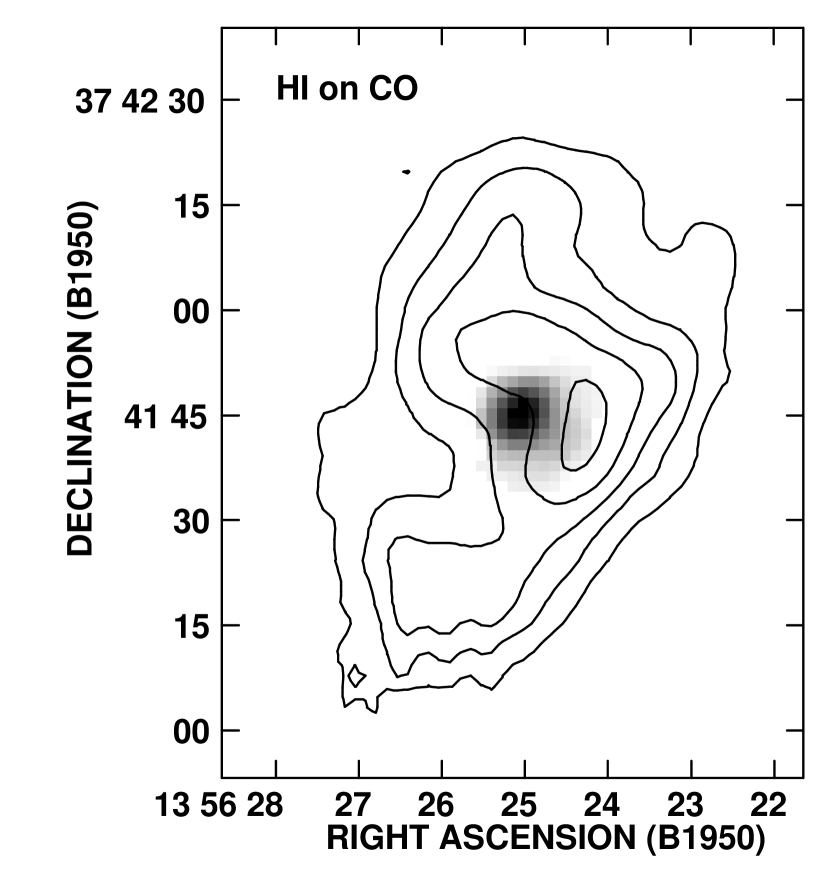
The interacting spiral galaxies NGC 5394/95 (Arp 84) at a distance of 47 Mpc have recently undergone a nearly grazing encounter. Figure 1 displays an –band image of the system from the Chengalur–Nordgren galaxy survey (Nordgren et al., 1997). From a comparison of the observed tidal features of the system with galaxy encounter simulations, Kaufman et al. (1999a) (hereafter Paper I) concluded that NGC 5394, the smaller member of the pair, suffered a close prograde collision with NGC 5395 and is in an immediate post–ocular (post eye-shaped) phase. NGC 5394 has a central starburst, 35 (= 800 pc) in diameter, very bright inner-disk spiral arms ( = 0.9 – 3.0 kpc from the nucleus), and two long, open tidal arms, with the tidal tail extending to . Its disk is intrinsically oval. Some properties of NGC 5394 are listed in Table 1. The dominant spiral arm of its companion, NGC 5395, forms a large ring or pseudo-ring of H, radio continuum, and HI emission. The eastern half of the ring is the brighter side in radio continuum and H, whereas the western half is the brighter side in HI.
NGC 5394/95 is one of three galaxy pairs that we have studied previously with radio, optical, and single–dish CO observations and numerical simulations to see how structures resulting from prograde, in–plane, grazing encounters develop. The other two systems are IC 2163/NGC 2207 (Elmegreen et al., 1995a, b, 2000, 2001) and NGC 2535/36 (Kaufman et al., 1997). In the models, the response of the galaxy disk to the tidal potential of the prograde encounter produces an eye–shaped (“ocular”) oval like that seen in IC 2163 and NGC 2535. This can subsequently evolve into inner–disk arms, similar to those visible in NGC 5394. From a comparison of the observed morphologies with the models, Paper I concluded that the galaxies IC 2163, NGC 2535, and NGC 5394 form an “age” sequence with IC 2163 the least evolved interaction and NGC 5394, the most evolved one. IC 2163 has star formation typical of normal spiral disks (Elmegreen et al., 2001), NGC 2535 has somewhat enhanced star formation (Bernlöhr, 1993) with the brightest H emission at the two ends of the eye–shaped oval (Amram et al., 1989), and NGC 5394 has a central starburst.
We present 12CO observations of NGC 5394/95 taken with the Berkeley–Illinois–Maryland Association (BIMA)111The BIMA array is partially funded by grant AST–9981289 from the National Science Foundation array to examine the distribution of molecular gas, particularly in the inner–disk arms and starburst nucleus of NGC 5394 and in the ring/pseudo-ring of NGC 5395.
The inner–disk arms of NGC 5394 present a puzzle for models of star formation. These bright arms are mostly free of star-formation knots (Arp, 1969; Wray, 1988), and only one of the three arms is clearly detected in H (Paper I). This is unusual, since high surface brightness in a spiral arm is almost always the result of ongoing star formation. Wray (1988) described these arms as extremely bright spiral arcs that are “mostly smooth and green.” Despite the presence of HI gas, two of these arms show no evidence of star formation in progress. Paper I offered the following interpretation. If molecular gas can be ignored, the instability parameter , which is too high for significant star formation; Kennicutt (1989) and Martin & Kennicutt (2001) found that for star–forming regions in late–type spirals. A value for based simply on HI may be too high if a significant amount of molecular gas, which can lower the value of , is present. Thus we needed to measure the molecular surface density at the inner–disk arms of NGC 5394. Single–dish observations with the NRAO 12–m telescope at a resolution of (Zhu et al., 1999) and with Onsala Space Observatory at a resolution of (Paper I) detected significant CO emission from NGC 5394. In particular, the Onsala observations found a lot of 12CO emission (129 Jy km s-1) in the field containing the starburst nucleus and the inner–disk spiral arms but did not have sufficient spatial resolution to distinguish between emission from the nuclear region and that from the inner–disk arms (Paper I). The 5 times higher resolution () of the BIMA 12CO observations presented here allows us to make this distinction.
Optical spectroscopy by Arp (1969) and Leech et al. (1989) and near–infrared spectroscopy by Vanzi, Alonso–Herrero, & Rieke (1998) revealed a young starburst in the center in NGC 5394. The position of NGC 5394 in the near–infrared line–ratio diagnostic diagrams indicates a starburst of duration a few Myr, observed several Myr after the peak star–formation episode. The starburst in NGC 5394 has nearly the same radio continuum luminosity and linear size as the central starburst in M82 (Paper I; Condon et al. (1990)). Unlike M82, NGC 5394 is viewed nearly face–on. The H line profile at the nucleus of NGC 5394 has a 100 km s-1 velocity asymmetry (an extended blue wing), which may represent a wind/outflow of ionized gas perpendicular to the disk (Paper I). In the M82 starburst, an outflow speed of several hundred km s-1 is seen in the molecular gas (Shen & Lo, 1995) as well as in the ionized gas. Our BIMA observations of NGC 5394, particularly the velocity data, provide information about the structure of the starburst region in NGC 5394 and the relative spatial distributions of 12CO and H emission.
For the “standard” value of the Milky Way conversion factor , we adopt H2 cm-2 (K km s-1)-1 from Strong et al. (1988) since this value has been widely used. More recent determinations for the Milky Way give somewhat lower values of (Strong & Mattox, 1996), and (Dame, Hartmann, & Thaddeus,, 2001). We shall estimate the value of for the starburst region of NGC 5394 by comparing its radio continuum, H, 60 µm, and CO luminosities. For luminous infrared galaxies involved in mergers, measurements of the dynamical mass (Alonso–Herrero et al., 2001; Shier, Rieke, & Rieke, 1994) and estimates of the molecular mass based on millimeter–wave thermal emission of dust (Braine & Dumke, 1998) indicate that the standard value of overestimates the molecular mass by factors ranging from 3 to greater than 10 in these powerful starbursts. The starburst in NGC 5394 is more modest, comparable to that in M82. Wild et al. (1992) and Smith et al. (1991) found that the value of in the M82 starburst is a factor of 3 below the standard value.
The northern half of NGC 5395 was included as well in our BIMA observations.
12CO emission from NGC 5395 was detected in the Onsala observations
(Paper I) and in the NRAO 12–m observations by Zhu et al. (1999).
In other galaxies, nonthermal radio continuum emission
and 12CO emission are usually correlated on scales of kpc
(Adler, Allen, & Lo, 1991).
Since the eastern half of the ring/pseudo–ring in NGC 5395 is the brighter
side in radio continuum emission but the fainter side in HI,
we wanted to find out if the eastern half of the ring is the brighter
side in CO emission. We expected
to see a strong shock front in the molecular gas along the radio continuum
ridge. We also looked for any CO emission associated
with an unusual “shell–like” stellar structure on the northeastern side
(marked as “caustic 1” in Fig. 1), which was
interpreted in Paper I as a caustic produced by temporary
convergence of orbits.
In addition to the BIMA CO data, our analysis uses HI, Fabry–Perot H, radio continuum, single–dish CO, and broad–band near-infrared and optical observations from Paper I and the VLA radio continuum image from the FIRST survey (Becker, White, & Helfand, 1995).
With the adopted distance of 47 Mpc for the galaxy pair, corresponds to 230 pc. The velocities in this paper are heliocentric and use the optical definition for the nonrelativistic Doppler shift.222Where necessary, the relation = + 28 km s-1 was used to convert velocities to the heliocentric, optical system. Recall that the optical definition is = , where is the rest wavelength.
Section 2 describes the observations and the data reduction. Section 3 describes the optical and near–infrared morphology of NGC 5394. Sections 4, 5, 6, and 7 present our CO results on NGC 5394, with the general CO distribution in Section 4, the eastern inner–disk arm in Section 5, the central starburst in Section 6, and a comparison of CO, H, and HI velocity fields in Section 7. Section 8 discusses the implications for development of a starburst in a nonmerging encounter of this type. Section 9 discusses NGC 5395. Section 10 contains our conclusions.
2 Observations and Data Reduction
The BIMA 12CO observations were made on 1999 June 4 with 10 telescopes in C configuration. We used two pointings to cover NGC 5394 and the northern half of NGC 5395. The duration of the run was 10.7 hours. Table 2 gives a summary of the observations. The phase calibrator was the quasar 1310+323, the bandpass calibrator was 3C 273, and the absolute flux standard was Mars. The observations have a velocity resolution of 4.06 km s-1 and were centered on 3497 km s-1 with a total bandwidth of 908 km s-1.
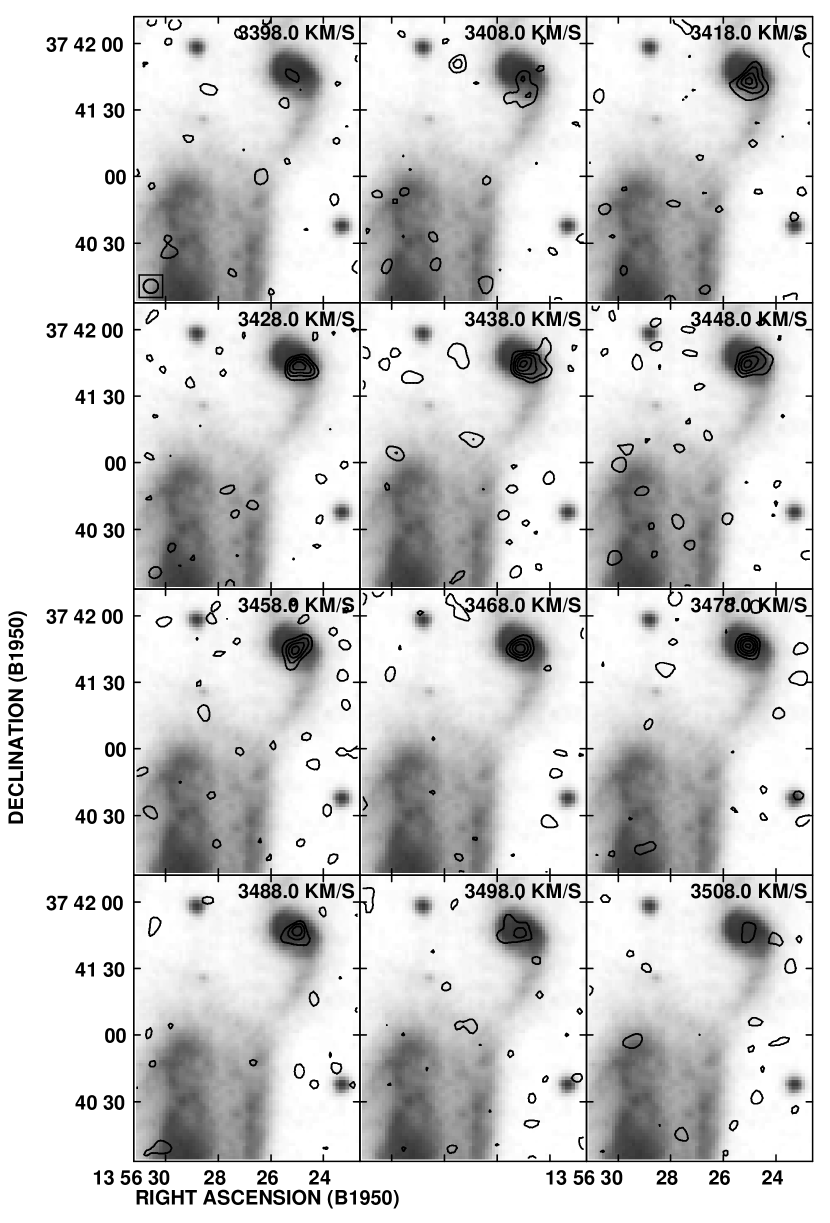
The data reduction was carried out using standard reduction algorithms from the MIRIAD package (Sault, Teuben, & Wright, 1995). The data were Hanning smoothed to 10 km s-1 channels. The two pointings were mosaiced to form a single cube with pixel size = , synthesized beam = , and dimensions pixels (R.A. DEC velocity), covering the velocity range 3208 to 3808 km s-1. The dirty channel maps were then deconvolved by using the Steer–Dewdney–Ito CLEAN algorithm (Steer, Dewdney, & Ito, 1984). The rms noise in the cleaned 10 km s-1 channel maps is 80 mJy beam-1, only slightly higher than the theoretical noise of 76 mJy beam-1. In Fig. 1, the 50% and 90% sensitivity contours of the combined primary beams after mosaicking the data are overlaid on the -band image in grayscale. Figure 2 displays channel maps from the BIMA CO cube overlaid on a gray–scale display of the Digitized Sky Survey image333The POSS Digitized Sky Survey was produced at the Space Telescope Science Institute under grant NAG W-2166. for the range of velocities appropriate to NGC 5394. Moment maps of the total emission and of the intensity–weighted velocity field were made from this cube.
Areas of genuine CO emission were selected by clipping at the rms noise in a cube convolved to resolution and requiring that a feature be continuous in velocity in at least two adjacent channels. In NGC 5394, the only 12CO emission seen in the BIMA observations is from the central and southwestern half of the Onsala position B marked in Fig. 1, that is, only from the central part of the galaxy. The CO emission from NGC 5394 is present over the velocity range 3388 to 3528 km s-1, and the peak brightness temperature in the channel maps is 2.05 K (after correction for primary beam attentuation). BIMA finds very little CO emission from NGC 5395; a small region inside the arc formed by the stellar caustic has a peak of 0.87 K (= the rms noise) at km s-1.
3 Optical and Infrared Morphology of NGC 5394
NGC 5394 has . On the basis of the HI velocity field, the observed value of , and the –band luminosity, Paper I concluded that NGC 5394 is viewed nearly face–on with its major axis of projection into the sky–plane at a position angle of 0∘. The stellar disk of NGC 5394 is intrinsically oval as a result of the encounter. In the sky–plane, the position angle of the photometric major axis varies continuously from 60∘ to –6∘, and the ellipticity increases from 0.21 to 0.60 (Paper I) as the galactocentric distance increases from (the start of the tidal arms) to (the isophotal major radius measured by de Vaucouleurs et al. (1991)). Ignoring the small difference at between the position angles of the photometric major axis and the projection line of nodes, the area of the face–on disk at the 25th magnitude isophote = = , where are the semi–major and semi–minor axes in the sky–plane and are the face–on values. For comparisons with other galaxies, as in Section 8 below, we take the effective value of as = . With inclination = 15∘ and = 0.4, this gives = 7.6 kpc.
NGC 5394 has two long, open tidal arms (see Fig. 1) with high arm–interarm contrast (Paper I). The very bright inner–disk spiral arms are disjoint from the long outer tidal arms, as the latter depart from the side of the inner–disk arms at a large angle. The top panel of Figure 3 is a sketch of features visible in the inner disk and center of NGC 5394. The eastern inner–disk arm spirals outwards for 210∘ in a clockwise direction, starting at at a position angle of 200∘ and ending at . The western inner–disk arm spirals outward from at a position angle of 30∘ and appears to bifurcate at a position angle of –50∘ into what we call the two western inner–disk arms. The outer of the two western inner–disk arms is symmetric to the eastern inner–disk arm, whereas the innermost western arm seems to be a separate structure. There is no evidence of on–going star formation in either the eastern or the outer of the two western inner–disk arms. H emission is detected from the innermost western arm (Paper I).
There is a barlike structure (see Fig. 3, top panel) with a major axis of (= 3.7 kpc) at a position angle of 120∘ (Paper I; Bushouse & Stanford (1992)). We shall refer to this feature as the primary bar; with an axis ratio of , it is a fat bar. The inner–disk arms appear tangent to part of the primary bar but do not depart quite from the ends of the bar. In the optical images, such as the Chengalur–Nordgren –band image (Nordgren et al., 1997) in Fig. 1 which has resolution, one does not see straight dust lanes along the primary bar. Straight dust lanes are the signature of a bar that extends between an inner Lindblad resonance and corotation (Athanassoula, 1992a, b). Measured widths of dust lanes in galaxies with large bars are, typically, 100 – 250 pc from (Benedict, 1982) on NGC 7479 and our measurements on NGC 1300 and NGC 5236 (from images in Elmegreen et al. (1996) and Sandage & Bedke (1988), respectively). At the distance of NGC 5394, this corresponds to – , so, if present in NGC 5394, the optical resolution may not be good enough to see them. Interior to the primary bar, the near–infrared and –band images by Bushouse & Stanford (1992) reveal an elongated feature with a major axis of and a position angle of 90∘, thus trailing the bar by 30∘ in azimuth. This smaller oval feature is not evident in the –band image ( resolution) in Paper I or the 2-MASS images ( resolution) or in the Chengalur–Nordgren –band image. In Section 7 below, we consider the kinematic evidence for this possible secondary bar.
From the twist of the HI velocity contours at the outer tidal arm, Paper I concluded that the outer tidal arms are outside of corotation. If the outer arms are driving a density–wave in the inner arms (it is not clear that this is occurring), then the radius where the inner–disk arms end and the outer tidal arms begin (1.6 times the semi–major axis of the primary bar) may represent either corotation or the outer Lindblad resonance for the inner–disk spiral arms.
4 General CO Distribution in NGC 5394
The Onsala observations (Paper I) measured a total integrated 12CO flux of 168 Jy km s-1 from a five–position survey of NGC 5394 with a (HPBW) beam at spacing; of this, 129 Jy km s-1 is from the pointing (position B in Fig. 1) centered on the starburst nucleus and the rest is from a weak detection ( rms noise) in a pointing centered south of the nucleus, which includes the southern tidal arm. With the NRAO 12–m telescope, Zhu et al. (1999) measured a CO integrated flux of 154 Jy km s-1 in a (HPBW) beam; this is consistent with the Onsala value. With the adopted standard value of the conversion factor , the Onsala corresponds to an of M⊙. Paper I found (HI) = M⊙. After adding a 36% by mass contribution from helium to the atomic plus molecular hydrogen mass, this gives a total mass in gas of M⊙. However, as mentioned in the Introduction, use of the standard value of in a starburst region is questionable. We shall estimate for the starburst region in Section 6 and discuss the ratio for the galaxy in Section 8 below.
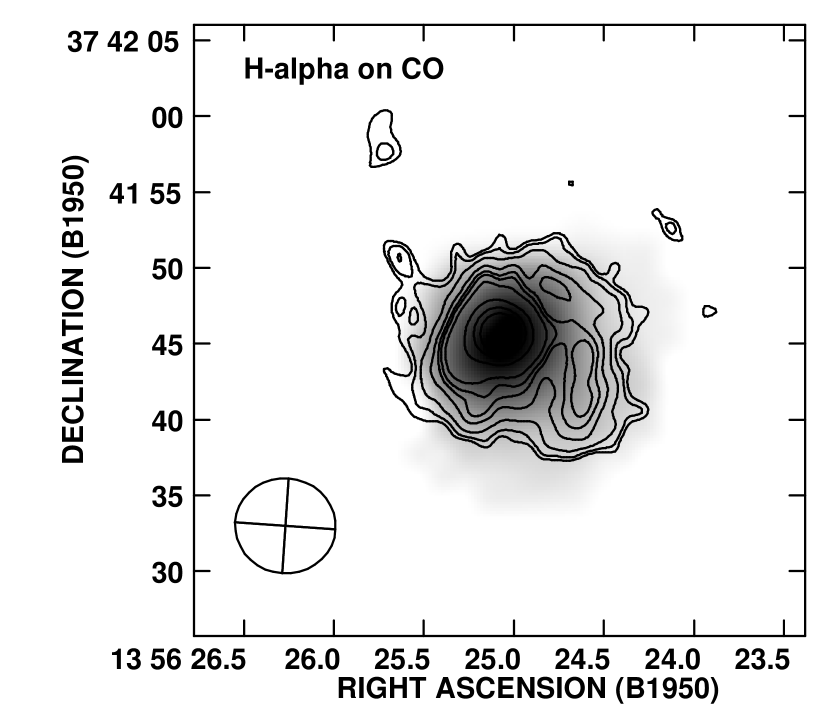
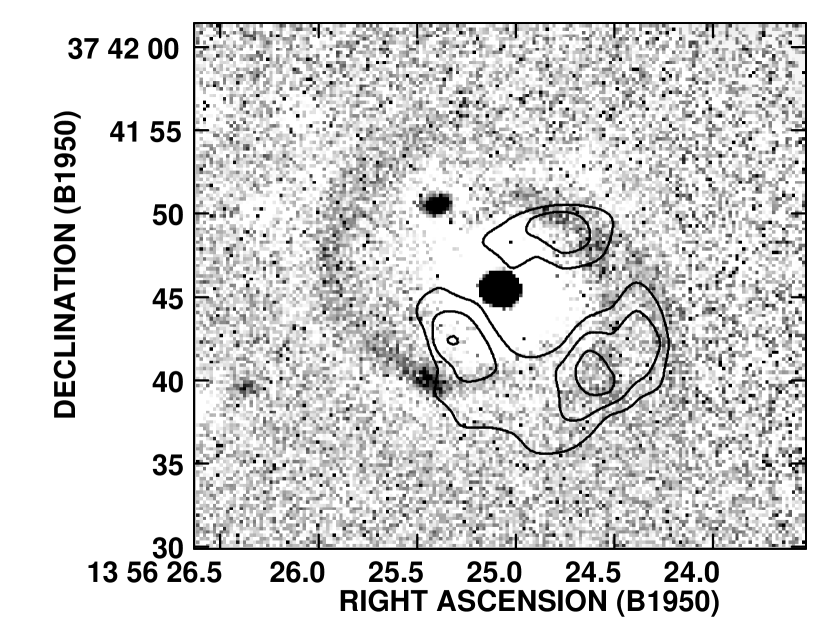
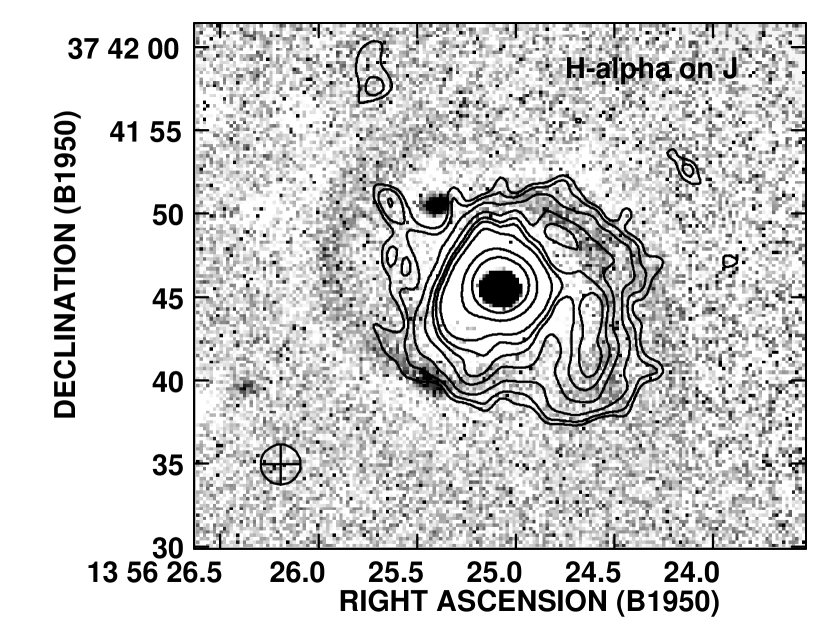
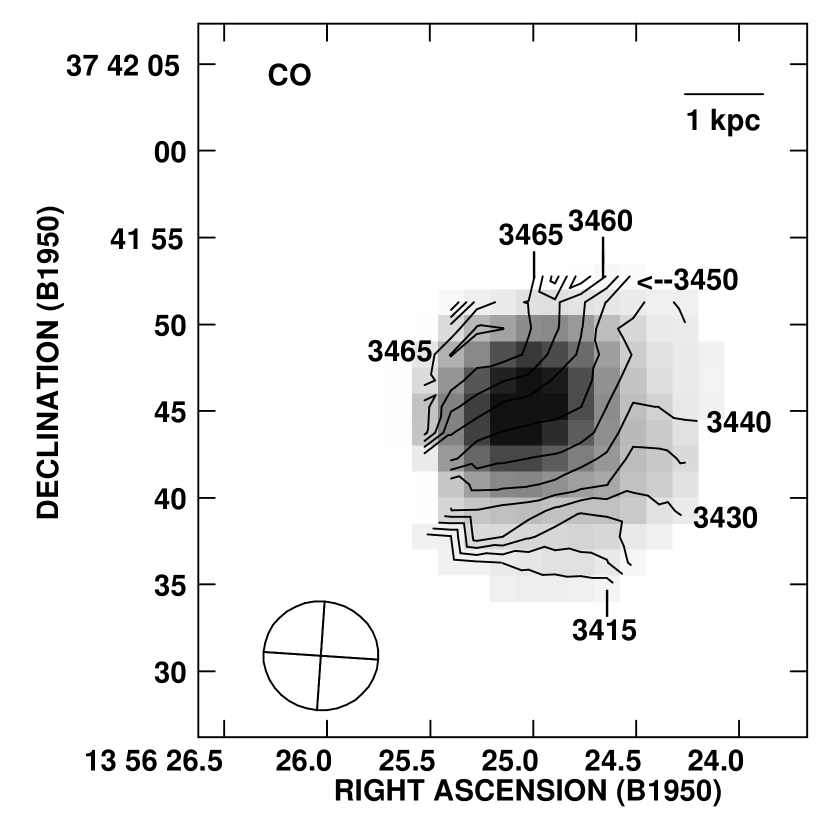
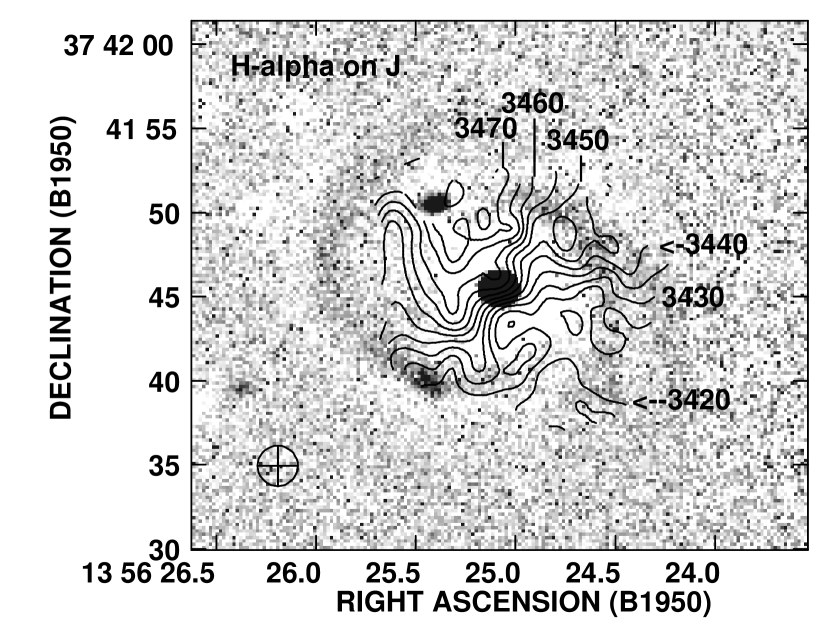
In the bottom panel of Figure 3, contours of the BIMA 12CO integrated–intensity , after correction for primary–beam attenuation, are overlaid on an unsharp–masked –band image ( resolution, from Paper I) in gray–scale to show the location of the CO emission relative to the eastern inner–disk arm and the two western inner–disk arms. The bottom panel of Fig. 4 displays contours of H emission ( resolution, from Paper I) overlaid on the image in gray–scale. In the nucleus there is a marginal displacement between the surface brightness maximum in CO and the optical/radio continuum surface brightness maximum (see Section 6 below). Aside from this, the 12CO emission and H emission have a similar lopsided distribution of extended emission towards the southwest. In particular, no CO or H emission is detected from the eastern inner–disk arm, which is bright in the optical continuum. Star formation in the disk appears to follow the distribution of molecular gas.
The total integrated CO flux detected with BIMA is = 117 Jy km s-1, with an rms noise of Jy km s-1 and an uncertainty in the flux calibration of 10% - 15%. For the aperture containing the starburst nucleus and the inner disk arms (position B), the single–dish Onsala observations find = 129 Jy km s-1, with an rms noise of Jy km s-1. Thus, within the uncertainties (rms noise, calibration), the BIMA map detects all the CO emission seen by Onsala at position B, so the Onsala observations support the conclusion from the BIMA map that any CO emission at the eastern inner–disk arm is below the rms noise in either data set.
In the top panel of Fig. 4, contours are overlaid on the radio continuum cm image from the FIRST survey (Becker, White, & Helfand, 1995) in gray–scale. The spatial resolution of the BIMA image (, HPBW) is a little lower than that of the radio image ( HPBW). The radio continuum emission is strongly peaked on the starburst nucleus and symmetrically distributed about it.
The HI observations of Paper I are more sensitive to low column density gas than the CO observations presented here. We detected HI emission from the entire inner disk, the southern tidal arm, and the inner third of the northern tidal arm (see Figure 5). The line–of–sight HI column density (HI) is greater on the western side than on the eastern side of the disk. The distributions of the ionized gas, atomic gas, and molecular gas in the disk of NGC 5394 all favor the western or southwestern side. Unless driven by external forces, such a lopsided distribution of gas should not last more than a few shear times.
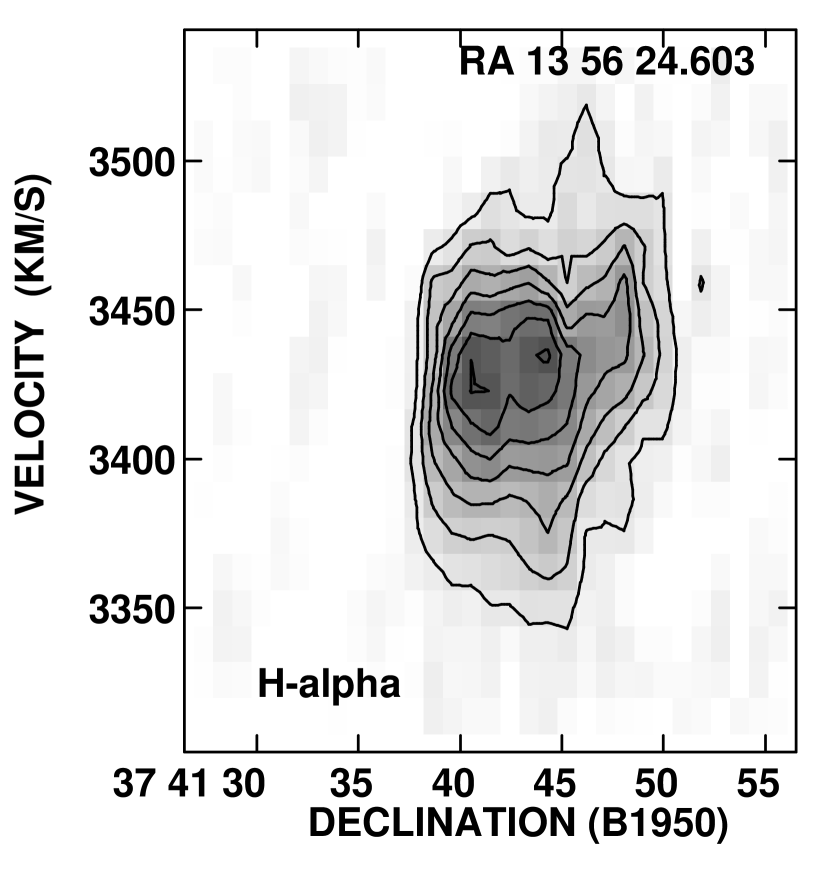
Roughly 80% of the BIMA CO emission from NGC 5394 is concentrated in the central 800 pc (FWHM) starburst region,444The 800 pc size is from a Gaussian fit to the cm radio continuum and H emission, deconvolved from the point spread function. and the rest comes from the part of the inner disk south and west of the central starburst. After subtracting the CO emission from the 800 pc starburst (assumed axisymmetric), we get the residual image displayed in the top panel of Figure 6. The innermost western arm, west of the nucleus, appears as an arm in H with the brightest H emission along its inside edge (see bottom panel of Figure 6). Part of this arm is detected in CO emission, with a maximum of 31 K km s-1, equivalent to a line–of–sight column density of H2 cm-2. The P–V diagrams in Figure 7 are for a slice along the declination axis, west of the nucleus, and thus display the emission from the innermost western arm. These diagrams show that CO and H have a similar distribution of velocities as well as similar mean velocities at this arm. Since the H resolution is , the H P–V diagram in Fig. 7 contains negligible emission from the starburst, whereas the CO P–V diagram contains some starburst emission.
Before correction for the velocity gradient across the beam, the CO one–dimensional velocity dispersion at the innermost western arm is 15 km s-1. To correct for the velocity gradient, we subtract the velocity difference across the Gaussian beam in quadrature. We have confirmed with numerical experiments that subtracting in quadrature is the appropriate correction (for plausible values of linear shear). This reduces the CO velocity dispersion to 14 km s-1. Since estimates of the cloud–cloud CO velocity dispersion in the Milky Way range from 3 to 9 km s-1, with a median value of 4 km s-1 (Combes, 1991), the CO velocity dispersion at the innermost western arm seems to be somewhat higher than normal for galaxy disks. If attributed to unresolved in–disk streaming motions, such motions would need to be large because the disk is viewed nearly face–on (inclination = 15∘). Over much of the disk of NGC 5394, Paper I found HI velocity dispersions of 20 – 40 km s-1, which are high compared to the HI velocity dispersions of 6 – 13 km s-1 in undisturbed spirals (see references in Kaufman et al. (1997)). Given the nearly face-on orientation of NGC 5394, these velocity dispersions probably represent mainly the –component of the motions.
Paper I reported a weak ( rms noise) detection in the Onsala observations of CO emission from the southern tidal arm of NGC 5394, with = 3.3 K km s-1. The BIMA observations detect no emission here. As the rms noise upper limit to in the BIMA data, we take = (the rms noise per channel in the BIMA cube) (the width of two channels)/PB, where PB is the primary–beam sensitivity of the mosaiced data. If the CO emission uniformly fills the Onsala aperture on the southern tidal arm, it would be too faint to detect in the BIMA observations since the rms noise upper limit to at this position is 7.1 K km s-1 in the BIMA map.
5 The Eastern Inner–Disk Arm of NGC 5394
The eastern and the outer of the two western inner–disk arms are both devoid of on–going star formation. No CO emission is detected from the eastern inner–disk arm. This is probably also the case for the outer of the two western inner–disk arms, but at our CO resolution, the situation there is contaminated by CO emission from the innermost western arm. Therefore we concentrate on the eastern inner–disk arm but assume that the same logic applies to the outer of the two western inner–disk arms.
Why is there no evidence of star formation in progress at the eastern inner–disk arm? We consider first the surface density of gas. HI emission from this arm is present with a line–of–sight column density (HI) = atoms cm-2 (measured with resolution = = 2.6 kpc HPBW in Paper I). The rms noise upper limit to at the eastern inner–disk arm in the BIMA data is 7.6 K km s-1. With the “standard” value of , this corresponds to a rms noise upper limit to of H2 cm-2.
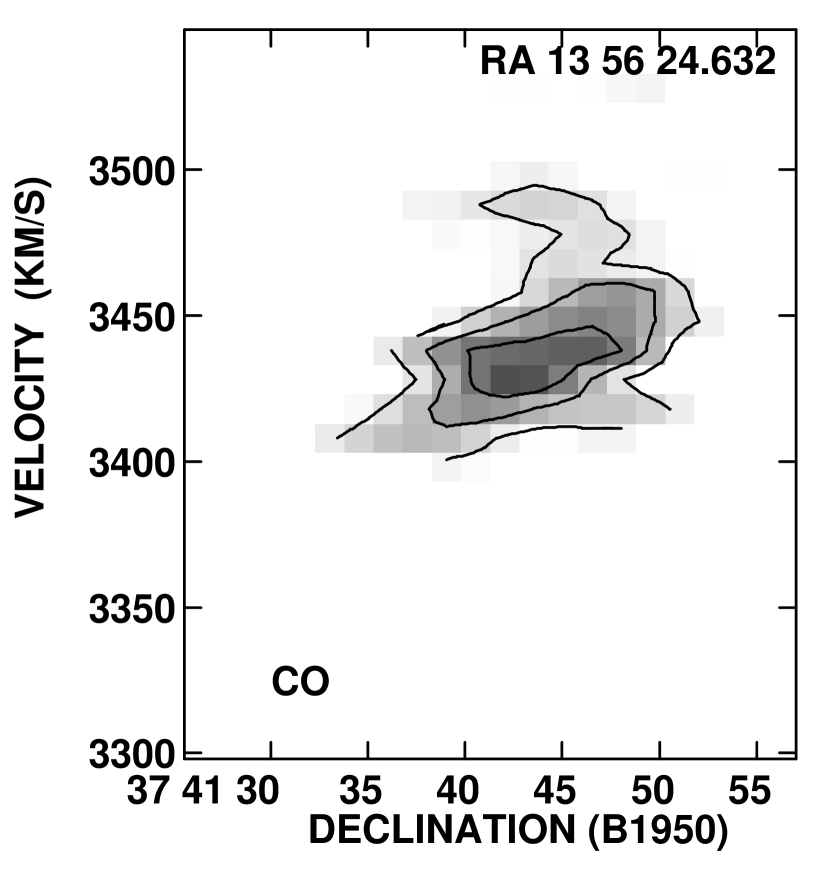
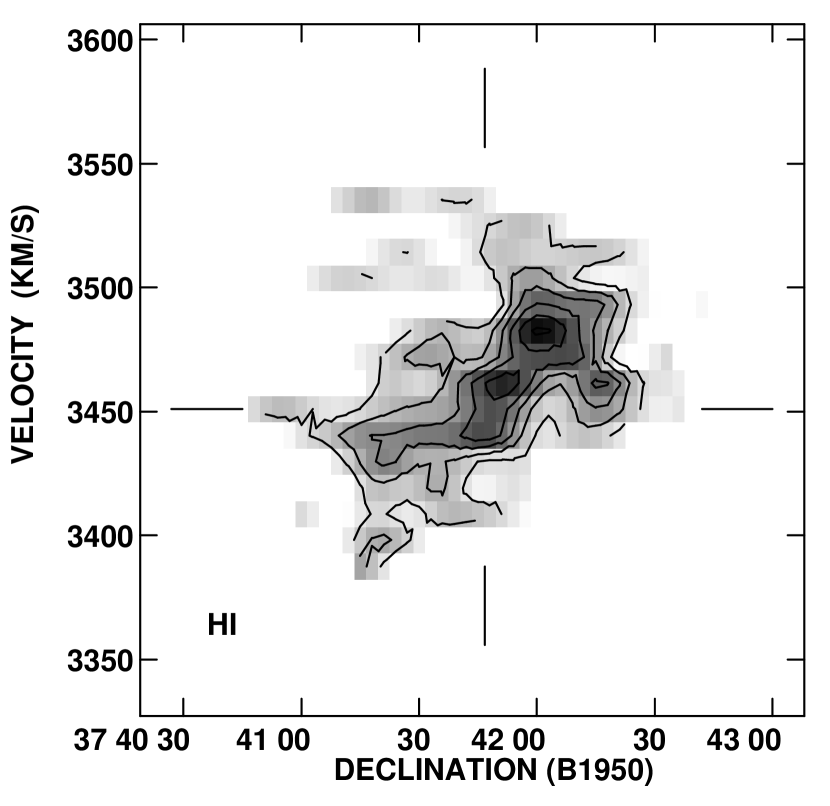
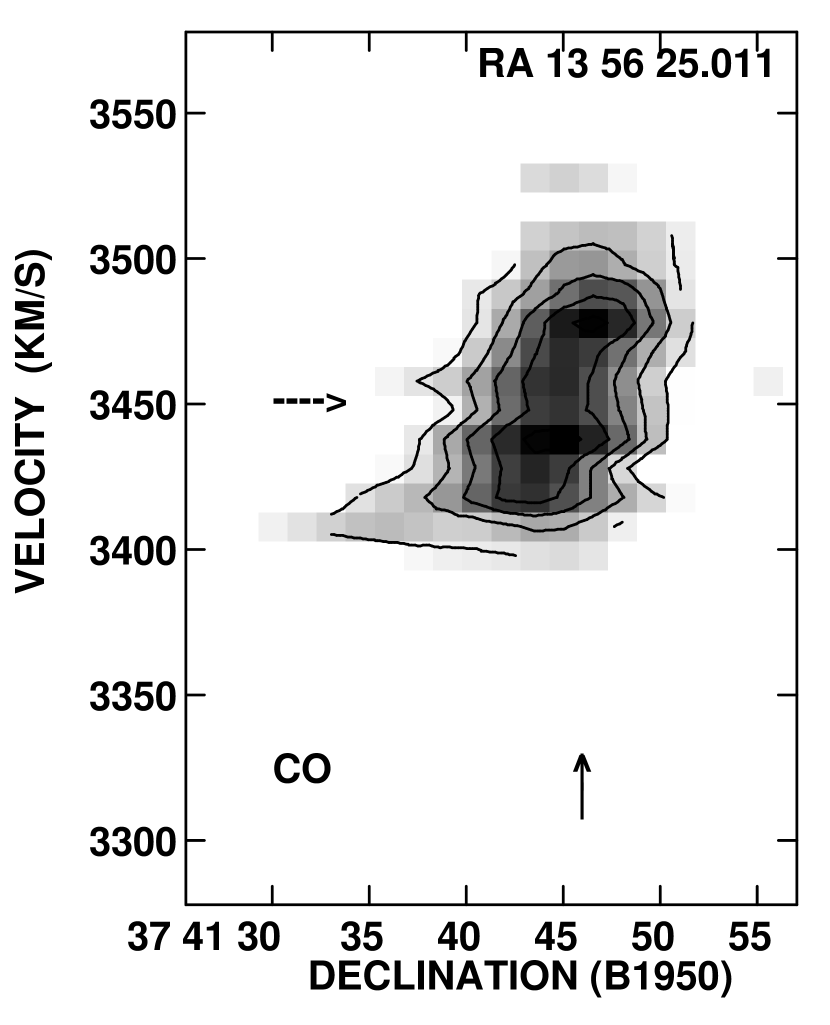
From observations of spiral galaxies, Kennicutt (1989) and Martin & Kennicutt (2001) found that the instability parameter for significant star formation to occur. The instability parameter , where is the epicyclic frequency, is the one–dimensional velocity dispersion in the gas, and is the face-on surface density of gas. Paper I used HI data to determine values for these parameters. A position–velocity diagram in HI from Paper I (with resolution) and a position–velocity diagram in CO (with resolution), are displayed in Figure 8 and in the left panel of Figure 9, respectively, for a cut through the optical nucleus with abscissa along the projection line–of–nodes of the galaxy (position angle = 0∘). The HI P–V diagram provides a rather messy “rotation curve” because NGC 5394 is viewed nearly face–on, the HI velocity dispersion is high, there are streaming motions associated with the tidal arms and the bar, and the spatial resolution is low. From the HI data, Paper I concluded that the inner–disk arms are located on the solid body part of the rotation curve and took the epicyclic frequency at galactocentric distance (on the eastern inner–disk arm) as = 37 km s-1 kpc-1, where is the orbital angular speed.555The value was misprinted in Paper I as 3.7 km s-1 kpc-1. Also, the inclination was estimated to be 9∘ by comparing the observed value of = 27 km s-1 with the expected value of = km s-1 from the –band luminosity (see Paper I).
With the higher angular resolution of the CO P–V diagram, we see that the rotation curve has a steeper rise in the inner disk than apparent from the HI data. It may have turned over by in the south (see Figure 9), but it is difficult to draw a firm conclusion because the emission at this radius is faint, the velocities are affected by the streaming along the bar, and the CO resolution is . At we find = 41 km s-1 /(2.3 kpc ). The added information from the CO P–V diagram changes to 41 km s-1, and thus changes our estimate of the inclination to 15∘ and our estimate of the epicyclic frequency to [2 (41 km s-1)]/(2.3 kpc ) = km s-1 kpc-1 at if in solid body rotation, or a factor of less if on the flat part of the rotation curve.
Since the distribution of gas is lopsided, we use the surface density of gas on the eastern inner–disk arm at to compute the instability parameter. For , we adopt from Paper I the HI value of 30 km s-1 at the eastern inner–disk arm. The HI column density at this arm is (HI) = atoms cm-2. Including a 36% by mass contribution from helium,
where is the proton mass. (The calculation of in Paper I ignored the contributions from helium and molecular gas.) Using the above rms noise upper limit to gives an upper limit to of 43 M⊙ pc-2 at on the eastern inner–disk arm and a lower limit to of 5.0 if on the flat part of rotation curve. An upper limit to is obtained by setting = 0: = 29 if on the flat part of the rotation curve. The values of should be increased by if in solid–body rotation. Thus lies in the range 5 to 42. Since this exceeds critical value of 1.4 from Kennicutt (1989) (see also Martin & Kennicutt (2001)), it appears that the instability parameter is presently too high for significant star formation at the eastern inner–disk arm.
For comparison, star formation is presently occurring on the innermost western arm and CO emission is detected from a portion of that arm. To compute there, we take our peak value of at this arm, which corresponds to an of H2 cm-2 and use our measured CO velocity dispersion of 14 km s-1 for since dominates here. Then with solid body rotation, we get . So the Toomre gravitational instability criterion seems to explain the presence of star formation on the innermost western arm, provided the value of the conversion factor is not appreciably less than the standard value.
The simple answer to the question of why there is no evidence of ongoing star formation at the eastern inner–disk arm or at the outer of the two western inner–disk arms is that there is presently too little molecular gas there. The question becomes why is there so little molecular gas associated with optically bright spiral arms.
6 Central Starburst in NGC 5394
6.1 CO Flux, Star Formation Rate, and Extinction
The total in NGC 5394 detected by BIMA is 117 Jy km s-1. Of this, approximately 97 Jy km s-1 is from the starburst region (on the assumption of east–west symmetry for the starburst). Using the adopted standard value of , we make the following comparison between the NGC 5394 starburst and the M82 starburst. The NGC 5394 starburst has a radio continuum luminosity at cm of W Hz-1 (Paper I), a linear size of 800 pc, and an H2 mass of M⊙ (excluding helium). The M82 starburst has a radio continuum luminosity of W Hz-1, a size of 600 pc (Condon et al., 1990), and an measured by Wild et al. (1992) for a region with diameter 800 pc and scaled to the same value of of M⊙. Thus, compared to the M82 starburst, the starburst in NGC 5394 has about the same linear size, 77% of the cm radio continuum luminosity, but times the CO luminosity. It may be that the M82 starburst is in a more advanced state and has already used up more of the gas. Rieke et al. (1993) suggested that the M82 starburst consists of two starbursts, one of which started years ago and the other, years ago. Vanzi, Alonso–Herrero, & Rieke (1998) found that the starburst in NGC 5394 is several Myr past the peak star–formation rate.
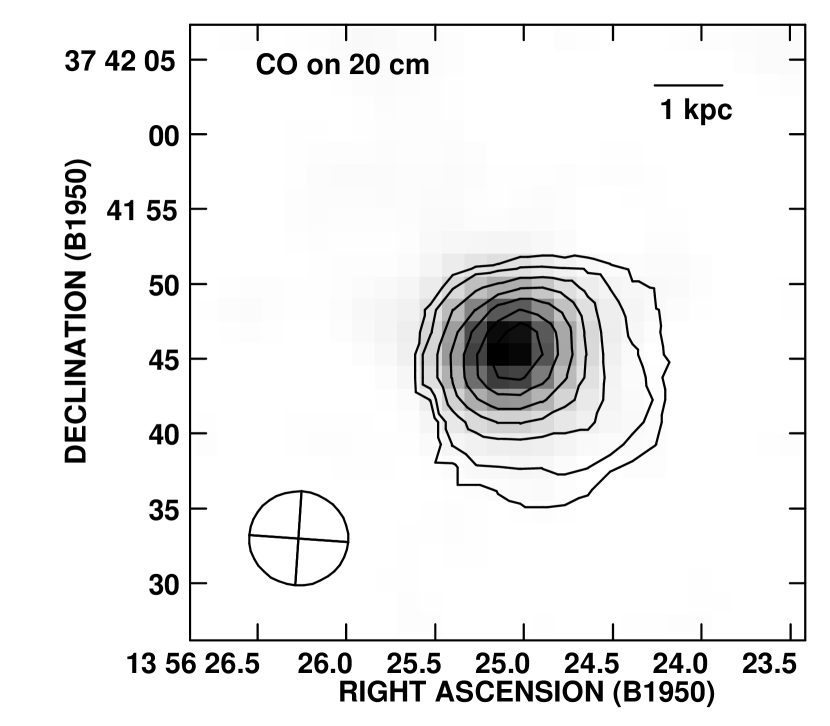
For the position of the nucleus, we take the location of the bright radio continuum peak in the FIRST image. (The stated uncertainty of the FIRST survey position is ). There is negligible displacement between the surface brightness maxima in the radio continuum, –band, and H. The maximum is west and south of the radio continuum position. Since the positional uncertainty of the CO maximum is less than , the offset between the and radio continuum maxima is marginal. It could result from some depletion of the CO flux at the radio continuum maximum, e. g., by photodissociation of CO or by star formation consuming the gas. Gaussian fits to the emission (Table 3) show that the H source and the radio continuum source in the center of NGC 5394 have the same size, 800 pc (FWHM). The CO emission with a major axis of 1.1 kpc (FWHM) is slightly more extended. The radio continuum emission from NGC 5394 is nonthermal with a spectral index of , and 83% of the radio continuum flux density of NGC 5394 at cm is from the starburst region (see Table 1).
There is no evidence that the emission from the center of NGC 5394 is dominated by an AGN. The optical and near–infrared spectra (Leech et al., 1989; Vanzi, Alonso–Herrero, & Rieke, 1998) are HII region–type. The radio continuum emission does not appear to be sufficiently compact to be mainly from an AGN. It is likely that most of the radio emission originates from SNRs or cosmic–ray electrons previously accelerated in supernovae, as is the case for the M82 starburst.
The measured H flux from the NGC 5394 starburst, not corrected for extinction, implies a radio continuum flux density from optically thin free–free emission 0.9% of the measured value of (see Paper I). We can get a firm upper limit to the average visual extinction of the HII regions by assuming that all the measured is free–free emission (clearly it is not, since the spectral index is nonthermal). The resulting upper limit, = = 6.5 mag, is unrealistically high since it assumes a thermal fraction at 20 cm of 100%. For a better estimate we choose the following two alternatives. In the M82 starburst, the thermal fraction at 20 cm is 7%, as determined by Golla, Allen, & Kronberg (1996) from a comparison of [Ne II] 12.8 µm and radio continuum emission. If the same thermal fraction applies to the NGC 5394 starburst, then the intrinsic H flux is a factor of 7.5 greater than the measured H flux, and the average extinction for star–forming regions in the NGC 5394 central starburst is = = 2.8 mag. If, instead, we adopt the cm thermal fraction of typical of normal disk galaxies (Condon, 1992), then the intrinsic H flux is a factor of 14 times the measured H flux, and the average extinction for the HII regions is = 3.7 mag.
Attributing all of the 60 µm flux of the Arp 84 system to NGC 5394, Leech et al. (1989) derived a luminosity ratio of 2000 for the NGC 5394 starburst. For the disks of bright spiral galaxies, Leech et al. (1989) found equals 20 – 200 (based on data from Persson & Helou (1987) in which the H flux of the disk was corrected for a mean extinction of 1.1 mag at H). With a resolution of at 60 µm, the 60 µm flux of Arp 84 includes both galaxies. To determine what fraction of the flux is from the NGC 5394 starburst, we use the FIR–nonthermal radio correlation for spiral galaxies. Since Paper I finds that 29% of the radio continuum flux from the galaxy pair is from the central starburst in NGC 5394, we attribute 29% of the 60 µm flux to the NGC 5394 starburst. This reduces the value of for the starburst to . If we adopt the range of values (2.8 – 3.7 mag) for the average Av from the thermal fraction argument, then the value of is further reduced to the range 40 – 80, similar to values found in the disks of bright spirals. Adoption of an average of 3 – 4 mag gives a plausible consistency between the 60 µm flux, the radio continuum, and the H flux. It thus appears that the intrinsic H flux is an order of magnitude greater than the observed H flux. In that case, the dereddened H luminosity of the starburst region is erg s-1. Then, taking the star formation rate SFR = M⊙ yr-1 from Kennicutt (1998), we get an SFR of M⊙ yr-1 for the starburst region.
The H to H emission–line ratio (Balmer decrement) measured for the NGC 5394 nucleus by Leech et al. (1989) with a wide slit gives a visual extinction of 1.3 mag (assuming Case B recombination). They find broad–band optical colors, uncorrected for reddening, similar to those of G stars. They note that the H flux is roughly consistent with the number of ionizing stars implied by the broad–band optical fluxes. In the BIMA data, the maximum in the nucleus is K km s-1, and the mean value of for the starburst is 66 K km s-1. With the standard value of the conversion factor , the maximum implies a column density H2 cm-2, and the mean , a column density H2 cm-2. For a standard dust–to–gas ratio with = mag ( atoms cm-2)-1 (Bohlin, Savage, & Drake, 1978), the mean CO column density implies a highly opaque region with = 11 mag to the midplane. Although it is known that the dust–to–gas ratio is proportional to metallicity (Sodroski et al., 1995), we lack a reliable determination of the metallicity of the NGC 5394 starburst. Leech et al. (1989) note that the measured value of the [N II]/H emission–line ratio for the starburst is compatible with solar metallicity but warn this is not conclusive because the ionization parameter is unknown.
How can we reconcile these three very different values for ? The small value of (1.3 mag) from the Balmer decrement as compared to the average extinction (3 – 4 mag) from the thermal fraction argument means that the observed optical flux originates from regions of small optical depth (near the edges of the clouds), and we are not seeing the optical photons emitted by stars and HII regions deeply embedded in opaque clouds. Thus, optically, most of the starburst is hidden from view, probably in a patchy distribution of highly opaque clouds, as Leech et al. (1989) suggest.
The value of (11 mag) deduced from the mean with standard values for and the dust–to–gas ratio exceeds the average of 3 – 4 mag from the radio thermal fraction versus H and arguments. The most likely explanation is that the conversion factor = in the starburst region is a factor of 3 – 4 below the standard value. Similar reductions in the value of have been obtained for high excitation regions in the centers of other galaxies (Wall et al., 1993; Regan, 2000). For the Milky Way, Sodroski et al. (1995) concluded that is a factor of 3 – 10 lower near the Galactic center than in the disk at R = 2 – 7 kpc. In the M82 starburst, Smith et al. (1991) and Wild et al. (1992) found that the value of is a factor of 3 below the standard value. It appears that the different physical conditions in a starburst nucleus (Brouillet & Schilke, 1993; Aalto et al., 1995, 1997) result in a smaller value of than in the main disk of a spiral galaxy. Kaufman et al. (1999b) calculate the dependence of for a photodissociation region on far–ultraviolet flux, density, column density, and metallicity and apply their model to the M82 starburst as an example. They can fit the M82 observations with clouds that have higher gas density and higher thermal pressures than GMCs in the Milky Way.
Use of the standard value of overestimates the extinction in the starburst region of NGC 5394 and, consequently, overestimates the total molecular mass of NGC 5394. If the value of is down by a factor of 3 – 4 in the starburst region but not reduced outside of the starburst, then the total mass in gas in the galaxy is M⊙.
6.2 Velocity Structure
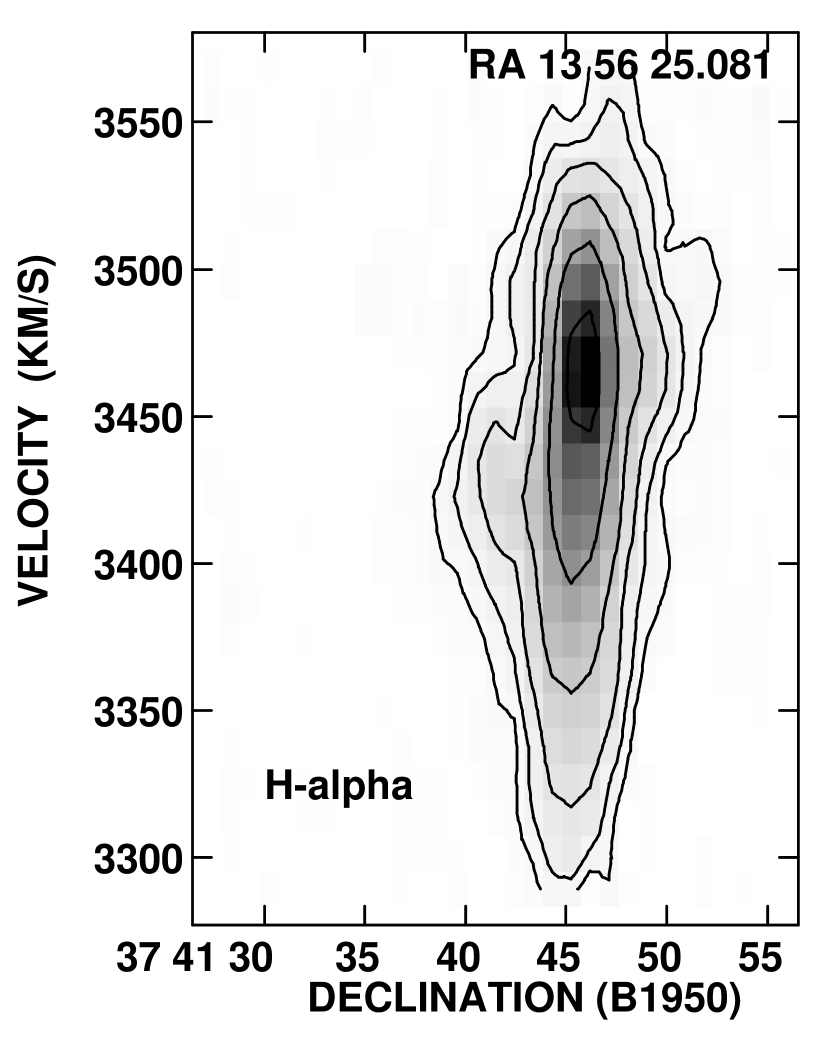
Figure 9 displays position–velocity diagrams through the nucleus of NGC 5394 in CO and in H (from the Fabry–Perot data of Paper I) with the abscissa along the projection line–of–nodes of the galaxy (position angle = 0∘). In the Fabry–Perot H data, the mean velocity at the nucleus is 7 km s-1 greater than the long–slit value of km s-1 obtained by Karachentsev (1980); this indicates the uncertainty in the calibration of the Fabry–Perot H velocities at the NGC 5394 nucleus. The channel width is 12 km s-1 in the H cube and 10 km s-1 in the CO cube. These P–V diagrams reveal two significant differences between the CO and H velocity distributions in the starburst region: (a) the CO emission is double–peaked in velocity whereas the H emission has a single velocity peak and (b) in H a clear extension to lower velocities is seen at the nucleus but is absent in CO. The CO emission has one maximum at 3478 km s-1 and the other at 3438 km s-1; the average of these two velocity peaks, 3458 km s-1, is close to the H systemic velocity. The separation in velocity implies a spatial separation, e. g., one velocity peak from the approaching side and the other from the receding side. This could result from some depletion of CO at the nucleus by photodissociation or consumption by star formation or the molecular gas could be in a nuclear ring or in “twin peaks” near an inner Lindblad resonance (ILR). It also means that the two CO peaks are not spatially coincident with the peak in the H emission. If the double peaks in CO are in the disk plane of NGC 5394, then each has a velocity difference with respect to the nucleus of = 20 km s-1/ = 77 km s-1.
We made CO position–velocity diagrams along various position angles. The maximum separation between the two CO peaks is (less than 1/3 the synthesized beamwidth), with a smaller spatial separation along the bar major axis than along the bar minor axis. It is only the velocity structure that enables us to identify these as separate features.
Figure 10 compares the CO line profile at the nucleus with the H line profile from Paper I. From a Gaussian fit to the CO line profile at the nucleus, we find that the CO central velocity is 3453 km s-1 at the maximum and that the FWHM is km s-1. Paper I suggested that the extended blue wing of the nuclear H profile (a velocity asymmetry of km s-1) could represent an outflow of ionized gas from the starburst, perpendicular to the disk. From the above extinction estimate, a counterflow on the far side would not be visible in H. On the assumption that the H nuclear profile consists of a symmetric Gaussian component from the starburst in the nuclear disk plus an outflow/wind (visible on the near side only), we fit the high velocity side of the profile with one side of a Gaussian with FWHM = 77 km s-1 and then subtracted the (full) Gaussian profile to obtain the residual H spectrum shown in Fig. 10 for the outflow. In the H profile, the maximum residual intensity in the blue wing (which we associate to an outflow) is 22% of the maximum in the original line profile. There is a hint of a feature ( the rms noise) in the CO profile at 80 – 100 km s-1 to the red of , but no clear evidence for a molecular counterpart to the H outflow component.
For comparison, in M82 the optical emission lines give an outflow speed of km s-1 (Shopbell & Bland–Hawthorn, 1998), whereas the 12CO and higher level CO molecular lines give an outflow speed of only km s-1 (Shen & Lo, 1995; Nakai et al., 1987; Seaquist & Clark, 2001). Also, in M82, the line splitting that occurs in H is not seen in CO. If in the NGC 5394 starburst, the ratio of H to molecular outflow speeds is similar to that in M82, then in NGC 5394 it would be hard to identify an outflow in CO (that is, to distinguish between an outflow and a thick disk or spheroidal distribution) since the H outflow speed is only km s-1.
The CO data have lower spatial resolution than the H data. If we correct for the gradient of the mean velocity field across the respective beams (by subtracting the velocity difference across the beam in quadrature), then the CO profile at the nucleus has a one–dimensional velocity dispersion of 31 km s-1 and the part of the H line profile that we attribute to the nuclear disk has a one–dimensional velocity dispersion of 30 km s-1. This probably represents mainly the –component of the velocity dispersion. The molecular and H velocity dispersions at the NGC 5394 nucleus are about the same size as the –component of the molecular velocity dispersion (30 – 54 km s-1) in the Milky Way Galactic Center estimated by Bally et al. (1988). The smaller value for the molecular velocity dispersion found in Section 4 pertains to the innermost western arm, not the nucleus.
7 Comparison of CO, H, and HI Velocity Fields of NGC 5394
Figure 11 displays the 12CO velocity field from the BIMA data, and Figure 12, the H velocity field (from Paper I). The CO velocity field covers only the BIMA synthesized half–power beamwidth and does not reveal as much detail as the H velocity field. Given the difference in spatial resolution, the CO velocity field appears quite similar to the H velocity field. The similarity, despite H extinction, can be understood if the H and CO emitting layers in the disk have negligible shear perpendicular to the disk. The more extended VLA HI data in Paper I ( resolution) provide the velocity field of the main disk and the tidal arms. In the main disk, the HI velocity field has kinematic minor axis at , so Paper I took the position angle of the galaxy’s projection line of nodes as . The near side of the galaxy is the western side. In the CO and H velocity fields, the kinematic minor axis has rotated such that in the central it has a very different position angle of and is along the major axis of the –long primary bar. Some possible explanations for the rotation of a kinematic minor axis in the inner disk of a galaxy are streaming along a bar or axisymmetric radial motions. The sense of rotation of the kinematic minor axis of NGC 5394 is opposite to that expected for axisymmetric radial inflow in the disk. Axisymmetric radial expansion in the disk would rotate the kinematic minor axis in the sky–plane by , where equals the position angle of the minor axis of the projection minus the position angle of the kinematic minor axis of the central region, is the expansion speed (positive for expansion), and is the tangential speed (Wong & Blitz, 2000). Since the observed = = is negative, there is no evidence that axisymmetric inflow of gas into the inner disk is presently occurring. If axisymmetric expansion, the implied value of is large, 0.68 . The more likely interpretation of the rotation of the kinematic minor axis is that it represents gas moving in elliptical orbits around the bar. The inner–disk arms may have a different pattern speed than the primary bar, as they do not depart from the ends of the bar.
Since NGC 5394 is viewed nearly face–on, large in–plane velocity excursions would not appear very prominent in any line–of–sight velocity field. With its higher spatial resolution, the H velocity contours have more wiggles, indicative of streaming motions, than the CO velocity contours. Some of these appear associated with the innermost western arm. Additionally, it seems likely that the –shaped kinks in the H velocity contours southeast of the nucleus and the –shaped velocity kinks northwest of the nucleus are related to the possible secondary bar visible in the and –band images in Bushouse & Stanford (1992). The bilateral symmetry of the velocity kinks at provides kinematic evidence that this stellar feature is a coherent structure produced by a non–axisymmetric gravitational potential. The position angle of the kinematic minor axis changes from at to at ; the kinks represent the transition between these two orientations. Thus the velocity field supports the interpretation that there are two nested bars, with the secondary bar trailing the primary bar by 30∘. It is puzzling that the secondary bar is not seen in the higher resolution –band image of Paper I.
8 Discussion of Results on NGC 5394
The BIMA 12CO observations of the tidally–distorted galaxy NGC 5394 reveal that: (1) about 80% of the CO emission detected by BIMA is concentrated in the 800 pc (FWHM) starburst region; (2) the extended CO and H emission in the inner disk have a similar lopsided spatial distribution, with an excess on the southwestern side of the disk, so star formation in the disk appears to be following the gas distribution; (3) no CO or H emission are detected from the bright, eastern inner–disk arm; (4) the estimated value of in the starburst is a factor of 3 – 4 below the standard value. The HI emission is also most prominent on the same (western) side of the disk as the CO and H emission, so in total gas NGC 5394 has a lopsided spatial distribution in the disk.
Reducing the value of the conversion factor by a factor of 3 – 4 in the starburst region but using the standard value of outside of the starburst, we find from the Onsala that = 2.5 – 2.7, and that 20% – 25% of the atomic plus molecular gas in the galaxy is located in the central starburst. Galaxies with this high a value for /(HI) are uncommon in the large sample of spiral galaxies surveyed by Casoli et al. (1998). Using the standard value for , they find the mean value of is 0.28 for Sa to Sc galaxies. Like other starburst galaxies, NGC 5394 is CO–rich. Also, using the standard value of , Casoli et al. (1998) find that the average values of range from M⊙ kpc-2 for Sa galaxies to M⊙ kpc-2 for Sd galaxies, where is the isophotal diameter. They emphasize that is simply a means of normalizing the gas mass to a measure of the galaxy size and should not be interpreted as a gas surface density. Since NGC 5394 is intrinsically oval, we set the value of for NGC 5394 equal to , where is defined in Section 3. Reducing the value of by a factor of 3 – 4 in the starburst region but using the standard value of outside of the starburst gives = M⊙ kpc-2, which is typical of late–type spirals. The present lack of star formation in two of the three inner–disk arms results not from an overall paucity of gas in NGC 5394 but from its spatial distribution.
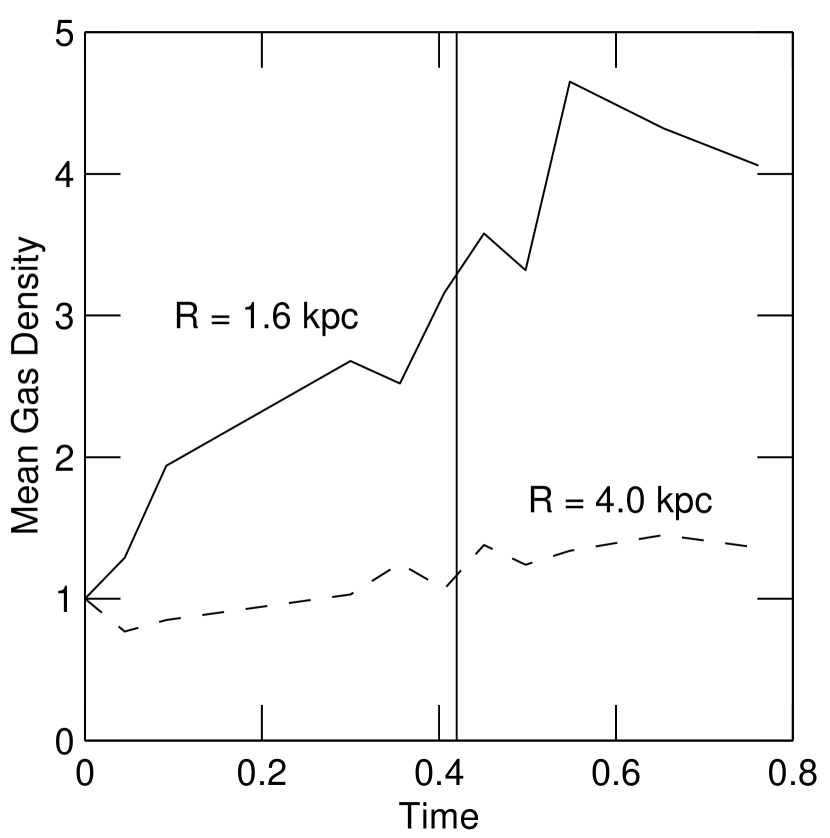
Paper I presented a galaxy encounter simulation that reproduces some of the main features of this galaxy pair with a collision that is prograde relative to NGC 5394 and retrograde at a high tilt angle relative to NGC 5395. In the model, the response of NGC 5394 to the tidal potential of the encounter produces an eye–shaped (“ocular”) oval, which subsequently evolves into inner–disk arms, like those visible in NGC 5394. There is a west versus east time lag in the development of the ocular oval, with the eye–shaped rim forming first on what is now the eastern side of NGC 5394. The model keeps count of the number of gas particles in spherical volumes of radii 1.6 kpc and 4 kpc in the center of NGC 5394 as the encounter progresses. This is displayed in Figure 13. The limited particle resolution of the model prevents us from treating smaller volumes. The number of gas particles within 1.6 kpc of the center builds up fairly steadily so that by the time of closest approach the mean gas density of this region is three times its initial value and by the present time it has leveled off at four times its initial value. The model finds that the amount of material in the central regions is no longer increasing at the present time; recall that the observed velocity field shows no evidence of present axisymmetric inflow (see Section 7).
The dominant tidal perturbation to NGC 5394 is an mode. This drives angular momentum transport, which produces the long tidal tails and inflow into the central region. The encounter also involves an term, which accounts for the time lag in the development of the eastern and western sides of the ocular oval. The model for this system (described in Paper I) uses rigid halos (softened point–mass potentials). As the galaxies pass each other in the model, their disks do not quite interpenetrate but their halos do. This results in a transient compression in the perturbation: before closest approach, NGC 5394 compresses as a result of the increasing tidal force of the NGC 5395 halo. This contributes to the infall into the central region before closest approach, while after closest approach the inflow into the central region results from ocular–induced angular momentum transport and inertia.
The observed lopsided distribution of gas could result from an asymmetry in the collisional perturbation plus the loss of angular momentum by the gas in shocks. The latter is necessary to differentiate between the gas and the stars because the distribution of old stars does not show the same lopsidedness as the gas. In the model, the asymmetry of the perturbation is evident as a time lag in the development of the two sides of the ocular oval. Since the stars form a collisionless system, they may respond differently than the gas, which can lose angular momentum in shocks. We offer the following speculative scenario for the inner–disk arms. The west versus east time lag in the development of the ocular oval may have led to a west versus east time lag in the formation of the inner–disk arms and to a west versus east time lag in the inflow of gas to the center. Gas at the eastern and the outer of the two western inner–disk arms underwent shocks (e.g., as a result of the bar, which may differ in pattern speed from the inner–disk arms) and flowed towards the center, leaving the stellar arms behind. This needs to be confirmed with more detailed simulations. Another possibility is that there may have been more gas inflowing towards the center on the western side.
Not all interacting galaxies are CO–rich (Horellou & Booth, 1997). From a comparison of the observed morphologies with models for prograde, in–plane, grazing encounters, Paper I concluded that the galaxies IC 2163, NGC 2535, and NGC 5394 form three distinct stages in the development of structures in this type of collision, with IC 2163 the least evolved and NGC 5394 the most evolved interaction. The “age” sequence is also seen in the star formation rates. IC 2163 has star formation typical of normal spiral disks (Elmegreen et al., 2001), and widespread CO emission is found in SEST observations with resolution (Thomasson et al., in progress). In NGC 2535, star formation is somewhat enhanced (Bernlöhr, 1993), the brightest H emission (Amram et al., 1989) occurs at the eastern and western ends of the eye–shaped oval at kpc from the nucleus, and the Onsala observations with resolution had clear detections of CO emission only from the central pointing (which includes the western apex) and from the portion of the tidal tail just beyond the eastern apex (Kaufman et al., 1997). Both positions have about the same integrated intensity . With the standard value of , NGC 2535 has /(HI) = 0.1. In NGC 5394, most of the CO emission is from the central 800 pc starburst region, and the ratio of molecular–to–atomic gas for the galaxy is typical of a starburst. Thus in prograde grazing encounters, there appears to be a time delay before conditions become suitable for a starburst. The length of the time delay depends on how rapidly post–encounter evolution proceeds. This small sample of three prograde encounters suggests that a central starburst may not develop until near the end of the ocular phase.
It appears that the encounter caused a considerable amount of gas to lose angular momentum and fall into the center of NGC 5394, produced the lopsided distribution of gas in its inner disk, and may have increased the ratio for the galaxy as a result of the conversion of atomic to molecular gas in the high density central region.
9 NGC 5395 Results
We expected to find a compressed molecular ridge or clumped molecular gas at the following locations in NGC 5395: (1) in the dominant spiral arm on the eastern side of NGC 5395, since this coincides with a prominent radio continuum ridge (see Paper I); (2) in a stellar plus ionized gas “shell–like” structure ( in diameter, marked on the NE side of NGC 5395 in Fig. 1) which Paper I interpreted as a caustic produced by temporary convergence of orbits; (3) in the prominent dust lanes along the dominant spiral arm on the western side of NGC 5395. On the eastern side of the galaxy, the dominant spiral arm is brighter in radio continuum and H emission, whereas on the western side of the galaxy, it is brighter in HI. The face–on surface density of HI plus helium (measured with resolution in Paper I) is 16 – 20 M⊙ pc-2 at Onsala position H (at the main dust lane on the western side of NGC 5395) and 10 M⊙ pc-2 at the caustic. NGC 5395 has an inclination of 65∘.
We compare the 12CO observations of NGC 5395 by the NRAO 12–m telescope (beam = HPBW) (Zhu et al., 1999) and by Onsala (beam = HPBW) (Paper I) with the BIMA data presented here. None of these data sets has complete coverage of the galaxy. With three pointings at a spacing of , Zhu et al. (1999) measured a total integrated flux of Jy km s-1, equivalent to = M⊙ with a standard value of . They then multiplied this flux by a factor of 1.7 to include CO emission outside of the region covered. Since (HI) is M⊙ (Paper I), applying this factor gives an ratio of 0.86, so NGC 5395, which does not have a central starburst, is somewhat CO–rich compared to the typical spirals in the survey by Casoli et al. (1998) but not as CO–rich as its companion.
All three NRAO 12–m profiles have very broad CO linewidths (Zhu et al., 1999). Correcting these for the HI velocity gradient across the CO beam and assuming that the CO emission fills the NRAO beamwidth parallel to the kinematic major axis (position angle = 173∘) results in a one-dimensional CO velocity dispersion of km s-1. This is similar to the HI velocity dispersions of 50 – 70 km s-1 found in Paper I. As in the case of the HI line widths, the large value for the velocity dispersion probably results mainly because the line–of–sight intercepts gas at various radial distances in the disk and at various altitudes above the plane. Paper I presented evidence for three–dimensional disturbed structures in the HI gas. The broad CO linewidths suggest that molecular gas may also participate in these three dimensional structures.
The Onsala and BIMA observations of NGC 5395 were not sufficiently sensitive to detect the molecular gas with high velocity dispersion seen by the NRAO 12–m. The Onsala observations detected a CO component with low velocity dispersion in the northern part of the ring/pseudo ring and measured an of 126 Jy km s-1 from the two pointings (labelled H and I in Fig. 1) centered north of the nucleus. At positions H and I, the Onsala line profiles have FWHM line widths of 77 km s-1 and 69 km s-1, respectively, and central velocities of 3314 km s-1 and 3328 km s-1 (close to the HI mean velocities). From the HI velocity field (Paper I), we find a velocity gradient of 3.8 km s-1 arcsec-1 at position H and 2.8 km s-1 arcsec-1 at position I. If the CO emission fills the Onsala beam uniformly along the kinematic major axis, then the velocity gradient would produce a velocity difference across the beam of 125 km s-1 at position H and 90 km s-1 at position I. Since these values are appreciably greater than the FWHM linewidths observed by Onsala, the CO emission does not fill the Onsala beam uniformly along the gradient of the velocity field (approximately north–south). The NRAO 12–m position north of the nucleus includes part of Onsala positions H and I and the caustic feature. Its line profile consists of a narrow component with = 3300 – 3360 km s-1 (the same velocity range as the emission found by Onsala at positions H and I) sitting atop the fainter, broad component with FWHM = 230 km s-1 (Zhu et al., 1999).
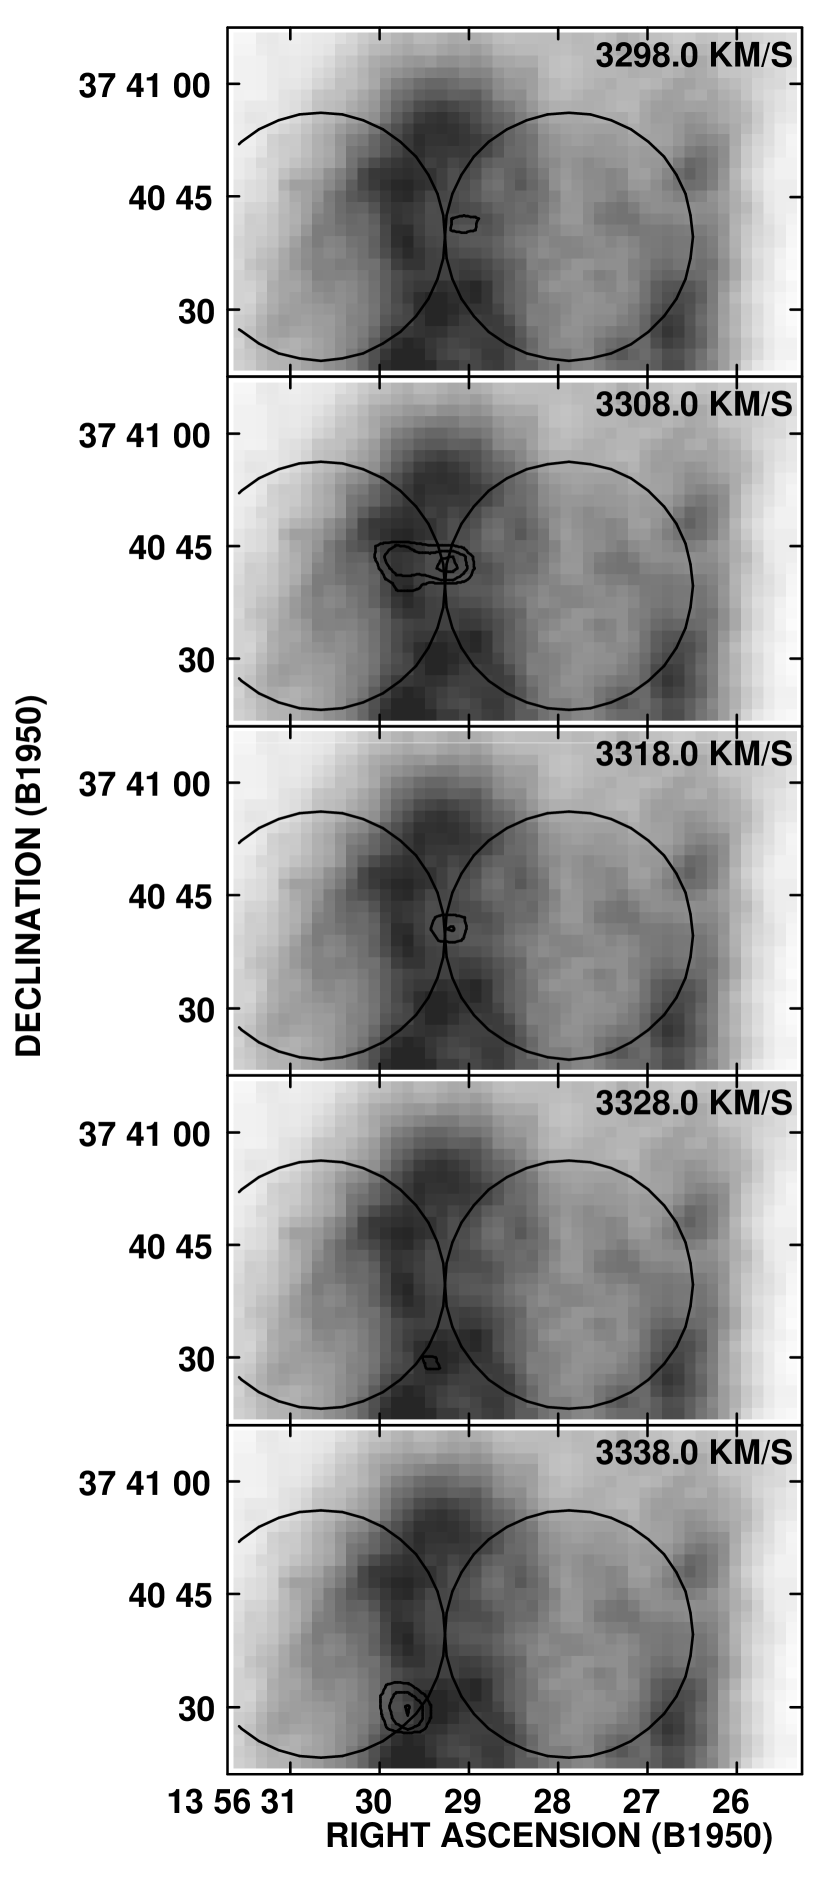
The BIMA observations detect very little CO emission from NGC 5395. In Figure 14, contours from BIMA channel maps for the appropriate velocity range are overlaid on the Digitized Sky Survey image in gray–scale for a field containing the stellar caustic feature and positions H and I. This displays the best detection of CO emission in the BIMA observations of NGC 5395: a feature at the intersection of positions H and I with maximum = 13 K km s-1 = the rms noise and = 6 Jy km s-1, which is 5% of the measured by Onsala from the two pointings H and I. Its location mainly interior to the arc formed by the stellar caustic is surprising as we had expected to find the CO emission in this field along the stellar caustic. The only other possible CO feature in Figure 14 is, at best, a marginal detection on the arm just south of the stellar caustic. The two channel at rms noise upper limit in this field corresponds to a face–on surface density, including helium, of 15 M⊙ pc-2 for a standard value of .
It is puzzling that BIMA missed almost all of the narrow velocity component to the CO emission at Onsala positions H and I. If the emission measured by Onsala were clumped in a linear feature , BIMA should have detected position H at the rms noise and position I at the rms noise (averaging the BIMA sensitivity over the Onsala aperture). The constraint imposed by the Onsala linewidth implies that the CO emission detected by Onsala has a N–S extent at position H and at position I. If the CO feature has dimensions , then it could be below the rms noise at position I in the BIMA observations but it should have been present at the rms noise at position H in the BIMA data. It may be that across the northern end of the HI, H, radio continuum ring/pseudo–ring of NGC 53945, there is a wide band of CO emission, possibly consisting of small, unresolved, molecular clouds, and that the E–W extent of the CO emission exceeds the largest scale visible to BIMA in C configuration.
Since the BIMA observations detected very little CO emission from NGC 5395, the molecular gas does not appear to be strongly concentrated in compressed ridges where we expected to find strong shock fronts. We are left with the puzzle that the eastern half of the ring/pseudo–ring is brighter in radio continuum and H emission, whereas the western half has a higher column density of total gas.
Zhu et al. (1999) found an of Jy km s-1 (380 km s-1 FWHM) from the central NRAO 12–m pointing,666M. Zhu, private communication, points out that the value of the peak was misprinted in their Table 2A as 31.8 mK instead of 18.3 mK. but neither Onsala nor BIMA detect CO emission from the nuclear region of NGC 5395. The discrepancy between the Onsala and NRAO 12–m results at this location can be explained if most of the central CO emission seen by the NRAO 12–m comes from the dominant spiral arm on the eastern side of NGC 5395 (not the nucleus) and fills the NRAO beamwidth parallel to the major axis of the galaxy. The nucleus is also faint in the radio continuum (see Paper I).
10 Conclusions
The spiral galaxy NGC 5394 has suffered a recent, prograde, grazing encounter with the spiral galaxy NGC 5395 (Paper I). In NGC 5394, we find (1) 80% of the CO emission detected by BIMA comes from the central 800 pc starburst region, (2) the gas distribution in the disk is lopsided, with more CO, H, and HI emission from the western or southwestern side, and (3) CO and H emission are detected from the innermost western arm but not from the optically very bright, eastern or the outer–western inner–disk arms. The HI velocity dispersion in the disk is several times higher than in undisturbed spiral galaxies (see Paper I), and the CO velocity dispersion at the innermost western arm is somewhat higher than normal. These properties appear to result from the tidal encounter: in an encounter simulation that reproduces some of the main features of this galaxy pair, a considerable amount of gas in NGC 5394 falls into the central region early in the collision. Previous studies (Paper I) concluded that the galaxies IC 2163, NGC 2535, and NGC 5394 form three distinct stages in the development of structures in prograde, grazing encounters, with NGC 5394 the most evolved interaction in this set. Of the three, only NGC 5394 has a central starburst with a high concentration of molecular gas there, which suggests, for similar types of encounters, a central starburst may not develop until near the end of the ocular phase.
Star formation in the disk of NGC 5394 follows the gas distribution. Upper limits on the CO integrated intensity at the eastern inner–disk arm suggest that the instability parameter is presently too high for significant star formation there. So the question of why there is no evidence of ongoing star formation at the eastern inner–disk arm is really the question of why the distribution of molecular gas is lopsided. This is probably the result of an asymmetry in the collisional perturbation plus the gas losing angular momentum in shocks and may be related to the west versus east time lag in the development of the ocular oval in the model.
Kaufman et al. (1997) noted that widespread, high velocity dispersion in the HI gas is observed in the disks of a number of interacting spiral galaxies during an early phase of post–encounter evolution. With the BIMA observations of NGC 5394, we have some evidence that enhanced turbulence in the disk is also present in the molecular gas. The measured component of the velocity dispersion in NGC 5394 should represent mainly the –component. In NGC 5395, the broad CO linewidths in the NRAO 12-m observations by Zhu et al. (1999) indicate high velocity dispersions similar to those in the HI gas. Although molecular gas with high velocity dispersion has been found previously in merger remnants and in the nuclear regions of normal galaxies (Casoli et al., 1991; Bally et al., 1988), our results indicate that molecular gas with high velocity dispersion may also occur in the disks of galaxies involved in a grazing encounter.
If standard values are used for the conversion factor = and the dust–to–gas ratio, then the average extinction of the NGC 5394 starburst implied by the integrated CO intensity is a factor of 3 – 4 greater than that deduced from comparison of the radio continuum, H, and 60 µm luminosities. From this we conclude that the value of in the starburst is a factor of 3 – 4 below the standard value. This adds the starburst region in NGC 5394 to the list of nuclear starbursts in which the value of is below the standard value. The CO position–velocity diagram of the nucleus of NGC 5394 reveals two separate velocity features very close to the center. This may indicate a nuclear ring or the “twin peaks” of an inner ILR or some destruction of CO at the nucleus by photodissociation or consumption in star formation.
Very little of the CO emission detected from NGC 5395 in single–dish observations is seen in the BIMA data, and thus the molecular gas does not appear to be strongly concentrated in compressed ridges. We are left with the puzzle that on the eastern side of NGC 5395, the ring/pseudo–ring is brighter in radio continuum and H emission, whereas on the western side of NGC 5395, it has a higher column density of total gas.
References
- Aalto et al. (1995) Aalto, S., Booth, R. S., Black, J. H., & Johansson, L. E. B. 1995, A&A, 300, 369
- Aalto et al. (1997) Aalto, S., Radford, S. J. E., Scoville, N. Z., & Sargent, A. I. 1997, ApJ, 475, L107
- Adler, Allen, & Lo (1991) Adler, D. S., Allen, R. J., & Lo, K. Y. 1991, ApJ, 382, 475
- Alonso–Herrero et al. (2001) Alonso–Herrero, A., Engelbracht, C. W., Rieke, M. J., Rieke, G. H., & Quillen, A. C. 2001, ApJ, 546, 952
- Amram et al. (1989) Amram, P., Marcelin, M., Boulesteix, J., & Le Coarer, E, 1989, A&AS, 81, 59
- Arp (1969) Arp, H. 1969, A&A, 3, 418
- Athanassoula (1992a) Athanassoula, E. 1992a, MNRAS, 359, 328
- Athanassoula (1992b) Athanassoula, E. 1992b, MNRAS, 359, 345
- Bally et al. (1988) Bally, J., Stark, A. A., Wilson, R. W., & Henkel, C. 1988, ApJ, 324, 223
- Becker, White, & Helfand (1995) Becker, R. H., White, R, L., & Helfand, D. J. 1995, ApJ, 450, 559
- Benedict (1982) Benedict, G. F. 1982, AJ, 87, 76
- Bernlöhr (1993) Bernlöhr, K. 1993, A&A, 268, 25
- Bohlin, Savage, & Drake (1978) Bohlin, R. C., Savage, B. D., & Drake, J. F. 1978, ApJ, 224, 132
- Braine & Dumke (1998) Braine, J. & Dumke, M. 1998, A&A. 333, 38
- Brouillet & Schilke (1993) Brouillet, N. & Schilke, P. 1993, A&A, 277, 381
- Bushouse & Stanford (1992) Bushouse, H. A. & Stanford, S. A. 1992, ApJS, 79, 213
- Casoli et al. (1991) Casoli, F., Dupraz, C., Combes, F., & Karés 1991, A&A, 251, 1
- Casoli et al. (1998) Casoli, F., Sauty, S., Gerin, M., Boselli, A., Fouqué, P., Braine, J., Gavazzi, G., Lequeux, J., & Dickey, J. 1998, A&A, 331, 451
- Combes (1991) Combes, F. 1991, ARA&A, 29, 195
- Condon (1992) Condon, J. J. 1992, ARA&A, 30, 575
- Condon, Frayer, & Broderick (1991) Condon, J. J., Frayer, D. T., & Broderick, J. J. 1991, AJ, 101, 362
- Condon et al. (1990) Condon, J. J., Helou, G., Sanders, D. B., & Soifer, B. T. 1990, ApJS, 73, 359
- Dame, Hartmann, & Thaddeus, (2001) Dame, T. M., Hartmann, D., & Thaddeus, P. 2001, ApJ, 547, 792
- de Vaucouleurs et al. (1991) de Vaucouleurs, G., de Vaucouleurs, A., Corwin, H. G., Jr., Buta, R. J., Paturel, G., & Fouqué 1991, Third Reference Catalogue of Bright Galaxies (New York: Springer)
- Elmegreen et al. (1996) Elmegreen, B. G., Elmegreen, D. M., Chromey, F. R., Hasselbacher, D. A., & Bissell, B. A. 1996, AJ, 111, 2233
- Elmegreen et al. (2000) Elmegreen, B. G., et al. 2000, AJ, 120, 630
- Elmegreen et al. (1995a) Elmegreen, B. G., Sundin, M., Kaufman, M., Brinks, E., & Elmegreen, D. M. 1995a, ApJ, 453, 139
- Elmegreen et al. (1995b) Elmegreen, D. M., Kaufman, M., Brinks, E., Elmegreen, B. G., & Sundin, M. 1995b, ApJ, 453, 100
- Elmegreen et al. (2001) Elmegreen, D. M., Kaufman, M., Elmegreen, B. G., Brinks, E., Struck, C., Klaric, M., & Thomasson, M. 2001, AJ, 121, 182
- Golla, Allen, & Kronberg (1996) Golla, G., Allen, M. L., & Kronberg, P. P. 1996, ApJ, 473, 244
- Horellou & Booth (1997) Horellou, C. & Booth, R. S. 1997, A&AS, 126, 3
- Karachentsev (1980) Karachentsev, I. D. 1980, ApJS, 44, 137
- Kaufman et al. (1999a) Kaufman, M., Brinks, E., Elmegreen, B. G., Elmegreen, D. M., Klarić, M., Struck, C., Thomasson, M., & Vogel, S. 1999a, AJ, 118, 1577 (Paper I)
- Kaufman et al. (1997) Kaufman, M., Brinks, E., Elmegreen, D. M., Thomasson, M., Elmegreen, B. G., Struck, C., & Klarić, M. 1997, AJ, 114, 2323
- Kaufman et al. (1999b) Kaufman, M. J., Wolfire, M. G., Hollenbach, D. J., & Luhman 1999b, ApJ, 527, 795
- Keel et al. (1985) Keel, W. C., Kennicutt, R. C., Jr., Hummel, E., & van der Hulst, J. M. 1985, AJ, 90, 708.
- Kennicutt (1989) Kennicutt, R. C., Jr. 1989, ApJ, 344, 685
- Kennicutt (1998) Kennicutt, R. C., Jr. 1998, ARA&A, 36, 189
- Leech et al. (1989) Leech, K. J., Penston, M. V., Terlevich, R., Lawrence, A., Rowan–Robinson, M., & Crawford, J. 1989, MNRAS, 240, 349
- Martin & Kennicutt (2001) Martin, C. L. & Kennicutt, R. C., Jr. 2001, ApJ, 555, 301
- Nakai et al. (1987) Nakai, N., Hayashi, M., Handa, T., Sofue, Y. & Hasegawa, T. 1987, PASJ, 39, 685
- Nordgren et al. (1997) Nordgren, T. E., Chengalur, J. N., Salpeter, E. E., & Terzian, Y. 1997, AJ, 114, 77
- Persson & Helou (1987) Persson, C. J. L., & Helou, G. 1987, ApJ, 314, 513
- Regan (2000) Regan, M. W. 2000, ApJ, 541, 142
- Regan, Sheth, & Vogel (1999) Regan, M. W., Sheth, K., & Vogel, S. N. 1999, ApJ, 526, 97
- Rieke et al. (1993) Rieke, G. H., Loken, K., Rieke, M. J., & Tamblyn, P. 1993, ApJ, 419, 99
- Sandage & Bedke (1988) Sandage, A. & Bedke, J. 1988, in Atlas of Galaxies (Washington, D. C.: NASA)
- Sault, Teuben, & Wright (1995) Sault, R. J., Teuben, P. J., & Wright, M. C. H. 1995, in Astronomical Data Analysis Software and Systems IV, eds, R. A. Shaw, H. E. Payne, & J. J. E. Jayes, A. S. P. Conference Series, 77, 433
- Seaquist & Clark (2001) Seaquist, E. R., & Clark, J. 2001, ApJ, 552, 133
- Shen & Lo (1995) Shen, J., & Lo, K. Y. 1995, ApJ, 445, L99
- Shier, Rieke, & Rieke (1994) Shier, L. M., Rieke, M. J., & Rieke, G. H. 1994, ApJ, 483, 148
- Shopbell & Bland–Hawthorn (1998) Shopbell, P. L. & Bland–Hawthorn, J. 1998, ApJ, 493, 129
- Smith et al. (1991) Smith, P. A., Brand, P. W. J. L., Mountain, C. M., Puxley, P. J., & Nakai, N. 1991, MNRAS, 252, 6P
- Sodroski et al. (1995) Sodroski, T. J. et al. 1995, ApJ, 452, 262
- Steer, Dewdney, & Ito (1984) Steer, D. G., Dewdney, P. E., & Ito, M. R. 1984, A&A, 137, 159
- Strong & Mattox (1996) Strong, A. W. & Mattox, J. R. 1996, A&A, 308, L21
- Strong et al. (1988) Strong, A. W., Bloemen, J. B. M., Dame, T. M., Grenier, I. A., Hermsen, W., Lebrun, F., Nyman, L.-Å, Pollock, A. M. T., & Thaddeus, P. 1988, A&A, 207, 1
- Vanzi, Alonso–Herrero, & Rieke (1998) Vanzi, L., Alonso–Herrero, A., & Rieke, G. H. 1998, ApJ, 504, 93
- Wall et al. (1993) Wall, W. F., Jaffe, D. T., Bash, F. N., Israel, F. P., Maloney, P. R., & Bassa, F. 1993, ApJ, 414, 98
- Wild et al. (1992) Wild, W, Harris, A. I., Eckart, A., Genzel, R., Graf, U. U., Jackson, J. M., Russell, A. P. G., & Stutzki, J. 1992, A&A, 265, 447
- Wong & Blitz (2000) Wong, T. & Blitz, L. 2000, ApJ, 540, 771
- Wray (1988) Wray, J. D. 1988, The Color Atlas of Galaxies (Cambridge: Cambridge Univ. Press)
- Zhu et al. (1999) Zhu, M., Seaquist, E. R., Davoust, E., Frayer, D. T., & Bushouse, H. A., 1999, AJ, 118, 145


| Parameter | Value | Reference |
|---|---|---|
| Morphological Type | SB(s)b pec | 1 |
| Radio continuum nucleus | ||
| Right Ascension (1950.0) | 1 | |
| Declination (1950.0) | 1 | |
| Isophotal major radius | 1 | |
| 13.70 | 1 | |
| Optical | km s-1 | 1 |
| Distance | 47 Mpc | 2 |
| Linear scale | 230 pc arcsec-1 | 2 |
| Disk inclination | ∘ | 6 |
| Projection line of nodes | ∘ | 2 |
| M⊙ | 2 | |
| Single–dish CO flux | 168 Jy km s-1 | 2 |
| Semi–major axis of primary bar | 2 | |
| Position angle of bar major axis | 120∘ | 2 |
| 1.40 GHz flux density | 34.8 mJy | 2 |
| 4.86 GHz flux density | 15 mJy | 3 |
| Central starburst | ||
| 1.45 GHz flux density | 29 mJy | 4 |
| H flux | erg cm-2 s-1 | 5 |
| Parameter | Value |
|---|---|
| Date of Observation | 1999 June 4 |
| Configuration | C |
| Synthesized Beam (HPBW, P.A.) | |
| Pointing Centers | |
| R.A., DEC (1950) | |
| R.A., DEC (1950) | |
| rms noise per channel | 80 mJy beam-1 = 0.18 K |
| Equivalent for 1 Jy beam-1 | 2.21 K |
| Central velocity | 3497 km s-1 |
| Velocity resolution | 4.06 km s-1 |
| Hanning–smoothed channel width | 10 km s-1 |
| Total bandwidth | 908 km s-1 |
| Primary Beam (HPBW) | |
| Largest scale size visible to array |
| Wavelength | Source SizeaaFrom Gaussian fit to emission, deconvolved from point spread function | Resolution |
|---|---|---|
| (FWHM, P.A.) | (HPBW) | |
| 20 cm radio continuum | , 66∘ | |
| H | , 118∘ | |
| CO | , 148∘ |