The Gravitational Lens – Galaxy Group Connection: I. Discovery of a Group Coincident with CLASS B0712+472
Abstract
Previous observations of the environments of the lensing galaxies in gravitational lens systems suggest that many of the lensing galaxies are associated with small groups of galaxies. As a result, we have begun a coordinated program to study the local environments of all known gravitational lens systems. In this paper, we present results on the gravitational lens system CLASS B0712+472, which has previously measured source and lens redshifts of . Although we have not found a galaxy group associated with the primary lensing galaxy, we have found a foreground group which is spatially coincident with the lens system. Based on multi-object spectroscopy taken at the Keck 10-m telescope, we have confirmed ten group members with a mean redshift of . The resulting velocity dispersion and estimated virial mass are km s-1 and , respectively, for . The dynamical properties of this moderate-redshift group are completely consistent with the range of values found in nearby groups of galaxies. Five of the group members are red, elliptical-like galaxies, while the remaining five are active, star-forming galaxies. Based on the spectroscopic results and the publically-available Hubble Space Telescope imaging of nine group members, we find that the early-type fraction is 40%. We estimate that the effect of this foreground group on the gravitational lensing potential of B0712+472 is small, producing an external shear which is only a few percent, although the shear could be larger if the group centroid is significantly closer to the lens system than it appears to be.
1 Introduction
Studies of the large scale structure in the local universe indicate that a significant fraction of galaxies reside in groups. Redshift surveys out to find that 50 – 60% of galaxies are members of groups, with the most common systems being small, loose groups with 4 to 5 galaxies (Turner & Gott, 1976; Geller & Huchra, 1983; Tully, 1987; Ramella et al., 1989). As such, small groups of galaxies make a substantial contribution to the total mass of the universe and constitute the most common galaxy environment. Groups of galaxies have been well-studied at low redshifts (e.g., Tully, 1987; dell’Antonio, Geller, & Fabricant, 1994; Mulchaey et al., 1996; Mahdavi et al., 1997; Zabludoff & Mulchaey, 1998). However, little work has been done on more distant groups of galaxies because the modest optical overdensities of small groups make them difficult to detect at intermediate and high redshift.
Recent data suggest that gravitational lens systems may provide a method for finding moderate and high-redshift groups of galaxies. Specifically, observations of four gravitational lens systems (MG 0751+2716, PG 1115+080, MG 1131+0456, and JVAS B1422+231) have detected and spectroscopically confirmed groups of galaxies which are associated with the primary lensing galaxy (Kundić et al., 1997a, b; Tonry, 1998; Tonry & Kochanek, 1999, 2000). In addition, there are at least two lens systems (CLASS B1359+154 and a second group for MG 1131+0456) for which the high spatial density and colors of the galaxies close to the lens system suggest the presence of a group (Rusin et al., 2001; Kochanek et al., 2000a). All of these groups are compact, with at least three members within a projected radius of 30″ (within 17 in the case of B1359+154). We note that several gravitational lenses are associated with more massive systems, namely clusters of galaxies. The most famous example is the first gravitational lens to be discovered Q0957+561 (Walsh et al., 1979; Young et al., 1980). However, the project described in this paper is concerned only with small groups of galaxies.
Although these data are not conclusive, they strongly suggest that the primary lensing galaxies in gravitational lens systems are associated with groups of galaxies, implying that a larger association of galaxies may contribute to the lensing mass distribution. In addition, Blandford, Surpi, & Kundić (2001) analyze the lensing rates in the Hubble Deep Field North (HDF-N; Williams et al., 1996) and find that the number of multiple-imaged galaxies is an order of magnitude smaller than predicted on the basis of radio lens surveys. They argue that this strong deficit of gravitational lenses in the HDF-N (Zepf et al., 1997; Blandford, 1998) is associated with the subsequent lack of elliptical–group combinations at , the most likely redshift for lensing. Hence, they postulate that most galaxy lenses are located in compact groups. Similarly, an analysis based on the relationship between galaxy types and their local environment by Keeton, Christlein, & Zabludoff (2000) suggests that at least 25% of gravitational lenses should be found in groups or clusters.
Searches for gravitational lens are biased toward high mass systems because these systems have a larger cross-section for lensing. Consequently, theoretical analyses predict that most gravitational lenses will be early-type (elliptical or S0) galaxies (e.g., Turner, Ostriker, & Gott, 1984; Fukugita & Turner, 1991; Maoz & Rix, 1993; Kochanek, 1993) because these galaxies are more massive than spirals. Some spiral galaxy lenses have been detected (e.g., Carilli, Rupen, & Yanny, 1993; Jaunsen & Hjorth, 1997; Jackson, Nair, & Browne, 1998). However, high angular-resolution images from the Hubble Space Telescope (HST) show that most lensing galaxies have properties consistent with those of early-types (e.g., Keeton et al., 1998; Kochanek et al., 2000b). In the nearby universe early-type galaxies are preferentially found in groups or clusters (e.g., Dressler, 1980; Zabludoff & Mulchaey, 1998). If this correlation continues to higher redshift, a large fraction of gravitational lenses may be found in groups of galaxies. The mean redshift for gravitational lenses is . Thus, if the lens–group association is valid, gravitational lens systems can be used to study groups of galaxies in a redshift range which has been largely unexplored. In addition, the major source of uncertainty in measurements from gravitational lenses is the modeling of the lensing potential (e.g., Koopmans & Fassnacht, 1999). If galaxy groups contribute significantly to the lensing mass distribution or to an external shear, the group mass needs to be measured. A spectroscopic survey and the resulting velocity dispersion measurements are the most practical way to achieve this end.
In light of this, we have begun a coordinated effort to study the link between groups of galaxies and gravitational lenses. Specifically, we are obtaining photometric and spectroscopic data on the fields surrounding all lens systems where both the source and lens redshift are currently known. Our ground-based program is complemented by the extensive set of gravitational lens images in the HST archive. Many of the archival images were obtained by CfA-Arizona Space Telescope Lens Survey team (CASTLES111See http://cfa-www.harvard.edu/castles; Muñoz et al., 1998; Falco et al., 2001), which is conducting a program to obtain uniform multi-band (, , and ) HST images of all known lens systems.
In this paper, we present the results from observations of the field surrounding the gravitational lens system CLASS B0712+472. Unless otherwise noted, we use to express the value of the Hubble Constant, where , and assume , and .
2 CLASS B0712+472
The B0712+472 gravitational lens system was discovered by Jackson et al. (1998) as part of the Cosmic Lens All-Sky Survey (CLASS; Browne et al., 2001; Myers et al., 2001). The maximum separation of the four lensed images is 127, and the flux density ratios at 15 GHz are for components , respectively. High-resolution radio maps from the Very Large Array (VLA) and the Multiple-Element Radio-Linked Interferometer (MERLIN) do not resolve the four images (Jackson et al., 1998). Images taken with the Wide Field Planetary Camera 2 (WPFC2) aboard HST show the three brightest images of the background source; in addition, the lensing galaxy is detected with optical magnitudes of and in an elliptical aperture with major and minor axes of 2″ and 1″, respectively (Jackson et al., 1998). Images obtained with the Near-Infrared Camera/Multi-Object Spectrograph (NICMOS) aboard HST are similar to the WFPC2 images but show, additionally, the fourth lensed image (image D) and a faint arc produced by the host galaxy of the background quasar (Jackson, Xanthopoulos, & Browne, 1998).
Preliminary spectroscopic observations of lens system were taken at the William Herschel Telescope (Jackson et al., 1998); however, the definitive measurement of the system redshifts were made by Fassnacht & Cohen (1998) using the Low Resolution Imaging Spectrograph (LRIS; Oke et al., 1995) on the Keck telescopes. The resulting source and lens redshifts are . The background source exhibits broad C III] and Mg II emission lines typical of a quasar spectrum. The lensing galaxy has an early-type spectrum which is characterized by a moderately strong 4000Å break, small equivalent width Balmer absorption lines, and no [O II] emission. The observed image splitting in B0712+472 implies that the mass and mass-to-light of the lensing galaxy within the Einstein ring radius are and , respectively, for (Fassnacht & Cohen, 1998).
3 Observations
3.1 Broad-Band Optical
3.1.1 Palomar 60–in
Preliminary photometric observations were taken on January 3-4 and April 1-2, 2000 with the CCD camera on the Palomar 60–in (1.5–m) telescope. The camera covers a field-of-view of . The field containing the lens system was imaged in the three filters, Gunn , , and . The total exposure times were sec in , respectively. The average seeing during these observations was 15. We calibrated the Palomar images to the Gunn photometric system through exposures on several Gunn standards (Thuan & Gunn, 1976). The typical variations about the nightly photometric transformations are 0.08 mag or less.
Object detection, cataloging, and photometry were performed on the final images using the software package SExtractor (Bertin & Arnouts, 1996). We adopted a fixed detection threshold of 1.5-. This threshold corresponds to a surface brightness of approximately . A Gaussian filter with a FWHM of 11 and a minimum detection area of were used. The objects detected in each image were visually inspected, so that spurious detections (e.g., cosmic rays or diffraction spikes) could be removed from the catalog. The number of spurious detections corresponded to 10–15% of all detections. The resulting object catalog contains 996 objects. For each object, we have measured a total magnitude, an aperture magnitude within a circular aperture of radius 3″, and a star–galaxy classification (see Bertin & Arnouts, 1996). We reach approximate limiting magnitudes of , , for a 5- detection in our standard circular aperture.
3.1.2 Keck 10–m
Higher-quality photometric observations were obtained on January 17-19, 2001 with LRIS on the Keck I telescope. LRIS covers a field-of-view of . Data were taken in three broad band filters, , which match the Cousins system well. The total exposure times were sec in , respectively. The Keck observations were calibrated to the standard Cousins-Bessell-Landolt (Cape) system through exposures on a number of Landolt standard star fields (Landolt, 1992). As in the processing of the Palomar 60–in data, the SExtractor package was used to detect, classify, and obtain aperture and total magnitudes for all objects in the co-added images. The detection thresholds in the three bands were .
For the color analysis presented in this paper, we use aperture magnitudes computed in a circular aperture with a radius of from these Keck observations. This corresponds to a physical radius of at , the redshift of the lensing galaxy in B0712+472. The final catalog contains 986 objects. The approximate limiting magnitudes are , , and for a 5- detection in our standard aperture. Because of the smaller field-of-view of LRIS compared to the Palomar 60-in camera, some of our spectroscopic targets (see §3.2) do not have available LRIS imaging. Those for which LRIS imaging is available are listed in Table 1; those without LRIS imaging are listed separately in Table 2 (see §4).
3.2 Spectroscopic
The spectroscopic observations were performed on March 28, 2000 and January 17-19, 2001 with LRIS on the Keck I telescope. Multi-slit and long-slit observations of galaxies in the B0712+472 field were made with LRIS in spectroscopic mode using an grating blazed at 5000 Å. The chosen grating provided a dispersion of 2.44 Å per pixel and a spectral coverage of 5100 Å. The grating angle was set in order to provide coverage from approximately 4400 Å to 9500 Å. In order to obtain the full wavelength range along the dispersion axis, the field-of-view of the multislit spectral observations was reduced to approximately . Conditions during the March 2000 observations consisted of light to moderate cirrus and marginal seeing which ranged from 10 to 15. The weather during the January 2001 observations was predominately clear with only thin cirrus at times. The seeing ranged from 07 to 10.
Spectroscopic candidates were chosen from the Palomar imaging. First, we included only those objects which were classified as galaxies by SExtractor (a star–galaxy classification of ; see Bertin & Arnouts, 1996). Secondly, we wanted to target specifically those galaxies which were most likely associated with the lens and, therefore, at the same redshift. To achieve this, we selected galaxies which had similar colors, , to the lensing galaxy. The measured color of the lensing galaxy from the Palomar 60-in imaging is . This color is consistent with the color measured from the existing WFPC2 images (see §2) and with a no-evolution model of an elliptical galaxy at the lens redshift (e.g., Fukugita, Shimasaku, & Ichikawa, 1995).
Two slitmasks were made for this lens field. In selecting objects for the slitmask, those galaxies that had similar colors and were spatially close to the lensing galaxy were weighted most heavily. Galaxies which were bluer or redder than our original color cut were also included (though with lower weights) in order to optimize the total number of objects per mask. A slit width of 10 and a minimum slit length of 20″ were used. In the end, we obtain 25 and 29 objects, respectively, on the two masks. The first mask was observed during the March 2000 run. Two exposures of equal duration were taken with a total exposure time of 2400 sec. The second slitmask was observed during the January 2001 run with three exposures of equal duration for a total exposure time of 5400 sec.
In addition to the slitmasks, we have also used the 10 long-slit, which is in length, to observe galaxies which were very close to the lensing galaxy and which were not included on either of the two slitmasks. Three long-slit positions were observed, each covering two galaxies. Two exposures of equal duration were taken at each position. The total exposure times were 2400, 3600, and 2400 seconds for the first, second, and third long-slit position, respectively.
To calibrate both the multi-slit and long-slit observations, flat-fielding and wavelength calibration were performed using internal flat-field and arc lamp exposures which were taken after each science exposure. Observations of the Oke (1990) spectrophotometric standard stars Feige 34 and G191B2B were used to remove the response function of the chip.
4 Results
In Tables 1 & 2, we present the observed parameters, including distance from the lensing galaxy, the magnitudes and colors from either the Keck 10-m or Palomar 60-in observations, and the measured redshift, for all galaxies which were spectroscopically observed in the B0712+472 field. The redshift uncertainties have been estimated by taking the RMS scatter in the redshifts calculated from the individual spectral lines.
In Figure 1, we plot the resulting distribution of redshifts (excluding Galactic stars) in the B0712+472 field. The redshift distribution shows a peaky structure which is typical of larger pencil beam surveys (e.g., Cohen et al., 1996). In addition, there is one significant peak in the distribution. While we have not detected a group of galaxies associated with the lensing galaxy at , we have detected a foreground group, consisting of ten galaxies with a mean redshift of .
4.1 Global Group Properties
Using the redshifts of the ten group members, we measure a group velocity dispersion (corrected for cosmological effects) of km s-1. This velocity dispersion has also been corrected for redshift measurement errors which are typically about 100 km s-1 (see Table 1). We compute the uncertainty in the dispersion according to the prescription of Danese, de Zotti, & di Tullio (1980), which assumes that the errors in velocity dispersions can be modeled as a distribution and that a galaxy’s velocity deviation from the mean group redshift is independent of the galaxy’s mass (i.e., the group is virialized). For more details, see §3 of Postman, Lubin, & Oke (1998). Figure 2 shows the histogram of velocity offsets for the groups members and the best-fit Gaussian to the distribution.
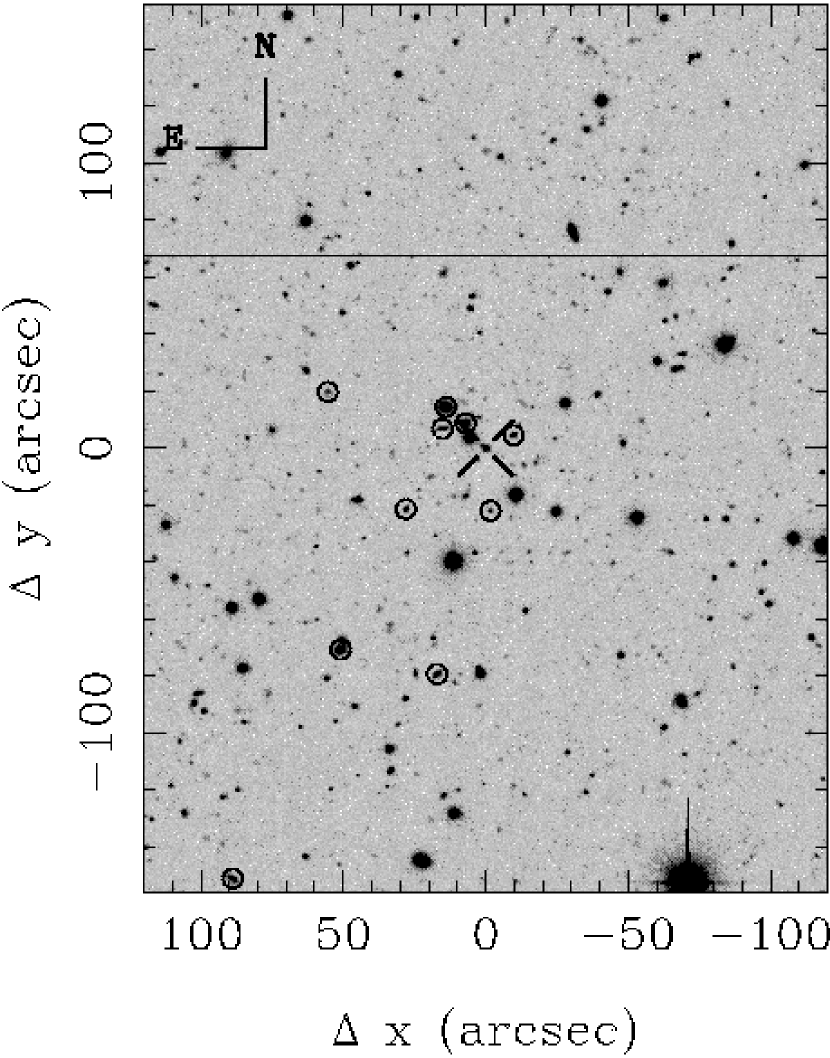
Figure 3 shows the position of these galaxies, relative to the lensing galaxy in B0712+472, on the composite band image. The spatial distribution of the group galaxies is reasonably compact with a harmonic radius of Mpc and is centered close to the gravitational lens system. The radius and velocity dispersion of the group imply a virial mass of and a crossing time (in units of the Hubble time) of . This short crossing time is indicative of a bound system of galaxies, such as a group or rich cluster (Ramella et al., 1989).
The properties of this distant group are completely consistent with the range of values found in nearby groups of galaxies (e.g., Geller & Huchra, 1983; Tully, 1987; Ramella et al., 1989; Zabludoff & Mulchaey, 1998). For example, Ramella et al. (1989) have studied 92 galaxy groups at km s-1. For the 36 rich groups which contain 5 or more members, they find that their mean properties are km s-1, Mpc, and , respectively. We have estimated the dispersion on each parameter as , where IQR is the interquartile range listed in Table 6 of Ramella et al. (1989).
4.2 Properties of the Group Galaxies
Figures 4 and 5 show the spectra of the ten member galaxies. Five of the ten galaxies are active, star-forming galaxies (Figure 4). Their spectra are characterized by strong emission lines, including [O II], [O III], , and/or . The rest-frame [O II] (or in the case of galaxy G+016+007) equivalent widths are all in excess of 20Å. The remaining five galaxies are elliptical-like in nature (Figure 5). They exhibit classic K-star absorption features, including Ca II H & K, and/or G-band absorption. These spectra show little or no [O II] emission with rest-frame equivalent widths of less than 15Å.
In Figure 6, we plot the color-magnitude diagrams (CMDs) obtained from the Keck imaging of the field containing B0712+472. The lensing galaxy and the ten galaxies which are members of the foreground group are indicated. In the versus CMD there is a reasonably well-defined sequence of galaxies which is redder () than the typical blue, field galaxy (). This red sequence includes the lensing galaxy at , as well as the five elliptical-like galaxies in the foreground group at . The average colors of the five foreground galaxies are and .
Of the remaining five group members, four are significantly bluer, as expected from their star-forming spectral features. Their average colors are and . The final galaxy classified as star-forming is G+016+007. Although its spectrum exhibits Ca II H & K absorption, it also contains relatively strong [O II] and emission (see Figure 4) with rest-frame equivalent widths of and 23Å, respectively. The galaxy’s colors, however, are noticeably redder than the other four active galaxies. Here, and . These results may indicate a galaxy with a relatively old stellar population which has recently undergone a burst of star formation due to an interaction or merger.
Local galaxy groups follow a well-established correlation between early-type fraction and velocity dispersion (Hickson, Kindl, & Huchra, 1988; Zabludoff & Mulchaey, 1998). As the velocity dispersion increases from 100 to 450 km s-1, the early-type fraction increases from effectively zero to 55%. These measures include all () member galaxies that are brighter than to and are within a radius of Mpc (Zabludoff & Mulchaey, 1998). Based on the local correlation, we expect the early-type fraction for our moderate-redshift group to be approximately . From the spectroscopic data, we find that five (out of ten) galaxies have spectra which are typical of early-type galaxies, while the remaining five galaxies are star-forming, implying that they are most likely late-type (spiral or irregular) galaxies. This suggests an early-type fraction of 50%, which is on the high end of that expected from the local correlation. This result, however, may not be statistically significant because the scatter in the local correlation is reasonably large (see Figure 7 of Zabludoff & Mulchaey, 1998). More importantly, our survey does not reach the faint magnitudes of the local observations. If we apply a magnitude limit more typical of our survey () to the local group data, we see an increase in the early-type fraction associated with a given velocity dispersion, although the scatter in the relationship also increases. This is not unexpected since the brightest galaxies in groups are normally early-types. For the groups with the highest velocity dispersion, the early-type fraction approaches 80% or more.
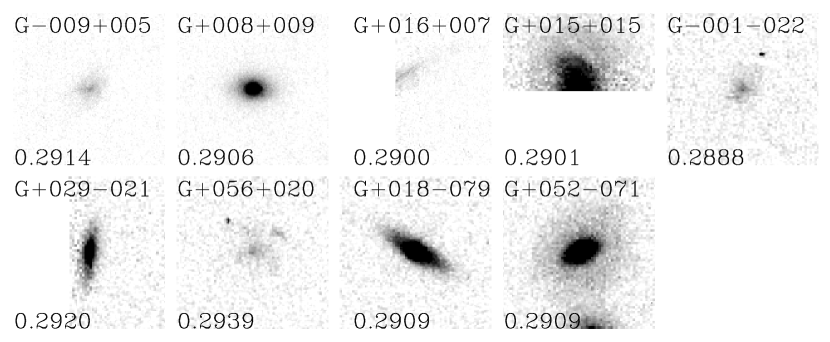
To measure accurately the early-type fraction, we need visual classifications of the group galaxies. Fortunately, we can measure these morphologies for all but one of the group members through the publically-available HST images. The WFPC2 observations of B0712+472 were taken as part of two separate programs, GO-5908 (PI Jackson) and GO-9133 (PI Falco, as part of the CASTLES program). We have chosen to analyze the GO-9133 observations because the exposure times are longer, the images have been dithered in three positions to improve the angular resolution, and the position angle provides a more beneficial field-of-view. The observations were taken in the F555W and F814W filters for a total exposure time of 2200 seconds each. We have reduced these data using the “drizzle” software (Fruchter & Hook, 1997) given in the STSDAS package ditherII. Nine of the ten group members fall within the WFPC2 field-of-view. We have used data in the reddest band F814W to make a visual classification of these galaxies based on the Revised Hubble scheme (e.g., Sandage, 1961; Sandage & Bedke, 1994). The classifications (and other information; for details, see Smail et al., 1997; Lubin et al., 1998) are listed in Table 3.
Figure 7 shows the postage stamp images of each galaxy. The four galaxies which have very strong [O II] and/or emission (G–009+005, G+016+007, G–001–022, G+056+020; see Figure 4) are classified as late-type spiral galaxies. The remaining five galaxies which have elliptical-like spectra, with little or no [O II] emission (G+008+009, G+015+015, G+029–021, G+018–079, G+052–071; see Figure 5), are classified as either elliptical, S0 or Sa galaxies. The only galaxy for which we do not have a visual classification, G+089–151, is the one which is farthest from the lens system. This galaxy has extremely strong , , and [O III] emission and is, therefore, almost certainly a late-type (spiral or irregular) galaxy. Based on this evidence, we conclude that the early-type fraction is 40% and that the morphological content of this moderate-redshift group is consistent (within the uncertainties) with that of nearby groups of galaxies.
5 Effect on Gravitational Potential
The presence of a group of galaxies centered close to a gravitational lens system will perturb the lensing gravitational potential and affect the lensed images of the background source. The effect of the group mass distribution on the main gravitational potential may be expressed in terms of an additional convergence () and shear (). The convergence describes the isotropic component of the magnification of an image produced at a position , while the shear describes the anisotropic distortion of the image. Some lens systems require a strong shear component in order to produce the observed image configuration. Particularly notable is the JVAS B1422+231 system, in which the early lens models required a strong external shear (e.g., Hogg & Blandford, 1994; Keeton et al., 1997), possibly in addition to an extremely flattened mass distribution in the primary lensing galaxy (Kormann, Schneider, & Bartelmann, 1994). Later observations found a group of galaxies that provided the necessary external shear (Kundić et al., 1997b). A simple singular isothermal sphere (SIS) plus external shear model for the CLASS B0712+472 system suggests that the external shear in this system should be small (; Keeton et al., 1998). We note that this model is not a particularly good fit to the observations (; Keeton et al., 1998) and might be improved by a multiple-shear model (e.g., Keeton et al., 1997). However, it is probably correct in indicating that a very large external shear is not needed for this system.
We can estimate the shear contribution of the foreground group to CLASS B0712+472 and compare it to the predicted value. We make the approximation that the group gravitational potential is that produced by a SIS. The SIS has a particularly simple analytic expression for , namely,
where is the critical radius of the SIS and is the distance from the center of the SIS, both expressed in angular units. For a SIS with one-dimensional velocity dispersion, , lensing a background source at a redshift , the critical radius (Einstein ring radius) is
Here, and are the angular diameter distances from the SIS to the background source and from the observer to the background source, respectively. The ratio of these distances is a function of the redshifts of the SIS and the background source and has a weak dependence on the cosmological model given by and . For the group of galaxies discussed in this paper, the velocity dispersion is and the redshifts are and for the group and the background source, respectively. To explore the dependence on the cosmological model, we calculate for three common models: = (1.0,0.0), (0.2,0.0), and (0.2,0.8). The resulting critical radii are 176, 177, and 197, respectively. The convergence and shear produced by the group at the position of the lens system, for the three cosmologies considered, are:
where is the angular distance from the group center to the lens system, in arcseconds.
The effect of the foreground group on the gravitational lensing potential depends critically on . Unfortunately, this quantity is not well determined because the position of the group center is not clear. A simple calculation of the luminosity-weighted centroid of the group gives , and thus , which is consistent with the value predicted by Keeton et al. (1998). However, with only ten galaxies known to be in the group, this number is subject to the effects of small-number statistics. For example, by excluding the galaxy most distant from the lens system, the luminosity-weighted group centroid shifts significantly closer to the lens, giving and .
In addition, the luminosity-weighted centroid is almost certainly biased toward the south of the lens system. This bias arises because a fifth-magnitude star lies 6′ to the north-northwest of the lens. Scattered light from this star strongly contaminated our Palomar 60-in images. In order to reduce the effect of the scattered light to a reasonable level, we centered our images 4′ to the south of the lens system. The horizontal line in Figure 3 indicates the northern limit of the Palomar 60-in images. Because we had no information about galaxies north of this line, they were not included on the slitmasks. It is likely that the Keck images, which are much less affected by the scattered light, will provide good candidate group members to the north of the lens system. The inclusion of these galaxies could shift the group centroid farther to the north and closer to the lens system.
A final estimate of , and thus , can be obtained by exploiting a relationship seen in nearby groups of galaxies. In local galaxy groups for which diffuse X-ray emission has been detected, the brightest group galaxy (BGG) is located at the center of the group potential (Zabludoff & Mulchaey, 1998). Thus, if the CLASS B0712+472 foreground group is virialized, the distance from the BGG to the lens system should be a good estimator of . Our survey of the group members is far from complete due to the northern cutoff in our galaxy selection and the sparseness of our spectroscopic coverage. However, for the purposes of our rough estimate, we can assume that the brightest galaxy known to be in the group (G+015+015, with ) is the BGG. This would imply that ″ and, thus, .
Unless further observations significantly increase the number of galaxies known to be in this group, it is unlikely that the optical observations alone will adequately determine the location of the center of the group gravitational well. A sensitive X-ray observation with XMM or Chandra, which would provide a measure of the total and gas mass distribution, could give a much more accurate location for the group centroid.
6 Conclusion
We present the first results from our observational program which seeks to exploit the gravitational lens–galaxy group connection to find and study moderate to high-redshift groups of galaxies. We have surveyed the field surrounding the gravitational lens system B0712+472 and have found a foreground group of galaxies at which is coincident with the lensing galaxy. The small group, which contains 10 member galaxies, has dynamical and morphological properties which are consistent with those of local groups of galaxies. We estimate that the effect of the foreground group on the gravitational lensing potential of B0712+472 is small. Based on the simplest model, that of a singular isothermal sphere, the group produces an external shear which is only a few percent. However, the magnitude of the shear is reasonably uncertain because it is inversely proportional to the distance between the group center and the lens system. Based on the relatively small number of confirmed group members, this distance is uncertain by at least a factor of 2.
Currently, there are five spectroscopically-confirmed groups (as opposed to massive clusters) detected by their association with gravitational lens systems. In Table 4, we list the properties of all five groups, including the one presented in this paper. Remarkably, the redshift of each group is . Each is quite compact with harmonic radii less than Mpc. Based on the small number of confirmed group members, we find that the velocity dispersions range by more than an order of magnitude, from km s-1. However, the smallest velocity dispersion is highly uncertain because the group, that associated with MG 0751+2716, has only three confirmed members. Further studies of these systems are clearly required in order to make accurate measurements of the dynamical properties of the groups, as well as the spectral and morphological properties of their member galaxies. Because all five groups have very similar redshifts, they comprise an unique sample in which to study the diversity of group properties at this redshift.
References
- Bertin & Arnouts (1996) Bertin, E. & Arnouts, S. 1996, A&A, 117, 393
- Blandford (1998) Blandford, R. D. 1998, Ap&SS, 261, 233
- Blandford, Surpi, & Kundić (2001) Blandford, R. D., Surpi, G., & Kundić, T. 2001, in Gravitational Lensing: Recent Progress and Future Goals, eds. T. G. Brainerd, & C. S. Kochanek, 65
- Browne et al. (2001) Browne, I. W. A. et al. 2001, in Gravitational Lensing: Recent Progress and Future Goals, eds. T. G. Brainerd, & C. S. Kochanek, 15
- Carilli, Rupen, & Yanny (1993) Carilli, C. L., Rupen, M. P., & Yanny, B. 1993, ApJ, 412, L59
- Cohen et al. (1996) Cohen, J. G., Cowie, L. L, Hogg, D. W., Songaila, A., Blandford, R., Hu, E. M., & Shopbell, P. 1996, ApJ, 471, L5
- Danese, de Zotti, & di Tullio (1980) Danese, L., de Zotti, G., & di Tullio, G. 1980, A&A, 82, 322
- dell’Antonio, Geller, & Fabricant (1994) dell’Antonio, I. Geller, M. J., & Fabricant, D. G. 1994, AJ, 107, 427
- Dressler (1980) Dressler, A. 1980, ApJ, 236, 351
- Falco et al. (2001) Falco, E. E., Kochanek, C. S., Lehár, J., McLeod, B. A., Muñoz, J. A., Impey, C. D., Keeton, C. R., Peng, C. Y., & Rix, H.-W. 2001, in Gravitational Lensing: Recent Progress and Future Goals, eds. T. G. Brainerd, & C. S. Kochanek, 25
- Fassnacht & Cohen (1998) Fassnacht, C. D. & Cohen, J. G. 1998, AJ, 115, 377
- Fruchter & Hook (1997) Fruchter, A. S. & Hook, R. N. 1997, SPIE, 3164, 120
- Fukugita, Shimasaku, & Ichikawa (1995) Fukugita, M., Shimasaku, K., Ichikawa, T. 1995, PASP, 107, 945
- Fukugita & Turner (1991) Fukugita, M. & Turner, E. L. 1991, MNRAS, 253, 99
- Geller & Huchra (1983) Geller, M. J. & Huchra, J. P. 1983, ApJS, 52, 61
- Hickson, Kindl, & Huchra (1988) Hickson, P., Kindl, E., & Huchra, J. P. 1988, ApJ, 329, 65
- Hogg & Blandford (1994) Hogg, D. W. & Blandford, R. D. 1994, MNRAS, 268, 889
- Jackson, Nair, & Browne (1998) Jackson, N., Nair, S., & Browne, I. 1998, in Observational Cosmology with the New Radio Surveys, eds. M.N. Bremer, N. Jackson, & Perez-Fournon, I., (Dordrecht: Kluwer Academic Publishers), 333
- Jackson, Xanthopoulos, & Browne (1998) Jackson, N., Xanthopoulos, E., & Browne, I. W. A. 2000, MNRAS, 311, 389
- Jackson et al. (1998) Jackson, N., et al. 1998, MNRAS, 296, 483
- Jaunsen & Hjorth (1997) Jaunsen, A. O. & Hjorth, J. 1997, A&A, 317, 39
- Keeton, Christlein, & Zabludoff (2000) Keeton, C. R., Christlein, D., & Zabludoff, A. I. 2000, ApJ, 545, 129
- Keeton et al. (1998) Keeton, C. R., Kochanek, C. S., & Falco, E. E. 1998, ApJ, 509, 561
- Keeton et al. (1997) Keeton, C. R., Kochanek, C. S., & Seljak, U. 1997, ApJ, 482, 604
- Kochanek (1993) Kochanek, C. S. 1993, ApJ, 419, 12
- Kochanek et al. (2000a) Kochanek, C. S., Falco, E. E., Impey, C. D., Lehár, J., McLeod, B. A., Rix, H.-W., Keeton, C. R., Munõz, J. A, & Peng, C. Y. 2000a, ApJ, 535, 692
- Kochanek et al. (2000b) Kochanek, C. S., Falco, E. E., Impey, C. D., Lehár, J., McLeod, B. A., Rix, H.-W., Keeton, C. R., Munõz, J. A, & Peng, C. Y. 2000b, ApJ, 543, 131
- Koopmans & Fassnacht (1999) Koopmans, L. V. E. & Fassnacht, C. D. 1999, ApJ, 527, 513
- Kormann, Schneider, & Bartelmann (1994) Kormann, R., Schneider, P., & Bartelmann, M. 1994, A&A, 286, 357
- Kundić et al. (1997a) Kundić, T., Cohen, J. G., Blandford, R. D., & Lubin, L.M. 1997a, AJ, 114, 507
- Kundić et al. (1997b) Kundić, T., Hogg, D. W., Blandford, R. D., Cohen, J. G., Lubin, L. M., & Larkin, J. E. 1997b, AJ, 114, 2276
- Landolt (1992) Landolt, A. U. 1992, AJ, 104, 340
- Lubin et al. (1998) Lubin, L. M., Postman, M., Oke, J. B., Ratnatunga, K. U., Gunn, J. E., Hoessel, J. G., & Schneider, D. P. 1998, AJ, 116, 584
- Mahdavi et al. (1997) Mahdavi, A., Boehringer, H., Geller, M. J., & Ramella, M. 1997, ApJ, 483, 68
- Maoz & Rix (1993) Maoz, D. & Rix, H.-W. 1993, ApJ, 416, 425
- Mulchaey et al. (1996) Mulchaey, J. S., Davis, D. S., Mushotzky, R. F., Burstein, D. 1996, ApJ, 456, 80
- Muñoz et al. (1998) Muñoz, J. A., Falco, E. E., Kochanek, C. S., Lehár, J., McLeod, B. A., Impey, C. D., Rix, H.-W., & Peng, C. Y. 1998, Ap&SS, 263, 51
- Myers et al. (2001) Myers, S. T. et al. 2001, in Gravitational Lensing: Recent Progress and Future Goals, eds. T. G. Brainerd, & C. S. Kochanek, 51
- Oke (1990) Oke, J. B. 1990, AJ, 99, 1621
- Oke et al. (1995) Oke, J. B., et al. 1995, PASP, 107, 375
- Postman, Lubin, & Oke (1998) Postman, M., Lubin, L. M., & Oke, J. B. 1998, AJ, 116, 560
- Ramella et al. (1989) Ramella, M., Geller, M. J., & Huchra, J. P. 1989, ApJ, 344, 57
- Rusin et al. (2001) Rusin, D., Kochanek, C. S., Norbury, M., Falco, E. E., Impey, C. D., Lehár, J., McLeod, B. A., Rix, H.-W., Keeton, C. R., Muñoz, J. A., Peng, C. Y. 2001, ApJ, 557, 594
- Sandage (1961) Sandage, A. 1961, The Hubble Atlas, The Carnegie Institution of Washington Publication
- Sandage & Bedke (1994) Sandage, A. & Bedke, J. 1994, The Carnegie Atlas of Galaxies, The Carnegie Institution of Washington Publication
- Smail et al. (1997) Smail, I., Dressler, A., Couch, W. J., Ellis, R. E., Oemler, A., Butcher, H. R. & Sharples, R. M. 1997, ApJS, 110, 213
- Thuan & Gunn (1976) Thuan, T. X. & Gunn, J. E. 1976, PASP, 88, 543
- Tonry (1998) Tonry, J.L. 1998, AJ, 115, 1
- Tonry & Kochanek (1999) Tonry, J. L. & Kochanek, C. S. 1999, AJ, 117, 2034
- Tonry & Kochanek (2000) Tonry, J. L. & Kochanek, C. S. 2000, AJ, 119, 1078
- Tully (1987) Tully, R. B. 1987, ApJ, 321, 280
- Turner & Gott (1976) Turner, E. L. & Gott, J. R. 1976, ApJS, 32, 409
- Turner, Ostriker, & Gott (1984) Turner, E. L., Ostriker, J. P. & Gott, J. R. III 1984, ApJ, 284, 1
- Walsh et al. (1979) Walsh, D., Carswell, R. F., & Weymann, R. J. 1979, Nature, 279, 381
- Williams et al. (1996) Williams, R. E., et al. 1996, AJ, 112, 1335
- Young et al. (1980) Young, P., Gunn, J. E., Kristian, J., Oke, J. B., & Westphal, J. A. 1980, ApJ, 241, 507
- Zabludoff & Mulchaey (1998) Zabludoff, A. I. & Mulchaey, J. S. 1998, ApJ, 496, 39
- Zepf et al. (1997) Zepf, S.E., Moustakas, L.A., & Davis, M. 1997, ApJ, 474, 1


| Galaxy IDaaThe two numbers which comprise the galaxy ID represent the distance in RA(′′) and Dec(′′) from the lensing galaxy. | (″)bbThe distance from the lensing galaxy in arcseconds. | ccVariable-diameter aperture magnitude measured in an elliptical aperture of major axis radius of (where is the Kron radius), unless an error flag occurred in which case the “corrected” isophotal magnitude is used (see Bertin & Arnouts 1996). | ccVariable-diameter aperture magnitude measured in an elliptical aperture of major axis radius of (where is the Kron radius), unless an error flag occurred in which case the “corrected” isophotal magnitude is used (see Bertin & Arnouts 1996). | ccVariable-diameter aperture magnitude measured in an elliptical aperture of major axis radius of (where is the Kron radius), unless an error flag occurred in which case the “corrected” isophotal magnitude is used (see Bertin & Arnouts 1996). | ||||||
|---|---|---|---|---|---|---|---|---|---|---|
| G103090 | 90.19 | 504.37 | 136.8 | ddAn error flag occurred indicating that bright neighbors may bias magnitude estimate and/or it was originally a blend. | ddAn error flag occurred indicating that bright neighbors may bias magnitude estimate and/or it was originally a blend. | ddAn error flag occurred indicating that bright neighbors may bias magnitude estimate and/or it was originally a blend. | 21.13ddAn error flag occurred indicating that bright neighbors may bias magnitude estimate and/or it was originally a blend. | 1.477 | 0.540 | |
| G093073 | 140.86 | 582.49 | 118.1 | 23.45 | 1.812 | |||||
| G089151 | 155.10 | 212.98 | 175.6 | 21.04 | 1.311 | 0.557 | ||||
| G075183 | 221.68 | 60.80 | 198.0 | 22.58 | 1.264 | 0.721 | ||||
| G066098 | 267.65 | 465.08 | 118.1 | 22.58 | 2.651 | 1.854 | ||||
| G056020 | 313.60 | 1022.05 | 59.7 | 22.05 | 1.410 | 0.483 | ||||
| G052071 | 334.83 | 593.45 | 87.5 | ddAn error flag occurred indicating that bright neighbors may bias magnitude estimate and/or it was originally a blend. | ddAn error flag occurred indicating that bright neighbors may bias magnitude estimate and/or it was originally a blend. | ddAn error flag occurred indicating that bright neighbors may bias magnitude estimate and/or it was originally a blend. | 19.97ddAn error flag occurred indicating that bright neighbors may bias magnitude estimate and/or it was originally a blend. | 2.611 | 0.872 | |
| G051068 | 338.10 | 608.25 | 84.8 | ddAn error flag occurred indicating that bright neighbors may bias magnitude estimate and/or it was originally a blend. | ddAn error flag occurred indicating that bright neighbors may bias magnitude estimate and/or it was originally a blend. | ddAn error flag occurred indicating that bright neighbors may bias magnitude estimate and/or it was originally a blend. | 20.78ddAn error flag occurred indicating that bright neighbors may bias magnitude estimate and/or it was originally a blend. | 1.677 | 0.654 | |
| G047091 | 358.42 | 498.97 | 102.0 | 21.38 | 2.476 | 0.956 | ||||
| G044167 | 367.50 | 135.59 | 173.3 | ddAn error flag occurred indicating that bright neighbors may bias magnitude estimate and/or it was originally a blend. | ddAn error flag occurred indicating that bright neighbors may bias magnitude estimate and/or it was originally a blend. | 21.21ddAn error flag occurred indicating that bright neighbors may bias magnitude estimate and/or it was originally a blend. | 1.331 | 0.621 | ||
| G041181 | 384.33 | 70.38 | 185.6 | ddAn error flag occurred indicating that bright neighbors may bias magnitude estimate and/or it was originally a blend. | ddAn error flag occurred indicating that bright neighbors may bias magnitude estimate and/or it was originally a blend. | ddAn error flag occurred indicating that bright neighbors may bias magnitude estimate and/or it was originally a blend. | 19.59ddAn error flag occurred indicating that bright neighbors may bias magnitude estimate and/or it was originally a blend. | 1.473 | 0.703 | |
| G041159 | 385.08 | 174.10 | 164.3 | 22.15 | 1.914 | 1.183 | ||||
| G034064 | 415.75 | 624.91 | 72.4 | ddAn error flag occurred indicating that bright neighbors may bias magnitude estimate and/or it was originally a blend. | ddAn error flag occurred indicating that bright neighbors may bias magnitude estimate and/or it was originally a blend. | ddAn error flag occurred indicating that bright neighbors may bias magnitude estimate and/or it was originally a blend. | 23.00ddAn error flag occurred indicating that bright neighbors may bias magnitude estimate and/or it was originally a blend. | 1.512 | 0.576 | |
| G034113 | 417.71 | 392.75 | 118.0 | ddAn error flag occurred indicating that bright neighbors may bias magnitude estimate and/or it was originally a blend. | 21.10 | 1.967 | 0.759 | |||
| G029021 | 443.14 | 827.18 | 35.8 | 21.68 | 2.490 | 1.018 | ||||
| G020010 | 483.40 | 880.76 | 22.6 | 22.68 | 2.089 | 1.433 | ||||
| G018031 | 492.29 | 782.94 | 35.7 | ddAn error flag occurred indicating that bright neighbors may bias magnitude estimate and/or it was originally a blend. | ddAn error flag occurred indicating that bright neighbors may bias magnitude estimate and/or it was originally a blend. | ddAn error flag occurred indicating that bright neighbors may bias magnitude estimate and/or it was originally a blend. | 23.09ddAn error flag occurred indicating that bright neighbors may bias magnitude estimate and/or it was originally a blend. | 2.180 | 1.657 | |
| G018079 | 494.99 | 553.14 | 81.2 | 20.56 | 2.467 | 0.920 | ||||
| G015122 | 505.21 | 350.79 | 123.0 | ddAn error flag occurred indicating that bright neighbors may bias magnitude estimate and/or it was originally a blend. | 21.39 | 2.471 | 1.018 | |||
| G016007 | 504.10 | 960.50 | 17.4 | ddAn error flag occurred indicating that bright neighbors may bias magnitude estimate and/or it was originally a blend. | ddAn error flag occurred indicating that bright neighbors may bias magnitude estimate and/or it was originally a blend. | 21.37ddAn error flag occurred indicating that bright neighbors may bias magnitude estimate and/or it was originally a blend. | 2.280 | 0.986 | ||
| G015015 | 509.65 | 997.07 | 20.9 | ddAn error flag occurred indicating that bright neighbors may bias magnitude estimate and/or it was originally a blend. | ddAn error flag occurred indicating that bright neighbors may bias magnitude estimate and/or it was originally a blend. | ddAn error flag occurred indicating that bright neighbors may bias magnitude estimate and/or it was originally a blend. | 19.50ddAn error flag occurred indicating that bright neighbors may bias magnitude estimate and/or it was originally a blend. | 2.160 | 0.816 | |
| G010120 | 530.96 | 360.63 | 120.4 | 22.89 | 3.758 | 1.035 | ||||
| G008009 | 542.70 | 969.82 | 11.9 | ddAn error flag occurred indicating that bright neighbors may bias magnitude estimate and/or it was originally a blend. | ddAn error flag occurred indicating that bright neighbors may bias magnitude estimate and/or it was originally a blend. | ddAn error flag occurred indicating that bright neighbors may bias magnitude estimate and/or it was originally a blend. | 19.83ddAn error flag occurred indicating that bright neighbors may bias magnitude estimate and/or it was originally a blend. | 2.644 | 0.910 | |
| G007017 | 543.30 | 849.15 | 18.2 | ddAn error flag occurred indicating that bright neighbors may bias magnitude estimate and/or it was originally a blend. | ddAn error flag occurred indicating that bright neighbors may bias magnitude estimate and/or it was originally a blend. | ddAn error flag occurred indicating that bright neighbors may bias magnitude estimate and/or it was originally a blend. | 21.86ddAn error flag occurred indicating that bright neighbors may bias magnitude estimate and/or it was originally a blend. | 3.319 | 1.730 | |
| G006050 | 550.69 | 1161.25 | 50.0 | ddAn error flag occurred indicating that bright neighbors may bias magnitude estimate and/or it was originally a blend. | ddAn error flag occurred indicating that bright neighbors may bias magnitude estimate and/or it was originally a blend. | 20.77ddAn error flag occurred indicating that bright neighbors may bias magnitude estimate and/or it was originally a blend. | 2.687 | 1.274 | ||
| G005054 | 554.18 | 1181.12 | 54.0 | ddAn error flag occurred indicating that bright neighbors may bias magnitude estimate and/or it was originally a blend. | ddAn error flag occurred indicating that bright neighbors may bias magnitude estimate and/or it was originally a blend. | 21.59ddAn error flag occurred indicating that bright neighbors may bias magnitude estimate and/or it was originally a blend. | 2.164 | 0.965 | ||
| G005037 | 558.10 | 754.35 | 36.9 | ddAn error flag occurred indicating that bright neighbors may bias magnitude estimate and/or it was originally a blend. | ddAn error flag occurred indicating that bright neighbors may bias magnitude estimate and/or it was originally a blend. | ddAn error flag occurred indicating that bright neighbors may bias magnitude estimate and/or it was originally a blend. | 21.72ddAn error flag occurred indicating that bright neighbors may bias magnitude estimate and/or it was originally a blend. | 0.961 | 0.859 | |
| G003041 | 566.08 | 1120.59 | 41.1 | 22.32 | 2.212 | 0.788 | ||||
| G001022 | 584.12 | 824.32 | 21.8 | ddAn error flag occurred indicating that bright neighbors may bias magnitude estimate and/or it was originally a blend. | 22.47 | 1.573 | 0.800 | |||
| G009005 | 622.75 | 949.82 | 10.5 | 21.34 | 1.315 | 0.421 | ||||
| G013006 | 639.48 | 900.34 | 14.0 | ddAn error flag occurred indicating that bright neighbors may bias magnitude estimate and/or it was originally a blend. | 23.01 | 1.769 | 1.562 | |||
| G028107 | 711.75 | 422.28 | 110.5 | 21.65 | 2.783 | 1.441 | ||||
| G047062 | 798.78 | 1221.65 | 77.8 | ddAn error flag occurred indicating that bright neighbors may bias magnitude estimate and/or it was originally a blend. | 21.06 | 2.752 | 1.038 | |||
| G063045 | 873.53 | 1140.66 | 77.2 | ddAn error flag occurred indicating that bright neighbors may bias magnitude estimate and/or it was originally a blend. | 22.04ddAn error flag occurred indicating that bright neighbors may bias magnitude estimate and/or it was originally a blend. | 2.003 | 0.750 | |||
| Galaxy IDaaThe two numbers which comprise the galaxy ID represent the distance in RA(′′) and Dec(′′) from the lensing galaxy. | (″)bbThe distance from the lensing galaxy in arcseconds. | ccVariable-diameter aperture magnitude measured in an elliptical aperture of major axis radius of (where is the Kron radius), unless an error flag occurred in which case the “corrected” isophotal magnitude is used (see Bertin & Arnouts 1996). | ccVariable-diameter aperture magnitude measured in an elliptical aperture of major axis radius of (where is the Kron radius), unless an error flag occurred in which case the “corrected” isophotal magnitude is used (see Bertin & Arnouts 1996). | ccVariable-diameter aperture magnitude measured in an elliptical aperture of major axis radius of (where is the Kron radius), unless an error flag occurred in which case the “corrected” isophotal magnitude is used (see Bertin & Arnouts 1996). | ||||||
|---|---|---|---|---|---|---|---|---|---|---|
| G102338 | 661.77 | 489.52 | 352.8 | ddAn error flag occurred indicating that bright neighbors may bias magnitude estimate and/or it was originally a blend. | ddAn error flag occurred indicating that bright neighbors may bias magnitude estimate and/or it was originally a blend. | 22.74ddAn error flag occurred indicating that bright neighbors may bias magnitude estimate and/or it was originally a blend. | 0.344 | |||
| G060318 | 772.06 | 540.72 | 323.8 | 22.35 | 0.517 | |||||
| G059221 | 775.20 | 797.89 | 228.5 | 22.87 | 0.514 | |||||
| G055329 | 784.91 | 511.14 | 334.0 | 22.80 | 1.140 | |||||
| G053305 | 790.79 | 575.14 | 309.7 | 20.45 | 0.788 | 0.327 | ||||
| G041353 | 821.36 | 450.10 | 354.9 | 21.04 | 1.430 | 0.412 | ||||
| G041203 | 824.38 | 845.61 | 206.6 | 22.00 | 0.040 | 0.070 | ||||
| G036295 | 836.48 | 600.64 | 297.5 | ddAn error flag occurred indicating that bright neighbors may bias magnitude estimate and/or it was originally a blend. | ddAn error flag occurred indicating that bright neighbors may bias magnitude estimate and/or it was originally a blend. | ddAn error flag occurred indicating that bright neighbors may bias magnitude estimate and/or it was originally a blend. | 17.84ddAn error flag occurred indicating that bright neighbors may bias magnitude estimate and/or it was originally a blend. | 0.749 | 0.062 | |
| G024232 | 867.22 | 768.98 | 232.8 | 22.05 | 1.132 | -0.003 | ||||
| G009250 | 906.15 | 719.04 | 250.6 | 21.18 | 1.176 | 0.526 | ||||
| G008327 | 909.94 | 516.29 | 327.4 | 21.41 | 1.308 | 0.010 | ||||
| G003348 | 937.26 | 462.25 | 347.8 | 22.25 | 0.719 | 0.150 | ||||
| G009206 | 955.31 | 835.30 | 206.5 | 21.32 | 1.336 | 0.629 | ||||
| G015280 | 969.97 | 640.32 | 280.6 | 23.08 | 0.552 | 0.535 | ||||
| G017339 | 974.33 | 484.22 | 339.8 | 21.00 | 0.772 | 0.168 | ||||
| G039307 | 1032.55 | 569.32 | 309.4 | 20.86 | 1.461 | 1.122 | ||||
| G043198 | 1044.55 | 856.72 | 202.6 | 19.79 | 0.643 | 0.306 | ||||
| G077243 | 1134.94 | 736.66 | 255.4 | 22.37 | 1.487 | 0.930 | ||||
| G078224 | 1138.10 | 786.81 | 237.7 | 22.82 | -0.089 | -0.225 | ||||
| G087262 | 1159.39 | 686.62 | 276.3 | ddAn error flag occurred indicating that bright neighbors may bias magnitude estimate and/or it was originally a blend. | ddAn error flag occurred indicating that bright neighbors may bias magnitude estimate and/or it was originally a blend. | 21.53ddAn error flag occurred indicating that bright neighbors may bias magnitude estimate and/or it was originally a blend. | 0.361 | |||
| G088260 | 1161.92 | 692.79 | 274.4 | ddAn error flag occurred indicating that bright neighbors may bias magnitude estimate and/or it was originally a blend. | ddAn error flag occurred indicating that bright neighbors may bias magnitude estimate and/or it was originally a blend. | 21.74ddAn error flag occurred indicating that bright neighbors may bias magnitude estimate and/or it was originally a blend. | -0.076 | 0.344 | ||
| G087212 | 1160.21 | 819.47 | 229.1 | 21.84 | 0.980 | 0.439 | ||||
| Galaxy | Chip | aaIn order to combine the drizzled data, each chip is mapped onto image with a pixel scale which is one-half of the input pixel scale. The and positions are derived from these mapped images. | aaIn order to combine the drizzled data, each chip is mapped onto image with a pixel scale which is one-half of the input pixel scale. The and positions are derived from these mapped images. | ClassbbThe standard Hubble classification scheme (e.g., E, S0, Sa, Sab etc.). | ccDisturbance index : 0, normal; 1, moderate asymmetry; 2, strong asymmetry; 3, moderate distortion; 4, strong distortion. | InterpddInterpretation of disturbance index : M, merger; I, tidal interaction with neighbor; T, tidal feature; C, chaotic. | CommentseeDescription of galaxy morphology. |
|---|---|---|---|---|---|---|---|
| G009005 | 1 | 1379.24 | 1409.81 | Sc | 2 | face-on; small bulge; diffuse, low SB disk | |
| G008009 | 1 | 611.17 | 1315.62 | E | 0 | face-on | |
| G016007 | 1 | 314.26 | 1116.14 | S | 0 | edge-on spiral; on edge of chip | |
| G015015 | 2 | 832.39 | 318.38 | Sa | 0 | face-on; indication of arm or dust lane; on edge of chip | |
| G001022 | 4 | 384.06 | 842.06 | Sc | 2 | face-on; small bulge; diffuse, low SB disk | |
| G029021 | 3 | 333.49 | 589.62 | E | 0 | inclined | |
| G056020 | 2 | 625.58 | 1133.79 | Sc | 3 | C | several bright knots in diffuse disk |
| G018079 | 4 | 1597.59 | 890.72 | S0 | 0 | slightly asymmetric disk | |
| G052071 | 3 | 406.59 | 1683.43 | S0 | 0 | face-on; close companion to the north |
| Lens System | aaNumber of group members including the lensing galaxy if applicable. | bbWe have used the redshifts and positions given in the papers listed in §1 to calculate the group parameters and errors according to the method described in §4 and the definitions given by Ramella et al. (1989). | bbWe have used the redshifts and positions given in the papers listed in §1 to calculate the group parameters and errors according to the method described in §4 and the definitions given by Ramella et al. (1989). | bbWe have used the redshifts and positions given in the papers listed in §1 to calculate the group parameters and errors according to the method described in §4 and the definitions given by Ramella et al. (1989). | bbWe have used the redshifts and positions given in the papers listed in §1 to calculate the group parameters and errors according to the method described in §4 and the definitions given by Ramella et al. (1989). | |||
|---|---|---|---|---|---|---|---|---|
| (km s-1) | ( Mpc) | () | ||||||
| CLASS B0712+472 | 1.339 | 0.4060 | 10 | 0.2909 | 0.018 | |||
| MG 0751+2716 | 3.200 | 0.3502 | 3 | 0.3503 | 0.060 | |||
| PG 1115+080 | 1.718 | 0.3098 | 4 | 0.3103 | 0.007 | |||
| MG 1131+0456 | 0.8440 | 3 | 0.3432 | 0.017 | ||||
| JVAS B1422+231 | 3.626 | 0.3374 | 6 | 0.3381 | 0.003 |